The role of social media: The TravelPlot Porto case study
SORAIA FERREIRA * [ [email protected] ]
ARTUR PIMENTA ALVES ** [ [email protected] ]
CÉLIA QUICO *** [ [email protected] ]
Abstract | Social media plays an essential part on today’s marketing campaigns. It gives brands the opportunity to reach a worldwide audience with few resources, trying to influence the consumer decision-making process. In 2012, Porto became the setting of a pilot location based transmedia storytelling experiment – TravelPlot Porto. During twelve weeks, tourists were invited to physically embark on a treasure hunt, while visiting Porto, or virtually on the social networks of the project. This paper analyses the audience behavior on TravelPlot Porto’s social media channels – Facebook, Twitter and YouTube. All social networks reached a high number of users in different countries, indicating a great potential of social media as a tool for the promotion of tourism and in particular location based transmedia storytelling projects.
Keywords | Location based transmedia storytelling, Redes sociais.
Resumo | As redes sociais desempenham um papel essencial nas campanhas de marketing nos tempos de hoje. Estas proporcionam às marcas a oportunidade de alcançarem os públicos-alvos, e influenciarem o processo de decisão duma audiência mundial com recursos limitados. Em 2012, o Porto foi palco de uma experiência piloto – TravelPlot Porto. Este projeto location based transmedia storytelling convidou os turistas a participarem numa caça ao tesouro, in loco durante a sua visita à cidade, ou virtualmente, através das redes sociais. Este artigo analisa o comportamento dos utilizadores nas redes sociais institucionais integradas no TravelPlot Porto. Da análise destas três redes sociais – Facebook, Twitter e YouTube – conclui-se que o número de utilizadores alcançado em diferentes países foi elevado, revelando um grande po-tencial das redes sociais para a promoção do turismo, e em particular, nos projetos location based transmedia storytelling. Palavras-chave | Location based transmedia storytelling, Social media.
* PhD candidate in Digital Media at University of Porto. Researcher at INESC TEC/INESC Porto and Lecturer at University of Porto. ** PhD in Electric Engineering at University of Bradford. Researcher at INESC TEC/INESC Porto and Full Professor at University of Porto. *** PhD in Communication Sciences at University Nova of Lisbon. Professor and Researcher at University Lusófona of Humanities and Technologies.
1. Introduction
Humans are social creatures that crave for social interactions. Social groups allow humans to share experiences, learn and help each other. Thirty thousand years ago, social groups gathered around a campfire, presently they are scattered around the world (Blanchard, 2011, p. 1).
Social media transformed the way today sumers find and share information. They are con-nected, in control of experiences, both online and in the real world. Social media has also changed the shopping habits, the referrals of brands and the decision-making process (Solis, 2011, pp. 3-9). It is a critical part of how travellers gather information on destinations, book and share their experiences (Minazzi & Lagrosen, 2013).
Due to the infancy of location based transmedia storytelling projects applied to tourism, no research has been conducted to study its use of social media. Thus, this study contributes with comprehensive insights to the literature of social media brand en-gagement on location based transmedia storytelling projects.
2. Literature review
Social media was present in the Egyptian, Indian, Chinese, Greek and Roman empires in the form of handwritten newsletters that circulated amongst elite groups. In early modern Europe, there were news-letters circulated by the banking houses. The digital social media began with email networks named ‘list-servs’ and ‘Usenet’ groups, which were very popular in universities. Today’s digital social media uses ‘web browsers’ and applications (Kovarik, 2011, pp. 164-316). The present social media was defined by Turban et al. (2008, cited by Buhalis & Jun, 2011, p. 8) as “the online platform and tools that people use to share opinions and experiences, including photos, videos, music, insights, and perceptions with each other”.
Social networking is one of the most popular online activities worldwide, reaching 82% of the world’s online population (1,2 billion users). Nearly one in every five minutes spent online are on social networking sites. It is a global cultural phenomenon, growing in every single country (comScore, 2011). In 2012, social networking already reached 1,5 billion people, with social networks showing an impressive degree of awareness where Facebook is near 100%, Twitter reaches 80% and Google+ 70%. Social networks are part of consumers’ daily lives with six out of ten people going at least once a day to a social network site. Social network applications are the most popular applications on smartphones (Belleghem, Thijs & Ruyck, 2012).
There are several drivers for the continued growth of social media, namely the mobile tech-nology such as smartphones and tablets that allow consumers to use social media when and how, they want. Another driver is the proliferation of social media sites like Facebook, Twitter, YouTube and Pinterest (Nielsen, 2012). According to a Forrester estimate, in 2011, consumers have generated more than 500 billion impressions about products and services through social media. Many consumers are learning about brands on social media instead of traditional channels (Facebook, 2012a). They are also using social media to obtain information about brands. For example, in 2009, 12% of consumers used ratings and reviews to gather information about online purchases. In 2011, that number was already 57% (Facebook, 2012a).
Social media has impacted marketing in three main areas: the word-of-mouth that became social, ending with the interaction limitation and expo-nentially increasing the universe of opinions and feedback; the level of information increased which transformed the consumers’ purchase decision and the new engagement opportunities that emerged with the advent of social media (Nielsen, 2012).
The report Social media around the world 2012 indicates that more than half of the users of the social networks (55%) are connected to brands and
expect brands to give product information, make promotions, give freebies, post news and use follow-ers to co-create projects. It carries on by identifying the motivations behind the use of social media, which are: communicating with loved-ones, killing time, sharing photos or interesting information. Even though interacting with brands is last in people’s priorities, more than half of the people have at least an online relationship with a brand. On average, they follow passively between eight to twelve brands and actively between three and six brands. The majority starts following the brand after using their products and being happy with it (Belleghem et al., 2012).
Consumers want and expect brands to interact with them through social media. They expect to receive exclusive deals (56%), new products and services (34%), and for the company to hear them (22%). CMO Council and Lithium survey shows that the vast majority of consumers (80%) are more likely to try new things if they were suggested by friends on social media (Facebook, 2012a).
The adoption of social media practices in tourism marketing is critical (Hays, Page & Buhalis, 2013) since they impact tourists’ decision-making process, including their information search, travel intention identification and the sharing of travel experienc-es (Ge, Gretzel & Clarke, 2013). Tourists used to share their travel experiences on their return home. Today the sharing is immediate through the social networks, amplifying travel brands exposure (JWT, 2011). Social media is a fundamental platform for tourism marketers (Ge et al., 2013) with potential benefits for the promotion of hospitality and tourism businesses (Ayeh, Leung, Au & Law, 2012; Inversini & Sykes, 2013).
Implications of social media for the tourism industry include humanizing of the brand, increased engagement and interaction (Hays et al., 2013; Inversini & Sykes, 2013), increased loyalty and electronic word-of-mouth that could drive corporate sales and revenues (Minazzi & Lagrosen, 2013).
3. TravelPlot Porto
TravelPlot Porto is a location based transmedia storytelling project, part of a broader investigation which aims to understand the impact of using trans-media storytelling techniques applied to tourism, particularly the advantages, disadvantages and the best practices. This pilot trial was launched on June
17th and ended on September 9th 2012. During this
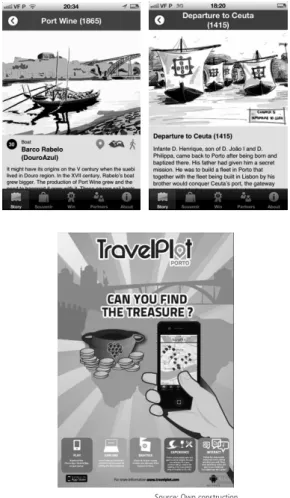
period, tourists had the opportunity to discover the city of Porto by doing a treasure hunt (Figure 1). TravelPlot Porto story (Figure 2 and Figure 3) was
Figure 1 | TravelPlot Porto poster.
Figure 2 | TravelPlot Porto screenshot narrative line:departure to Ceuta.
Figure 3 | TTravelPlot Porto location: barco rabelo (DouroAzul).
scattered across different platforms such as a mobile application (iPhone and Android), a website, social networks (Facebook, Twitter, Pinterest and YouTube), a print map and live events (gastronomy, wine tast-ing, Douro river cruise and souvenirs) (Ferreira, Alves & Quico, 2012).
This paper principal focus is to analyze the au-dience engagement on TravelPlot Porto brand social media platforms - Facebook, Twitter and YouTube.
4. Methodology
TravelPlot Porto had six social networks, which served two main purposes. Three social networks - Twitter, Pinterest, YouTube – were an intricate part of TravelPlot Porto’s story. There, the TravelP-lot Porto story protagonist Peter, shared his daily progress and interacted with the audience. The other three social networks – Facebook, Twitter and YouTube – were dedicated to TravelPlot Porto brand followers. TravelPlot Porto Facebook and Twitter aimed to attract attention, create interest, stimulate desire and inspire action towards Trav-elPlot Porto. The content posted ranged from news related to the project, to TravelPlot Porto partners and other brand related information. TravelPlot Porto YouTube channel was only comprised by the two versions of the project’s trailer – English and Portuguese version.
TravelPlot Porto brand social networks were
launched on June 1st, prior to the beginning of
Trav-elPlot Porto, with the teaser ‘Did you know there is a hidden treasure in Porto?’. In the days leading to its launch, several information regarding the story and characters was released on TravelPlot Porto’s Facebook and Twitter account (Facebook, 2012b; Twitter, 2012; YouTube, 2012).
From the analyses to Peter’s social networks, three main conclusions were reached. Peter’s Twitter was the social network where the audi-ence interacted and manifested their desire to
join the story’s treasure hunt and also to go to the story locations. This social network, witness an engagement increased on the last few weeks of TravelPlot Porto. Peter’s Pinterest, on the other hand, functioned as a promotional element to the city of Porto and Portugal, with the two most pop-ular names for the ‘repin’ followers boards being one or a combination of these three words – Travel & Places & Spaces – and Portugal. Peter’s YouTube channel felt short on engaging the audience (Fer-reira, Alves & Quico, 2014).
The data collection for this analysis took place
between June 17th and September 10th 2012, in
order to match with the remaining analyses car-ried out in the other platforms. This time period corresponded to the beginning of TravelPlot Porto and the day after the end of this project. The data collection methods, which had the objective to capture the user behavior on the platforms and their usage, included various online measuring tools that were available during this pilot expe-rience like Facebook Analytics, TweetReach and YouTube Analytics.
When TravelPlot Porto began, on June 17th,
there were already 76 followers on the Facebook account attained during the pre-launch. On July
30th, the number of fans was 357 and on
Septem-ber 10th the number of fans was 403. TravelPlot
Porto’s Twitter account had already 129 followers
on the projects’ launch on June 17th. On September
10th, there were 422 followers. TravelPlot Porto’s
YouTube channel had 1,701 views and eight likes. The English version had 1,254 views and five likes while the Portuguese version had 447 views and three likes.
One of the researchers had an active interac-tion with the social networks. This compromise was necessary because of the need to check the material that was being uploaded on the social networks and the need to promote TravelPlot Porto, an unknown project to the public that was tested in a real world environment. This interaction was kept to the minimum.
5. Results
5.1. TravelPlot Porto Facebook
Based on the users’ IP address, there were unique users from 25 countries who liked TravelPlot Porto Facebook page. The users from Finland, Croatia and Republic of Korea unliked the page before the end of the project. The vast majority of unique users were from Portugal (85.9%), followed by the United Kingdom (3.2%), Brazil (2.7%) and United States (2.2%).
There was only information about the city of 330 users. This can be explained by several factors, namely if the user didn’t indicate the name of the city on his Facebook profile. The users were mainly from Portuguese cities (92.1%). There were only 7.9% users from foreign cities. During the project, there were likes from ninety Portuguese cities and sixty foreign cities.
According to the data entered into the Facebook profile, 54% of the unique users who liked TravelPlot Porto Facebook page were female while 44% were male. The remaining 2% didn’t indicate their genre. The biggest age bracket was between 25-34 years old with 40%, followed by the 35-44 age bracket
with 26% and the 18-24 age bracket with 19%. The remaining 15% unique users were between 13-17 and 45 years old or more.
Facebook metric ‘impressions’ measures the number of times a post from the page is displayed, whether the post is clicked on or not. People may see multiple impressions of the same post (Facebook, 2011). For example, a fan might see a page update in the news feed once, and then a second time if their friend shares it.
The ‘lifetime post total impressions’ of TravelPlot Porto Facebook page was 143,790 impressions. The daily average of impressions was 765 daily impres-sions. The highest number of daily impressions was 1,438 and 284 was the minimum of daily impres-sions (Figure 4). TravelPlot Porto Facebook page only had ‘organic’ and ‘viral’ impressions. ‘Organic impressions’ are defined by Facebook as the number of unique users who saw the page post in news feed or ticker, or on the page’s wall while ‘viral impres-sions’ are the total account of those impressions of the page post in a story generated by a friend. The total count of ‘lifetime post organic impressions’ was 128,910 impressions. The daily average was 686, the maximum was 1,352 and the minimum was 199 impressions (Figure 4). As for the ‘lifetime post viral impressions’, the total count was 14,880
0 200 400 600 800 1000 1200 1400 1600 1 -1 -0 0 1 -7 -0 0 1 -1 3 -0 0 1 -1 9 -0 0 1 -2 5 -0 0 1 -3 1 -0 0 2 -6 -0 0 2 -1 2 -0 0 2 -1 8 -0 0 2 -2 4 -0 0 3 -1 -0 0 3 -7 -0 0 3 -1 3 -0 0 3 -1 9 -0 0 3 -2 5 -0 0 3 -3 1 -0 0 4 -6 -0 0 4 -1 2 -0 0 4 -1 8 -0 0 4 -2 4 -0 0 4 -3 0 -0 0 5 -6 -0 0 5 -1 2 -0 0 5 -1 8 -0 0 5 -2 4 -0 0 5 -3 0 -0 0 6 -5 -0 0 6 -1 1 -0 0 6 -1 7 -0 0 6 -2 3 -0 0 6 -2 9 -0 0 7 -5 -0 0
Lifetime Post Viral Impressions Lifetime Post Organic Impressions
Lifetime Post Total Impressions
Figure 4 | Total, ‘organic’ and ‘viral lifetime post impressions’.
impressions. The maximum post ‘viral impressions’ were 486 and the minimum one (Figure 4). The daily average of ‘viral impressions’ was 82 impressions.
According to Facebook, the metric ‘reach’ “measures the number of people who received impressions of a page post” (Facebook, 2012a). The average daily ‘lifetime post total reach’ was 243 unique users, with a maximum of 479 and a mini-mum of 97 unique users (Figure 5). The reach can be ‘organic’, ‘viral’ or ‘paid’. In our case study, there was only ‘organic’ and ‘viral’ reach since no advertising was done. The ‘organic reach’ measures the number of unique people, fans or non-fans, who saw the post in their news feed, ticker or on the page while ‘viral reach’ measures the number of unique people who saw the post from a story published by a friend (Facebook, 2012a). The average daily ‘lifetime post organic reach’ was 194 unique users. The maximum was 264 unique users and the minimum 61 unique users (Figure 5). As for the ‘lifetime post viral reach’, the average was 52 unique daily users. The maximum was 268 unique users and the minimum one unique user (Figure 5).
‘Average post engagement rate’ is measured by the average number of ‘likes’, ‘comments’ and ‘shares’ per post on a given day divided by the total number of fans for the page (Socialbakers, 2011).
TravelPlot Porto Facebook page had a 5% ‘average post engagement rate’ throughout the project. The maximum ‘average post engagement rate’ was 29% and the minimum 0% (Figure 6). Looking at figure 6, the highest ‘average post engagement rate’ oc-cur on the launch of TravelPlot Porto on June 17th (29%), followed by the August 20th that with a single post about Alto Douro Wine Region achieved a 28% ‘average post engagement rate’. The other three highest ‘average post engagement rate’ were related to news that followed the press conference of TravelPlot Porto on June 21st: June 27th (27%), June 23rd (19%) and June 22nd (14%).
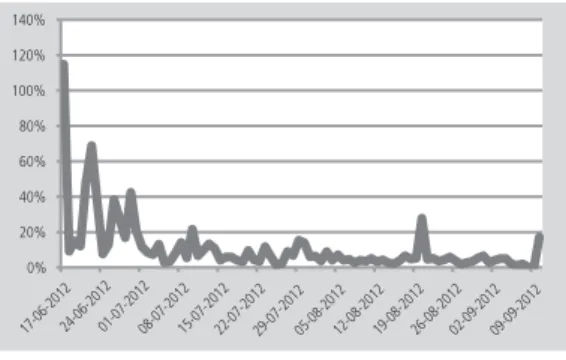
‘Daily page engagement rate’ is measured as the average number of ‘likes’, ‘comments’ and ‘shares’ on a given day divided by the total number of fans for the page. The ‘daily page engagement rate’ was 11%, which according to Socialbakers is above the average of a Facebook page between zero and 10,000 fans that has an average engagement rate of 0.96% (Socialbakers, 2011). Looking at figure 7, the day with the maximum ‘engagement rate’ was June 17th, the day of TravelPlot Porto launch, followed by the days of the press conference of TravelPlot Porto and associated news: June 22nd (69%), June 21st (49%), June 29th (42%), June 26th (38%) and June 23rd (37%). 0 100 200 300 400 500 600
Lifetime Post Total Reach Lifetime Post Organic Reach
Lifetime Post Viral Reach
17-06 -2012 24-06 -2012 01-07 -2012 08-07 -2012 15-07 -2012 22-07 -2012 29-07 -2012 05-08 -2012 12-08 -2012 19-08 -2012 26-08 -2012 02-09 -2012 09-09 -2012
Figure 5 | Total, ‘organic’ and ‘viral lifetime post reach’.
5.2. TravelPlot Porto Twitter
TravelPlot Porto teaser was launched on June 1st on TravelPlot Porto’s Facebook and Twitter accounts. There was an immediate interested by the communi-ty. For example, Jonathan Belisle (@Wuxia) on June 3rd tweeted “@TravelPlot locating a treasure in Por-to hey ;), while Blerime Topalli (@Blerime) on June 4th tweeted “@TravelPlot we need more details in the next teaser! ;)” and “Portugal’s on my travel list – now I know where to start! RT @TravelPlot Porto teaser on.fb.me/LgB3e6 #transmedia travelplot. com” (Twitter, 2012).
TweetReach describes ‘reach’ as “the number of unique twitter accounts that received tweets about your query” (TweetReach, 2013) or by other words, the total number of unique twitter users that received tweets about the search term. According to TweetReach data, the biggest reach of TravelPlot Porto’s Twitter account occurred on June 26th, when 51,489 unique twitter users received tweets about TravelPlot Porto. This matched the public presenta-tion of the project on June 21st. After this date, TravelPlot Porto’s twitter account reached between 19,900 and 1,032 unique users.
TweetReach defines ‘exposure’ as “the total number of impressions generated by tweets in your report” (TweetReach, 2013). The highest exposure of TravelPlot Porto’s Twitter account occurred on June 26th, with 57,450 total impressions, after TravelPlot Porto’s public presentation. The exposure of
TravelP-lot Porto’s Twitter account for the remaining of the project was between 25,171 and 6,702 impressions. The ratio between ‘reach’ and ‘exposure’ repre-sents “the depth of penetration of tweets about a topic” (TweetReach Blog, 2011). The overall average ratio throughout TravelPlot Porto was average (0.5): indicates a normal distribution of tweets, retweets and amplification. There were two periods when the average ratio was high (0.6-0.99): June 26th-29th and July 10th-13rd. This shows that a wide variety of different people were tweeting to a number of diverse followers, spreading the message far and wide during these periods.
On June 18th, Gary Hayes (@GaryPHayes), a
mul-ti-platform producer tweeted to more than 33,700 followers “Now this looks interesting. Storytelling meets Transmedia Tourist GPS walk-arounds – Trav-elPlot”. Gary’s follower (@tourismstory) tweeted “Destination experience combines tourism #Trans-media (benchmark just went higher 4 DMO’s)”. Two days later, Laurel Papworth (@SilkCharm), one of Forbes Top 50 social media influencers, retweeted ‘@ tourismstory’ tweet to more than 40,500 followers (Twitter, 2012).
5.3. TravelPlot Porto YouTube channel
TravelPlot Porto trailer (English and Portuguese version) was viewed by 38 countries on the YouTube channel. The countries, which viewed it more often,
Figure 6 | The ‘average post engagement rate’. Figure 7 | The ‘daily page engagement rate’.
Source: Own construction. Source: Own construction.
0% 5% 10% 15% 20% 25% 30% 35% 17-06 -2012 24-06 -2012 01-07 -2012 08-07 -2012 15-07 -2012 22-07 -2012 29-07 -2012 05-08 -2012 12-08 -2012 19-08 -2012 26-08 -2012 02-09 -2012 09-09 -2012 0% 20% 40% 60% 80% 100% 120% 140% 17-06 -2012 24-06 -2012 01-07 -2012 08-07 -2012 15-07 -2012 22-07 -2012 29-07 -2012 05-08 -2012 12-08 -2012 19-08 -2012 26-08 -2012 02-09 -2012 09-09 -2012
were Portugal (1,450 views), Brazil (44 views), Unit-ed Kingdom (35 views), UnitUnit-ed States (thirty views) and Spain (24 views). In terms of gender, 57.3% of the views came from male viewers while 42.7% of the viewers were female.
Most of the views took place in the first three weeks of the launch of the project, which corre-sponded with the press coverage. The days with most views were June 18th (179 views) and June 26th (174 views).
6. Conclusion
Social media has changed how consumers share experiences, increased consumer information channels, changed companies product development and communication and it has also allowed a direct engagement with the consumers (Solis, 2011, pp. 3-9). Social media offers a personalized connection on a global scale that is valuable, meaningful, and convenient, which explains the massive embrace by the general public.
Worth-of-mouth stopped being a recommenda-tion we only told our friends and neighbors. We now share recommendations with hundreds or thousands of people in an instant breaking down geographic barriers and time zones. These followers can then continue the cycle of sharing and recommendation (Blanchard, 2011, pp. 10-11).
TravelPlot Porto brand social networks (Face-book, Twitter and YouTube) reached and engaged hundreds of people across different countries, dis-seminating information about Porto as a destination, despite having no advertising budget. It proved vital for the projects’ marketing efforts. The high press coverage of the project, although not initially foreseen, was also fundamental for TravelPlot Porto exposure and reach.
During twelve weeks, on TravelPlot Porto’s Face-book, there were unique users from 25 countries, ninety Portuguese cities and sixty foreign cities. This
platform was the most successful platform with the Portuguese audience. There was a 5% ‘average post engagement rate’ throughout the project and an 11% ‘daily page engagement rate’, which according to Socialbakers is above the average of a Facebook page between zero and 10,000 fans that has an average engagement rate of 0.96% (Socialbak-ers, 2011). TravelPlot Porto Facebook page posts achieved a total of 143,790 impressions. The daily average was 765 daily impressions. As for the post reach, the average daily was 243 unique users.
TravelPlot Porto’s Twitter account highest reach was on June 26th, when 51,489 unique twitter users received tweets about TravelPlot Porto. The highest exposure of TravelPlot Porto’s twitter account oc-curred on June 26th, with 57,450 total impressions. The overall average ratio throughout TravelPlot Porto was average (0.5) but there were two periods when the average ratio was high (0.6-0.99), indicating a wide variety of different people were tweeting to a number of diverse followers, spreading the message far and wide during these periods. This overall aver-age ratio was bigger than the overall averaver-age ratio on Peter’s TravelPlot Porto Twitter account (0.27), which reveals a bigger depth of penetration of tweets about the brand than the story protagonist.
TravelPlot Porto Facebook and Twitter account were able to attract attention and create interest. TravelPlot Porto trailer on the YouTube channel was viewed by 38 countries, achieving a bigger reach than Peter’s YouTube channel, which was viewed by 23 countries.
There were several limitations in this trial includ-ing its limited duration, reduced resources and no initial fans following or even project brand aware-ness. The strategy behind TravelPlot Porto Facebook and Twitter could have been more carefully thought out and implemented. Despite the results achieved, the full effectiveness of these social media channels weren’t reached since the ability to interact and engage with the audience was partly neglected by the community manager and no paid advertising campaign was undertaken. Nevertheless the findings
of this case study were promising, with each social network reaching a surprisingly high number of users in different countries and cities. This demonstrates the great potential of social media as a tool for the promotion of tourism.
These findings however cannot be generalized since they are related to a single case study. There-fore these results need to be complemented to draw out similarities and differences. One direction for further research is to extend the sample and time period as well as considering a social media adver-tising campaign.
Acknowledgements
We would like to thank all partners of TravelPlot Porto: University of Porto; Engineering Faculty of the University of Porto; INESC TEC/ INESC Porto; Founda-tion for Science and Technology; UT AustinIPortugal Program – International Collaboratory for Emerging Technologies (CoLab); Turismo de Porto e Norte de Portugal; Oportonity City; Câmara Municipal do Porto – Pelouro do Conhecimento e Coesão Social; Douro Valley; Cálem; DouroAzul; Vinhas d’Alho; Porto com Arte; Yellow Pictures; Light Films; Rádio Televisão Portuguesa; Escola Superior Artística do Porto; Webcomum; NextPower Norte and Project “A place for Joãozinho”.
References
Ayeh, J. K., Leung, D., Au, N., & Law, R. (2012). Perceptions and strategies of hospitality and tourism practitioners on social media: An exploratory study. In M. Fuchs, F. Ricci & L. Cantoni (Eds.), Information and communication technologies in tourism 2012 (pp. 1-12). Wien: Springer-Verlag.
Belleghem, S., Thijs, D., & Ruyck, T. (2012). Social media around the world 2012. Accessed on 19 August 2013, available at http:// www.insites-consulting.com/2012/09/25/social-media-around-the-world-2012/
Blanchard, O. (2011). Social media ROI: Managing and measuring social media efforts in your organization. Indianapolis: Que Publishing.
Buhalis, D., & Jun, S.H. (2011). Contemporary tourism reviews: E-tourism. Accessed on 19 August 2013, available at http:// www.goodfellowpublishers.com/free_files/fileEtourism.pdf/ comScore (2011). Top 10 need-to-knows about social networking
and where it’s headed. Accessed on 19 August 2013, available at http://www.comscore.com/Insights/Presentations_and_ Whitepapers/2011/it_is_a_social_world_top_10_need-to-knows_about_social_networking/
Facebook (2011). Facebook page insights: Product guide for Facebook page owners. Accessed on 19 August 2013, available at https://www.facebook-studio.com/fbassets/ resource/37/PageInsightsProductGuide.pdf/
Facebook (2012a). Building brands for the connected world. Accessed on 19 August 2013, available at http://fbrep.com/ wp/building_brands.pdf/
Facebook (2012b). TravelPlot Porto Facebook page. Accessed on 19 September 2013, available at www.facebook.com/ travelplot/
Ferreira, S., Alves, A., & Quico, C. (2012). Location based transmedia storytelling: The TravelPlot Porto experience design. Revista Turismo & Desenvolvimento, 17/18(4), 95-99. Ferreira, S., Alves, A., & Quico, C. (2014). Location based transmedia storytelling in social media: Peter’s TravelPlot Porto case study. e-Review of Tourism Research (eRTR), 5(January). Available at http://ertr.tamu.edu/enter-2014-volume-4-research-notes/ Ge, J., Gretzel, U., & Clarke, R.J. (2013). Strategic use of social
media affordances for marketing: A case study of Chinese DMOs. In Z. Xiang & I. Tussyadiah (Eds.), Information and communication technologies in tourism 2014 (pp. 159-173). Cham: Springer International Publishing.
Hays, S., Page, S.J., & Buhalis, D. (2013). Social media as a destination marketing tool: Its use by national tourism organizations. Current Issues in Tourism, 16(3), 211-239. Inversini, A., & Sykes, E. (2013). An investigation into the use of
social media marketing and measuring its effectiveness in the events industry. In Z. Xiang & I. Tussyadiah (eds.), Information and communication technologies in tourism 2014 (pp. 131-144). Cham: Springer International Publishing.
JWT (2011). Rebooting travel. Accessed on 19 August 2013, available at http://02a6614.netsolhost.com/production/ RebootingTravel_JWTTrendReport_April2011.pdf/
Kovarik, B. (2011). Revolutions in communication: Media history from Gutenberg to the digital age. New York: The Continuum. Solis, B. (2011). Engage: The complete guide for brands and
businesses to build, cultivate, and measure success in the new web. New Jersey: John Wiley & Sons.
Minazzi, R., & Lagrosen, S. (2013). Investigating social media marketing in the hospitality industry: Facebook and European hotels. In Z. Xiang & I. Tussyadiah (Eds.), Information and communication technologies in tourism 2014 (pp. 145-157). Cham: Springer International Publishing.
Nielsen (2012). State of the media: The social media report 2012. Accessed on 19 August 2013, available at http://www. nielsen.com/us/en/reports/2012/state-of-the-media-the-social-media-report-2012.html/
Socialbakers (2011). What is a good engagement rate on a Facebook page?. Accessed on 19 August 2013, available at http://www.socialbakers.com/blog/114-what-is-a-good-engagement-rate-on-a-facebook-page/
Twitter (2012). TravelPlot Porto Twitter page. Accessed on 19 September 2013, available at www.twitter.com/travelplot/ TweetReach (2013). TweetReach. Accessed on 19 September 2013,
available at http://help.tweetreach.com/entries/139336-Understanding-the-TweetReach-snapshot-report/
TweetReach Blog (2011). TweetReach blog. Accessed on 19 September 2013, available at http://blog.tweetreach. com/2011/01/whats-your-reach-exposure-ratio//
YouTube (2012). TravelPlot Porto YouTube page. Accessed on 19 September 2013, available at www.youtube.com/travelplot/