i
MASTER IN FINANCE
MASTER FINAL WORK
Does the market structure matter for firms’
profitability?
Portuguese Manufacturing sectors
2004-2011
MARGARIDA DO RIO HOMEM E SOUSA
i
MASTER IN FINANCE
MASTER FINAL WORK
Does the market structure matter for firms’
profitability?
Portuguese Manufacturing sectors
2004-2011
MARGARIDA DO RIO HOMEM E SOUSA
Supervisor: Professora Dr. Elsa Maria Nobre da Silva Fontainha
i
Acronyms and Abbreviations
BdP – Banco de Portugal
CAE – Classificação Portuguesa das Actividades Económicas CR4 – Four firm concentration ratio
EU – European Union
Eurostat – European Statistics
ESS – Efficiency Structure – Scale efficiency ESX – Efficiency Structure – x-Efficiency version HHI – Herfindahl-Hirschman Index
INE – Instituto Nacional de Estatística MP – Market Power
MS – Market Share
NACE – Nomenclature of Economic Activities PORDATA – Base de dados Portugal Contemporâneo RMP – Relative Market Power
ROA – Return on Assets ROE – Return on equity
SCIE – Sistema de Contas Integradas das Empresas SCP – Structure Conduct Performance
SIC – Standard Industrial Classification
SNC – Sistema de Normalização Contabilística USA – United States of America
ii
Abstract
The present investigation aims to study the impact of market structure in the financial performance of Portuguese manufacturing sectors since 2004 till 2011. The sample build for this study includes 257 manufacturing sectors. Probit models are adopted and the dependent phenomena is financial performance (measure alternatively by profitability and Return on assets). Market structure (measured by HHI, Market Share and CR4) and financial performance association is the core of the analysis.
The main conclusions are: positive association between financial performance measured by profitability and ROA and concentration measures measured by Herfindahl-Hirschman Index (HHI) and Market share; Factors as advertising and taxes do not appear to have an impact in financial performance of firms’; when market share and HHI are included in the same model the HHI gets inconclusive and non-significant.
Key words: Market structure; Profitability; Firm growth; Concentration; Manufacturing
JEL CODE - L11 Production, Pricing, and Market Structure • Size Distribution of Firms; L22 Firm Organization and Market Structure; D40 Market Structure, Pricing, and Design (General); L6 Industry Studies: Manufacturing; E32 Business Fluctuations Cycles
iii
Index
1 Introduction ... 1
2 Literature Review ... 4
2.1 Concepts and Theoretical Approaches ... 4
2.1.1 Firm Performance and Profit, Market Structure, Market Position, Market Power and Concentration... 7
2.1.2 Market position: static and dynamic approach ... 7
2.1.3 Firm size and growth ... 8
2.1.4 Advertising and innovation ... 9
2.2 Measures and Indicators of concentration of financial performance ... 9
2.3 Market structure and business cycle ... 12
2.4 Portuguese market structure dynamic (2004-2011) ... 13
3 Concentration and Market Position Dynamics in the Portuguese Manufacturing Sector (2004-2011): Empirical analysis ... 14
3.1 Data Source and Sample ... 14
3.1.1 Sample and Sample Characteristics ... 16
4 Methodology ... 16
5 Results and Discussion ... 21
6 References ... 34
7 Appendix……….39
Tables and Figures Index Table I – Variables and Indicators – Sources, Calculation and Description ... 17
Table II - Evolution of average concentration in manufacturing industry ... 21
Figure 1 - Distribution of the HH concentration index ... 22
Figure 2 – Difference between 2007 and 2011 in CR4 (four leading firms)... 23
Table III – Top Concentrated Sectors ranked by HHI and Total turnover (2004) ... 24
Table IV - Top Concentrated Sectors ranked by HHI and Total turnover (2011) ... 24
Table V - Top Concentrated Sectors ranked by MS and Total turnover (2004) ... 25
Table VI - Top Concentrated Sectors ranked by MS and Total turnover (2011) ... 25
iv
Table VII.2 – Marginal effects of 2004 (Dependent Variable: ROA) ... 27
Table VIII – Model Probit with Profitability as dependent variable ... 28
Table IX – Model Probit with Profitability as dependent variable... 29
Table IX.2 – Marginal effects of 2011(dependent variable: Profitability) ... 29
Table X – Model Probit with Profitability as dependent variable ... 30
Table XI – Description of variables used in the models of tables VII, VIII, IX and X.. 31
Appendix Index Table A.I - Literature Review Summary ... 38
Table A.II – Herfindahl-Hirschman Index (HHI) (2004 and 2011) CAE Code, and Sectors description ... 43
Table A.III – Description of some SCIE’ variables ... 49
Table A.IV – Correlation Matrix for 2004 ... 50
Table A.V. – Correlation Matrix for 2007 ... 50
1
1 Introduction
The goal in this dissertation is to study the financial performance (e.g. profitability) of the Portuguese manufacturing sector and observing how it is affected by the market structure (e.g. perfect competition, monopoly, oligopoly), which relates to the number and size distribution of firms in a market. The period studied (2004-2011) includes different phases of the business cycle, contributing to the study of the impact of current crisis on the non-financial sectors. Since it is an embryonic investigation (has far as the author knows this study was never done in Portugal for this sector and period), the results here obtained try to contribute to shed some light on the association among: market structure, financial performance and business cycle.
In the literature related to market structure and firm performance it is possible to find four empirical studies: Structure-Conduct-Performance (SCP), Relative Market Power (RMP), Efficient-Structure Hypothesis (ESS) and X-efficiency version (ESX), although the SCP and RMP exceed. The SCP theory is based on concentrated markets taking into account that prices in those markets lead to discouraging consumption (Berger, 1995; Bain 1956). The RMP focuses on companies’ profitability when companies have large market share imposed in the market due to power engaged in business and pricing (Berger, 1995). Normally, the market power is accomplished by factors that companies use such as the level of advertising, the size of the firm and the high firm growth.
ESX and ESS are both based in explaining that lower costs lead to higher profits. The difference is that ESX focuses on how management and the consequences of a good or bad administration combined with production technology can lead to a better financial performance of firms. On other hand, ESS supposes that management is
2
similar among firms, although the technology used to product might be more developed in some firms than others.
The reasons for the associations between high performance and market concentration is sustained in several factors: the use of advertising in order to reach consumers (Levy, 1985; Shepherd, 1972; Sutton, 2006; Bothwell et. al, 1984); the strategical location of the companies, for example near the centre of cities where the access is easier (Shepherd, 1972); and the size of firms used to impose their market power (Sutton, 2006; Bothwell et. al, 1984; Cabral & Mata, 2013; Evans 1987).
The choice for Portuguese manufacturing industry as object of study is justified because it is a representative sector in the Portuguese industry corresponding to 14% in the Portuguese gross domestic product (Pordata) and many industries depend on it. To test our research hypothesis, the database information and variables were extracted from the micro database of firm-level accounting data Sistema de Contas Integradas das
Empresas (SCIE) and from Instituto Nacional de Estatística (INE, 2014).
The selection of the period 2004-2011 is explained by the macroeconomic changes that occurred during this period and the assumption that they were reflected in the firms and sectors. In Portugal, the unemployment rate in 2004 was 6.6, in 2008 reached 7.6 and in 2011 stroked 12.7 these numbers are references to realize the impact of financial crisis in the Portuguese industry. These rates are contextualized in a period with a variation of Gross Domestic Product between 2004 till 2008 of 15% and from 2008 till 2011 of -2%. (Pordata, 2015). Since 2004 till 2008 the gross domestic product was growing at an average rate of 1.38% of, since 2008 and till 2011 the gross domestic product presents an average growth rate of -0.97% (Pordata).
3
In order to test and modelling the association between market structure and profitability in Portuguese manufacturing firms/sectors, the most relevant variables associated to the market structure model are: Concentration, Market Share and the logarithm of the turnover or number of employees (both scale variables). Concentration was computed by Herfindahl-Hirschman Index known as HH Index or HHI and the Market Share (MS) as a percentage (share) of the volume of turnover in each firm in the total of the sector where the firm belongs. The indicator C4 of concentration is also computed and the Lerner index is taken into account but it is not calculated due to lack of data. Financial performance will be based on two indicators: profitability and return on assets (ROA).
This dissertation use sector-level data (N=257 in each of the 8 years) for the estimation of Probit models where the dependent variable is having or not positive financial performance. All of the manufacturing industry in Portugal is covered by the 257 sectors considered. It was necessary to aggregate by sector the information made available originally at firm-level in SCIE. Although before aggregating the database, indicators and variables are computed at firm level. The data for every year was collected from SCIE, and was originally available in separate files by year. Concentration, market share and profitability were calculated for each sector as well as the information such as firm size, advertising, productivity, among others.
This dissertation is divided in four sections: the first one describe the theoretical background of the research and the measures and indicators for the performance and market structure analysis. Section 2 describes the data source and sample construction as well as the methodologies of analysis adopted. Section 3 shows and discusses the
4
empirical results and in Section 4 the conclusions and future lines of research are summarized.
2 Literature Review
2.1 Concepts and Theoretical Approaches
Several studies which relate concentration, market structure and firm performance are summarized in the Literature Summary Review (Table A.I of the appendix) organized by countries, sectors and databases, research question, method(s) used and main findings.
Markets are considered to be concentrated when they are dominated by few numbers of large firms (Sutton, 2008). Several studies have been made concerning the market structure, its causes and impacts and about firms’ performance determined by market share has received increasing attention in the industrial sector since 1970 (Kurtz & Rhoades, 1992). The impact of concentration on profitability is one of the research questions present in the literature, although the majority of the studies focus on banks or financial sectors instead of non-financial firms as is the case of this present research. Most of those studies conclude for a positive association between profitability and market structure (e.g. Mirzaei, et al. 2013; Berger, 1995; Bothwell et. al 1984). However, some studies conclude that the relation does not exist (Smirlock, 1985 and Thomadakis, 1977). The banking sector and banks are different from manufacturing sector and firms, not just on its market structure (banking sector has in general a high concentration level), but also on its culture, organization, corporate governance and
5
regulation. Consequently, the theoretical and empirical literature about concentration in banks is not completely suitable to the study of manufacturing sector.
This section focus on the key elements that compose the market structure always considering the theories behind it and the studies made during last 50 years since 1965. Market share, market structure and concentration are strongly associated phenomena. Market structure through this dissertation is taken as a synonym of market position.
Four empirical studies support the positive relation between concentration or market structure and firm performance (e.g. profitability):
(i) The Structure-Conduct Performance hypothesis (SCP) related to concentration (Berger, 1995 & Bain, 1956)
(ii) The Relative Market-Power hypothesis (RMP) related to market share (Berger, 1995)
(iii) The Efficient-Structure hypothesis (ESX) – X-efficiency version (Leibenstein, 1975)
(iv) The Efficient-Structure hypothesis (ESS) – scale efficiency version (Leibenstein, 1975)
The SCP explains the higher profitability in concentrated sectors by showing that in concentrated markets prices are higher due to the imperfection in the market. The RMP is different from SCP because it states that only the firms that have large market shares and a range of high diversified products are able to set competitive prices and consequently earn higher profits compared with those earned by the other firms. Usually, the explanation for that higher level of profits is that those firms use advertising, location and size to impose their power. That conclusion was empirically
6
tested by testing market share, concentration and profitability “(…) it is only the inclusion of market share that removes the positive coefficient on concentration in the profitability equations…” (Berger, 1995, p.429). Meaning that, when both variables are considered the correlation between financial performance and concentration does not exist although if just one of those variables is considered the probability of having a relation is much higher.
The ESX and the ESS, compared with the RMP and the SCP are simpler theories. According to them, the positive relationship between concentration and profitability arises from the lower costs which turn into higher profits. Therefore, firms gain large market shares and that leads to high concentration levels in the sector where they belong. The difference between both, the ESX and the ESS theories, is that the ESX assumes that some firms have better management and/or production technology while the ESS defends that there is a similar management among the firms, although some firms have more efficient production technology than others (Leibenstein, 1975).
Some authors attempt to explain why the market structure and profitability are related (Wernelfelt et al. 1989), some even tried to identify the properties of industries contributing to above-average profitability (Allen et al. 1983; Mirzaei, et. al. 2013; Pontuch, 2011) and others tried to understand the most relevant features in profitability of firms (Shepherd, 1972; Smirlock, 1985).
Summarizing, these four theories suggest that the relation between the market structure and the firm performance could be strong although really dependent on other factors different from market structure. Next points present briefly the associations found in the literature.
7
2.1.1 Firm Performance and Profit, Market Structure, Market Position,
Market Power and Concentration
Profit rates frequently present a relation to the market structure (Shepherd, 1972). When the relation is positive with concentration the reason for this could be the benefits from market power. Market power is normally the influence that a firm can have on its sector. The market power is the link between concentration and profitability meaning the ability of a company to manipulate the price set to its own benefit (Allen, 1983). Consequently, firms with more market power can set the prices, gain more profit and at the same time maintain their market share.
Concentration is linked to profitability because it increases the profit rates for big firms but not for small firms. In high concentrated markets, firms tend to be more profitable, unless there are exceptions and smaller firms are equally efficient and the profit from small and large firms is the same (Rocha, 2007).
2.1.2 Market position: static and dynamic approach
According to Shepherd (1972): “The premise in static analysis is that a firm´s
market position (defined by its market share, industry concentration and barriers, and
possibly other elements) affects its attainable degree of profitability” (p. 25), being the profitability measured by the average rate of return on invested capital.
Dynamic analysis reached the same conclusion when comes to financial performance of firms. The time element that differentiates these two approaches (static and dynamic) is very important, because in a short period of time for some firms (typically the ones with low turnover) the entrance of others is a threat, for bigger firms may be an opportunity to forego the short run monopoly prices and profits to avoid the
8
entrance (Grossack, 1965). As this dissertation includes different phases of the business cycles due to the years involved, dynamic analysis needs to be considered. Throughout this dissertation it will not only be investigated the relation between the market structure and profitability regarding industrial firms, but it will also link that aspect with the business cycle influence adopting a dynamic analysis instead of the usual static analysis. Besides the structural elements of market structure it is also need to consider the elements behind the business involvement. This way, other explanatory factors are taken into consideration to analyse market structure, for example, the firm size and growth and the advertising and innovation activities. The existing literature regarding these variables is very rich (see for example Evans, 1987 and Bass & Wittink, 1978).
2.1.3 Firm size and growth
The size of a firm is influenced by scale economies and/or other benefits associated, which influences positively the profits of a firm (Kurtz et. al. 1992). But firm size may also contribute negatively for companies’ growth and profit. This effect can be explained by the increase that the absolute size of a firm may have in the average costs, leading to a decrease in profit rates due to the constrained sacrificing profits by sales maximizing firms (Shepherd, 1972).
In general, firm size and advertisement are considered as entry barriers (Levy, 1985), although they can be studied separately. Most companies already operating in the market have advantage, either by the power that they hold through advertising either by the size and consequently new firms (usually smaller that are already installed) have more difficulties in entering into a market, selling and differencing their products, mainly if the market is not growing.
9
Firm growth for a given period can be measured as the percentage change in turnover during the period under analysis. It is connected to total profits and to the estimation of market shares and weights (Shepherd, 1972). It is likely that the firm growth raises the profitability of a company, although sometimes “excess of growth” might, on the contrary, reduce profitability or/and if firms use prices to achieved the expected growth, profit may be compromised too. Firm growth, size and age are linked phenomena and depend from each other. Firm growth and firm age have usually an inverse relationship, so as a firm gets older (higher age) it´s growth tends to decrease (keeping firm size constant) – a nonlinear relationship. The same happens for growth and size, because, when firm age is held constant, as companies became bigger, growth becomes smaller (Evans, 1987).
2.1.4 Advertising and innovation
Usually advertising has a positive relationship with concentration, Sutton (2006). There is an evidence that bigger firms have through commercials, posters, outdoors, Web, TV, among others, companies can persuade the consumers to buy their products, and, more important, at the price set from the firm. A high advertising-intensity is an entry barrier as it contributes to increase the profitability and the growth of firms and is also a source of product differentiability (Levy, 1985). Innovation, which can be measured by different forms, also impacts on concentration and consequently on firm performance (Shepherd, 1972; Scherer, 1965; Allen, 1983).
2.2 Measures and Indicators of concentration of financial performance
Market structure can be measured by different methods: market share, concentration, Lerner index and four-firm concentration ratio. Financial performance can be measured by several ratios: profitability, return on assets (ROA) and return on
10
equity (ROE). Table A.II of the appendix summarizes those and others variables included in the descriptive statistics and models.
Market share of a firm can be measured as the percentage of the turnover of a
firm in the total turnover of the industry/market (Shepherd, 1972; Rocha, 2010; Kurtz & Rhoades, 1992), this gives an idea of the size of the company when comparing to its competitors.
MS = 𝑇𝑢𝑟𝑛𝑜𝑣𝑒𝑟 𝑜𝑓 𝑓𝑖𝑟𝑚 𝑖
𝑇𝑜𝑡𝑎𝑙 𝑡𝑢𝑟𝑛𝑜𝑣𝑒𝑟 𝑜𝑓 𝑡ℎ𝑒 𝑖𝑛𝑑𝑢𝑡𝑟𝑦 𝑥
This index varies between 0 and 1, meaning the 1 that just exists one company operating in the sector (i.e. monopoly) and near 0 refers to a sector where there are a very large number of firms operating each of them with no significant power in the market, it means a perfect competition. The total turnover of the industry is usually measured at a high desegregated level of sector classification (in the current empirical study the 5-digit level of CAE code is adopted).
Several indexes, like the Herfindahl-Hirschman Index (HHI) and the Lerner Index are used to study concentration, although the first one is the most popular and easier to compute because of data availability.
Herfindahl-Hirschman Index is computed by:
𝐻𝐻𝐼𝑤 = ∑ 𝑋𝑖2 𝑖=𝑛
𝑖=1
Where, 𝑋𝑖2 is the market share of the 𝑖𝑡ℎ firm and n is the number of the firms in
11
Rocha, 2010). This index computed by sector varies between 0 and 1. If the value is near 0 it means a very large number of companies operates in that sector, if the value is 1 it means that there is a situation of monopoly. It increases both if the size of the firm increases and if the number of small firms gets smaller and it has the advantages of being sensitive and taking into account the size of the firms and it also includes the the number of firms operating. However some limits are indicated to this index such as being a static measure of size (Grossack, 1965).
Four firm concentration ratio (CR4):
CR4 = ∑4 𝑀𝑆
𝑖=1
This measure is used very often (e.g. Hradzil & Zhang, 2012; Berger, 1995; Ali & Yeung, 2014) and is the sum of the market share of the four leading firms in the market. It varies between 0% and 100%, meaning the 0% that no firms are operating in the market and 100% means that the one to four leading firms have the entire market share of the sector. It provides an overview about how the market is distributed based on the turnover of the top firms. Using the same logic of construction, the CR5 is also computed for example EU banking sector (Structural Indicators for the EU Banking Sector online – European Central Bank, 2015)
The Lerner Index is computed by firm: (𝑃 − 𝑀𝐶)
𝑃
Where P is the firm price and MC it´s marginal cost at the profit maximizing rate of output (Elzinga & Mills, 2011). As the difference between price and marginal cost gets bigger more monopoly power the firm has. Given the data available for the
12
current research (the SCIE microdata) it is not possible to compute this Lerner index, as there is no information for market prices. This index is also complex to compute for multi-product or multiservice firms.
Profitability of a company can be measure by:
Profitability = 𝑁𝑒𝑡 𝑖𝑛𝑐𝑜𝑚𝑒 𝑎𝑓𝑡𝑒𝑟 𝑡𝑎𝑥𝐶𝑜𝑚𝑝𝑎𝑛𝑦´𝑠 𝑇𝑢𝑟𝑛𝑜𝑣𝑒𝑟∗ 100
This ratio exhibits the percentage of return in terms of turnover, meaning throughout one year the value created by the firm (Shepherd, 1972).
ROA is the ratio that measures how profitable a firm is relative to its assets.
ROA = 𝑁𝑒𝑡 𝑖𝑛𝑐𝑜𝑚𝑒 𝑎𝑓𝑡𝑒𝑟 𝑡𝑎𝑥𝑇𝑜𝑡𝑎𝑙 𝑎𝑠𝑠𝑒𝑡𝑠
As mentioned before some authors instead of using profitability as the dependent variable of financial performance tests the hypothesis of relationship between profit rates and market structure with ROA. (e.g. Berger, 1995) The return on equity (ROE) is also used to evaluate financial performance.
2.3 Market structure and business cycle
As it is going to be analysed in the period between 2004 and 2011 a very important event happened – the subprime crisis with the consequent Great Recession in US and the impact in all developed economies namely in the EU economies. As Taylor (2009) argued: “The classic explanation of financial crises, going back hundreds of years, is that they are caused by excesses—frequently monetary excesses—which lead to a boom and an inevitable bust.” (p.1). Portugal was affected by the financial crisis as well as by a sovereignty debt crisis. For all Portuguese companies it was a period of
13
several changes and challenges, and so it is important to explain them and the consequences that this might had for firms (their market position, performance and growth). The present research, studying the association market structure-firm performance, includes into the analysis the impact of recent crisis on the Portuguese manufacturing firms, as it will be detailed later on (see section 2.1.1.). Because this sector is very relevant for production and employment in Portugal, it is a good sample of what happened through crisis and can give an overview how the Portuguese industry reacted to adverse shocks.
The whole process of awareness of the crisis that began, the adjustments needed to combat it and the failure thereof, emphasized the scale and the impact that this period had and still has in terms of countries, their economies and the population that composes them. This leads directly to the main issue related to impact of market structure on firms profitability and how financial crisis affected management decisions and economic growth.
2.4 Portuguese market structure dynamic (2004-2011)
In Portugal, “The main macroeconomic aggregates reveal a decrease in economic activity between 2008 and 2012, a tendency followed by the business sector indicators” (…) “The contraction in economic activity spread to near all the non-financial enterprise sectors.” (INE, 2012, p. 7). This point leads directly to the research question of this investigation, creating an expectation on different levels of economic activity before and after 2008.
More than one decade ago, Cabral and Mata (2003), in a reference work of concentration studies and based on Quadros de Pessoal (an administrative linked employer-employee database) concluded that in the Portuguese manufacturing firms the
14
firm size distribution is not independent of the size of the firm and the distribution is quite skewed to the right which is explained by financial constraints. By financial constraints they mean financial restrictions in the company, normally more severe in the younger firms. Bank loans are normally more difficult to grant to younger firms since confidence in them is not so great. As they are recent on the market, the results can still be very volatile, not ensuring compliance with finance benefits which differs from big firms that are already solid in market. Thus, the financial performance of younger firms tend to be lower, as the market may have a group of companies that owns most of the market share being difficult for smaller to stay in it. The study is based on a database (the SCIE) that has weak or none information about the age of the firm and the financial restrictions faced by firms. Consequently, it is not possible to study the hypotheses of Cabral and Mata (2003).
3 Concentration and Market Position Dynamics in the Portuguese
Manufacturing Sector (2004-2011): Empirical analysis
3.1 Data Source and Sample
The database used in this empirical research is the SCIE from 2004 till 2011. The SCIE is an accounting firm-level micro database that covers enterprises of all sizes (micro, small, medium and large) and legal form (Sociedades and Empresas em Nome
Individual). The information available is anonymized (there is no identification of the
firms name) and gathers also annual data from individual companies and Statistical Portugal Registry´s (INE, 2014).
15
This database has one big advantage over other databases: while others databases are restricted to some companies and some information about them (for example Amadeus database does not include all the firms namely the microfirms), the SCIE includes firms of all sizes and detailed accounting information in particular since 2010 and for societies. To have a real knowledge of the market position of each firm in a specific market or the market structure in one sector, information from all the firms operating in that market must exist.
The accounting nature of the data makes the Portuguese SCIE similar to Worldscope1 and the Compustat2. The Worldscope database with accounting harmonized information about companies worldwide (Worldscope Database, 2007) and the Compustat, database, created in 1962 an now associated to S&P, which is used very often for the study of market structure in United States (Compustat Database, 2003).
One disadvantage is that concerning the amount of data needed to elaborate the annual report it takes time to be set to published by Statistics Portugal, so in 2015 was published the company’s information of 2013 (INE, 2015). Other disadvantage of SCIE database is the data used does not have any information about mergers and acquisitions that happened in the firms. For the firms not created during the 8 years under analysis there is no information about the year of creation. However, it includes information about the beginning and the end of firm’s activity (for birth for 2004-2011 and for death 2004-2009).
1
Additional information about COMPUSTAT (S&P) is online: http://extranet.datastream.com/Data/Worldscope/index.htm 2 Additional information about COMPUSTAT (S&P) is online:
16
3.1.1 Sample and Sample Characteristics
This dissertation contemplates all subsectors (five digit level of CAE code) of the manufacturing industry from 2004 till 2011. It covers 257 industrial sectors, since CAE code 10110 (Cattle Slaughter) till CAE code 33200 (Installation of Machines and Industrial Equipment) (2-digit CAE code from 10 to 33). The list of all 257 sectors is in the second column of Table A.II in Appendix, where the sectors are ranked by HHI for 2011. The total numbers of firms in the file for 2004 is 87,901 and in 2011 are 72,049. For 2011 there are a total of 279 variables, for the period 2004-2009 the number of total variables available from SCIE is much small – between 79 variables for 2004 and 84 for 2009. Table A.III in Appendix presents some of the SCIE’s original variables used to compute the ratios, indexes, indicators and variables included in the models and described in Table I.
4 Methodology
After the sample selection, the variables and ratios for each firm were calculated. The unit of observation is the firm. Some variables were already explained and discussed in the Section 1.2 – Measures and indicators. Table I includes dependent and independent variables to be used in the modelling process the literature references, the methods of computation and the description.
17
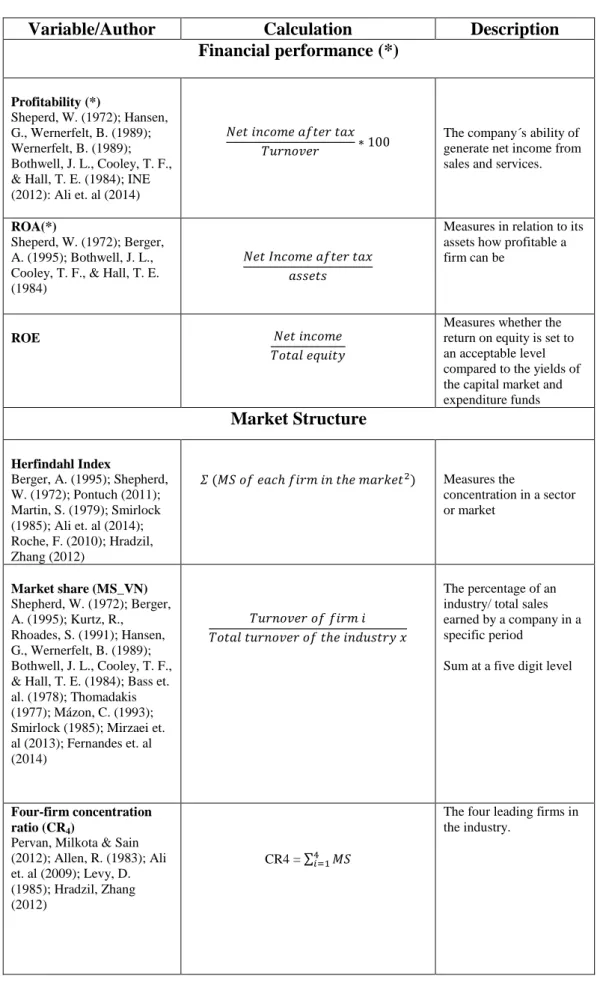
Table I – Variables and Indicators – Sources, Calculation and Description
Variable/Author Calculation Description
Financial performance (*) Profitability (*) Sheperd, W. (1972); Hansen, G., Wernerfelt, B. (1989); Wernerfelt, B. (1989); Bothwell, J. L., Cooley, T. F., & Hall, T. E. (1984); INE (2012): Ali et. al (2014)
𝑁𝑒𝑡 𝑖𝑛𝑐𝑜𝑚𝑒 𝑎𝑓𝑡𝑒𝑟 𝑡𝑎𝑥 𝑇𝑢𝑟𝑛𝑜𝑣𝑒𝑟 ∗ 100
The company´s ability of generate net income from sales and services.
ROA(*)
Sheperd, W. (1972); Berger, A. (1995); Bothwell, J. L., Cooley, T. F., & Hall, T. E. (1984)
𝑁𝑒𝑡 𝐼𝑛𝑐𝑜𝑚𝑒 𝑎𝑓𝑡𝑒𝑟 𝑡𝑎𝑥 𝑎𝑠𝑠𝑒𝑡𝑠
Measures in relation to its assets how profitable a firm can be
ROE 𝑁𝑒𝑡 𝑖𝑛𝑐𝑜𝑚𝑒
𝑇𝑜𝑡𝑎𝑙 𝑒𝑞𝑢𝑖𝑡𝑦
Measures whether the return on equity is set to an acceptable level compared to the yields of the capital market and expenditure funds Market Structure Herfindahl Index Berger, A. (1995); Shepherd, W. (1972); Pontuch (2011); Martin, S. (1979); Smirlock (1985); Ali et. al (2014); Roche, F. (2010); Hradzil, Zhang (2012) 𝛴 (𝑀𝑆 𝑜𝑓 𝑒𝑎𝑐ℎ 𝑓𝑖𝑟𝑚 𝑖𝑛 𝑡ℎ𝑒 𝑚𝑎𝑟𝑘𝑒𝑡2) Measures the concentration in a sector or market Market share (MS_VN) Shepherd, W. (1972); Berger, A. (1995); Kurtz, R., Rhoades, S. (1991); Hansen, G., Wernerfelt, B. (1989); Bothwell, J. L., Cooley, T. F., & Hall, T. E. (1984); Bass et. al. (1978); Thomadakis (1977); Mázon, C. (1993); Smirlock (1985); Mirzaei et. al (2013); Fernandes et. al (2014)
𝑇𝑢𝑟𝑛𝑜𝑣𝑒𝑟 𝑜𝑓 𝑓𝑖𝑟𝑚 𝑖 𝑇𝑜𝑡𝑎𝑙 𝑡𝑢𝑟𝑛𝑜𝑣𝑒𝑟 𝑜𝑓 𝑡ℎ𝑒 𝑖𝑛𝑑𝑢𝑠𝑡𝑟𝑦 𝑥
The percentage of an industry/ total sales earned by a company in a specific period
Sum at a five digit level
Four-firm concentration ratio (CR4)
Pervan, Milkota & Sain (2012); Allen, R. (1983); Ali et. al (2009); Levy, D. (1985); Hradzil, Zhang (2012)
CR4 = ∑4𝑖=1𝑀𝑆
The four leading firms in the industry.
18
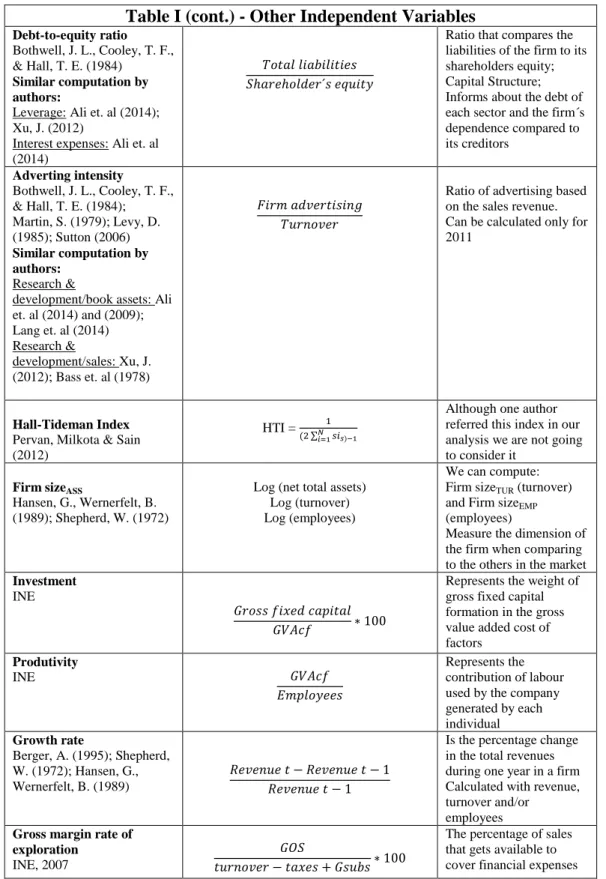
Table I (cont.) - Other Independent Variables
Debt-to-equity ratio
Bothwell, J. L., Cooley, T. F., & Hall, T. E. (1984)
Similar computation by authors:
Leverage: Ali et. al (2014); Xu, J. (2012)
Interest expenses: Ali et. al (2014)
𝑇𝑜𝑡𝑎𝑙 𝑙𝑖𝑎𝑏𝑖𝑙𝑖𝑡𝑖𝑒𝑠 𝑆ℎ𝑎𝑟𝑒ℎ𝑜𝑙𝑑𝑒𝑟´𝑠 𝑒𝑞𝑢𝑖𝑡𝑦
Ratio that compares the liabilities of the firm to its shareholders equity; Capital Structure; Informs about the debt of each sector and the firm´s dependence compared to its creditors Adverting intensity Bothwell, J. L., Cooley, T. F., & Hall, T. E. (1984); Martin, S. (1979); Levy, D. (1985); Sutton (2006) Similar computation by authors: Research &
development/book assets: Ali et. al (2014) and (2009); Lang et. al (2014) Research & development/sales: Xu, J. (2012); Bass et. al (1978) 𝐹𝑖𝑟𝑚 𝑎𝑑𝑣𝑒𝑟𝑡𝑖𝑠𝑖𝑛𝑔 𝑇𝑢𝑟𝑛𝑜𝑣𝑒𝑟
Ratio of advertising based on the sales revenue. Can be calculated only for 2011
Hall-Tideman Index
Pervan, Milkota & Sain (2012)
HTI = (2 ∑ 1𝑠𝑖
𝑠)−1 𝑁 𝑖=1
Although one author referred this index in our analysis we are not going to consider it
Firm sizeASS
Hansen, G., Wernerfelt, B. (1989); Shepherd, W. (1972)
Log (net total assets) Log (turnover) Log (employees)
We can compute: Firm sizeTUR (turnover)
and Firm sizeEMP
(employees)
Measure the dimension of the firm when comparing to the others in the market
Investment
INE
𝐺𝑟𝑜𝑠𝑠 𝑓𝑖𝑥𝑒𝑑 𝑐𝑎𝑝𝑖𝑡𝑎𝑙 𝐺𝑉𝐴𝑐𝑓 ∗ 100
Represents the weight of gross fixed capital formation in the gross value added cost of factors Produtivity INE 𝐺𝑉𝐴𝑐𝑓 𝐸𝑚𝑝𝑙𝑜𝑦𝑒𝑒𝑠 Represents the contribution of labour used by the company generated by each individual Growth rate Berger, A. (1995); Shepherd, W. (1972); Hansen, G., Wernerfelt, B. (1989) 𝑅𝑒𝑣𝑒𝑛𝑢𝑒 𝑡 − 𝑅𝑒𝑣𝑒𝑛𝑢𝑒 𝑡 − 1 𝑅𝑒𝑣𝑒𝑛𝑢𝑒 𝑡 − 1
Is the percentage change in the total revenues during one year in a firm Calculated with revenue, turnover and/or
employees
Gross margin rate of exploration
INE, 2007
𝐺𝑂𝑆
𝑡𝑢𝑟𝑛𝑜𝑣𝑒𝑟 − 𝑡𝑎𝑥𝑒𝑠 + 𝐺𝑠𝑢𝑏𝑠∗ 100
The percentage of sales that gets available to cover financial expenses
Source: Own Construction based on the referred authors, SCIE and INE (2015).
(*) For the Probit models both ROA and Profitability (means by sector) are computed. Using the means
from each of these two variables measuring sectoral financial performance we built a dummy variable: the negative or zero values = 0 (zero), and the other values (positive) are = 1(one).
19
In the first phase of the analysis the unit of observation is the ‘firm’ (the number of firms in each file per year varies from 72,000 till 87,900), however in order to test, analyse and take conclusions regarding the sectors (e.g. market structure and financial performance) it was necessary to aggregate all the firms belonging to the same sector. The variables and indicators of interest were aggregated by sector considering different functions (mean, standard deviation and sum). In the new file created after aggregation, the unit of observation is the sector (each year has 257 observations for each variable) includes all years, and is crucial to compute the measures of concentration (HH index, MS or CR4 presented in Section 1.2) which are used when constructing our explanatory models. For each year in the process of aggregation three measures are created: the sum (e.g. of the total turnover by sector, essential to compute the HH index of the sector); the mean (e.g. the mean of worker per firm, a measure of the average size of the firm in the sector); and the standard deviation (e.g. the dispersion of profitability among the firms belonging to each sector). So, we get for each year three ways to observe each variable (list of variables studied by sector definitions and main statistics are in Table I). For example, for turnover we get: the turnover_mean; turnover_sd and turnover_sum. The file with 257 sectors has 257 observations for each of the eight years under analysis.
To summarize, we have originally from SCIE one database and file per year and for all non-financial firms and sectors. Than we select only the firms belonging to the manufacturing sector (around 81,000 observations per year). Finally we build a new file by sector (each year with 257 observations) using three aggregated functions (sum, mean and standard deviation). After this, we combine all eight years information in one single file.
20
To test the impact of market structure on the performance of the firms or sectors two type of data files were used: files where the unit of observation is the firm (few results are shown in this dissertation because the results were of weak statistical quality and there is no space to present them) and files where the unit of observation is the
manufacturing sector (257 observations per years correspondent to 257 subsectors of
manufacturing sector). Following the literature, the core of the results and conclusions here presented are associated to the sectors.
Before constructing and testing the models it is fundamental to investigate the correlations between the variables and ratios, because for example if the profitability and the return on assets (both variables describing financial performance) are correlated it is not suitable in an econometric perspective to use both in the same model, as it would compromised the quality of the results. As we did not have sufficient space it was only possible to include some of the correlations matrices (Tables A.IV, A.V and A.VI in Appendix).
The two key phenomena under analysis are: market structure and financial performance. The market structure can be measured by different ways as explained in Section 1.2 and Table I. The financial performance can be evaluated by different measures and ratios as illustrated in Table I. The models tested here to investigate the relation between financial performance and market position are of two types: linear model (estimated by Ordinary Least Square method) and Probit model.
The dependent variable for linear models is the value of the performance indicator (a continuum variable) and the dependent variable for the Probit models is a binary variable built from the continuum values of the financial performance of the firm
21
(Profitability or ROA). There is literature using these two approaches (see Table A.I). For example, the linear regression model is used by Shepherd (1972) Berger (1995); Tabacco (2009) and the Probit models are adopted by (Kurtz & Rhoades (1992)).
For the Probit models both ROA and Profitability (see Table I) means by sector are computed and using the means from each of these two variables we built a dummy variable: the negative or zero values are equal to ‘zero’, and the other values (positive) are equal to ‘one’. As will be demonstrated later on we tried different independent variables together with market position variables to explain the financial performance of firms. Different variables were tested has predictors for financial performance in each sector, and their definitions are in Table I.
5 Results and Discussion
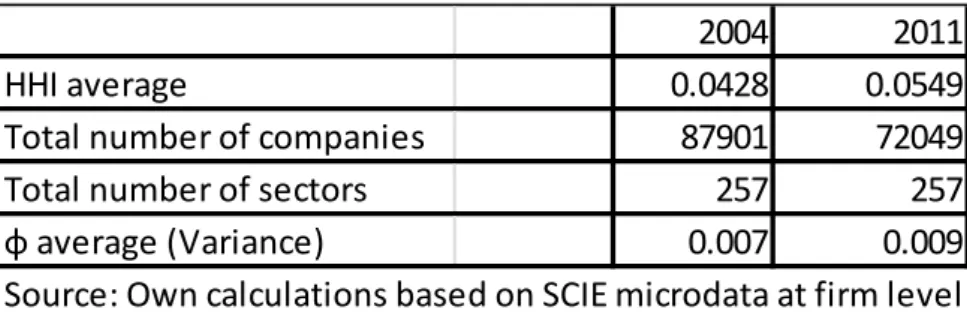
The first thing that we should shed light on is whereas the period in analyse show an increase in concentration through the manufacturing industry. The variables considered were the HH index based on turnover for the year 2004 and 2011. This way we reached 0.0428 concentration level for 2004 and 0.0549 for 2011 (Table II), based just on this calculations we observed an increase in the concentration of manufacturing firms.
Table II - Evolution of average concentration in manufacturing industry
Portugal, 2004 and 2011
2004 2011
HHI average 0.0428 0.0549
Total number of companies 87901 72049
Total number of sectors 257 257
ɸ average (Variance) 0.007 0.009
22
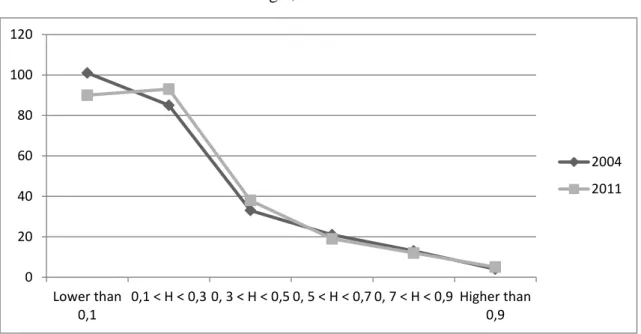
Figure 1 - Distribution of the HH concentration index
Portugal, 2004 and 2011
Vertical axis: Number of sectors between the intervals of concentration Horizontal axis: Interval of HH concentration index
Source: Own calculations based on SCIE microdata
Figure 1 shows the distribution of average concentration in Portuguese manufacturing industry for 2004 and 2011. The increase of the medium HHI from 2004 to 2011 corresponds to an increase in concentration which is also confirmed by the increasing values of HH index from 2004 to 2011 in most of the 257 sectors (Table A.II, two last columns). These descriptive data suggest that the downturn of the business cycle that occurred between 2008 till 2011 affected the market structure in general but with signs and intensities different in each of the 257 sectors (Table A.II).
Figure 1 seems to shows that few sectors have high levels of concentration, because in 257, just 17 in 257 have HH index higher than 0.7 in 2004 and in 2011. The limits considered were based in Bank of Portugal (Análise do Sector de construção, Banco de
Portugal, 2014) 0 20 40 60 80 100 120 Lower than 0,1 0,1 < H < 0,3 0, 3 < H < 0,5 0, 5 < H < 0,7 0, 7 < H < 0,9 Higher than 0,9 2004 2011
23
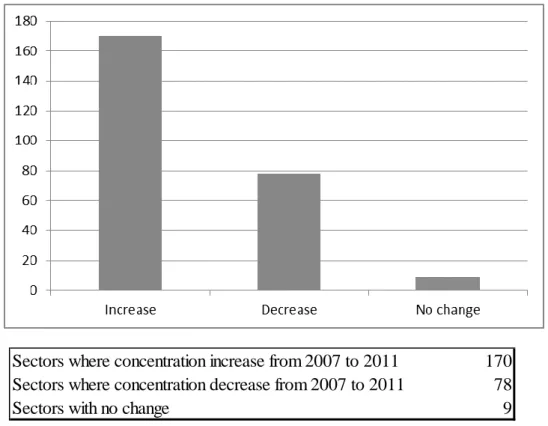
Using a different measure of market position, the CR4, the results for the years 2007 (before the crisis shock) and 2011 are represented in Figure 2. The figure represents the change of the four leading firms for each sector between those 2 years and shows that concentration increases in 170 sectors while in 78 decreases.
Figure 2 – Difference between 2007 and 2011 in CR4 (four leading firms)
Examples of highly concentrated sectors in both years are: Manufacturing,
starch and related products and Tire Manufacturing and Chambers of Air. In 2004 the
Collection and initial processing of precious metals and the Repair and maintenance of
other transport equipment were highly concentrated, while in 2011 the Collection and
Primary Processing of Lead, Zinc and Tin, Manufacturing Optical Instruments and
Equipment and Manufacture of Macaroni, Couscous and others enter to the list of most
concentrated sectors – See Tables III to VI.
Sectors where concentration increase from 2007 to 2011 170 Sectors where concentration decrease from 2007 to 2011 78 Sectors with no change 9
24
A subsample of the sectors with a HHI equal or higher than 0.82 (limit for 2004 and 2011, and corresponding to a representative sample of the 257 sectors) is selected and the top 7 or 10 of more concentrated sectors are shown. These results contrast to those in Tables V and VI that also illustrate the relevance of the size of the sector (evaluated in this analysis by the sum of the turnover of all firms operating in that sector) to the sector position of the firm. In both tables (V and VI) is observed the top concentrated sectors were obviously the percentage of market share is 100%, in most cases these sectors have less firms which hold the entire market share. Baking and
Sugar Industry since 2004 that stay in the top concentrated sectors as any severe change
occurred in those markets.
Table III – Top Concentrated Sectors ranked by HHI and Total turnover (2004)
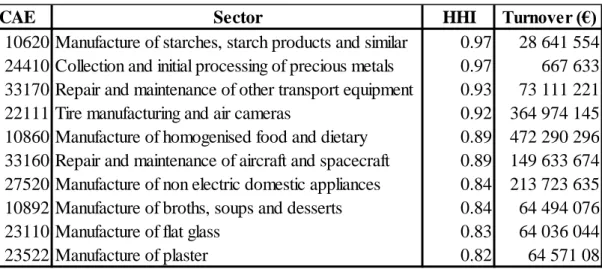
Table IV - Top Concentrated Sectors ranked by HHI and Total turnover (2011)
CAE Sector HHI Turnover (€)
10620 Manufacture of starches, starch products and similar 0.97 28 641 554 24410 Collection and initial processing of precious metals 0.97 667 633 33170 Repair and maintenance of other transport equipment 0.93 73 111 221 22111 Tire manufacturing and air cameras 0.92 364 974 145 10860 Manufacture of homogenised food and dietary 0.89 472 290 296 33160 Repair and maintenance of aircraft and spacecraft 0.89 149 633 674 27520 Manufacture of non electric domestic appliances 0.84 213 723 635 10892 Manufacture of broths, soups and desserts 0.84 64 494 076 23110 Manufacture of flat glass 0.83 64 036 044 23522 Manufacture of plaster 0.82 64 571 08
CAE Sector HHI Turnover (€)
10620 Manufacture of starches and starch products 0.99 37 303 429 22111 Tire manufacturing and air cameras 0.97 755 885 446 10730 Manufacture of macaroni, couscous and similar 0.96 106 659 558 26701 Manufacture of instruments, optical equipment and non-ophthalmic0.95 38 593 231 24430 Collection and primary processing of lead, zinc and tin 0.92 31 827 682 23552 Manufacture of plaster 0.89 7 014 222 10821 Manufacture of cocoa and chocolate 0.82 23 457 516
25
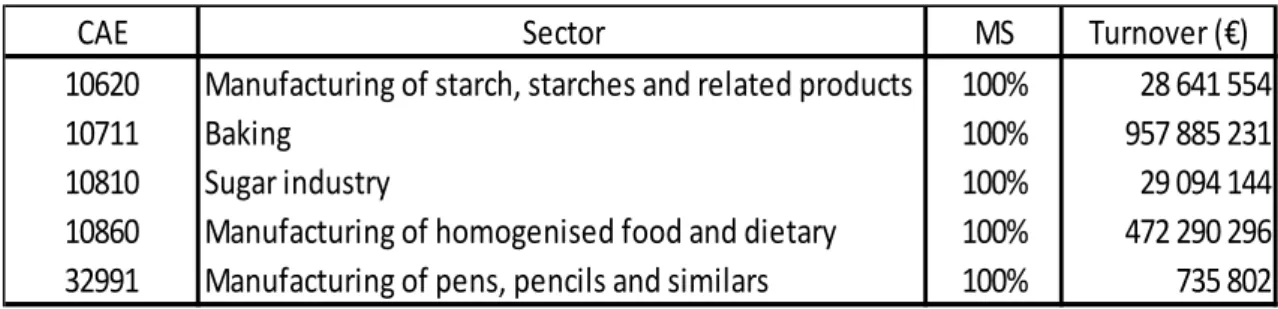
Table V - Top Concentrated Sectors ranked by MS and Total turnover (2004)
Table VI - Top Concentrated Sectors ranked by MS and Total turnover (2011)
Source: Own calculations based on SCIE microdata
Tables VII to X, summarize the main results obtained from the Probit models that were applied to test the relation between market position and financial performance. The meaning of the name of each variable tested is in Table XI. All are based on data by sector (N=257).
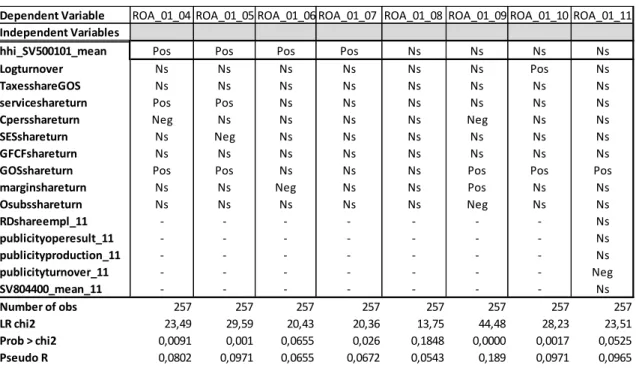
The first model tested was the Probit using ROA as the dependent variable. The first evidence that comes out when analysing Table VII is the positive sign in the HHI from 2004 till 2007 and the non-significance from 2008 till 2011. The explanation for that is the crises shock that affected Portugal from 2008. The positive sign for this variable explains that when the concentration of firm increases the financial performance of firms increases too. In this model the scale variable does not seem to have any impact in the explanation of financial performance as for all years because it appears as non-significant. The majority of variables included in this model (taxesshareGOS,
CAE Sector MS Turnover (€)
10620 Manufacturing of starch, starches and related products 100% 28 641 554
10711 Baking 100% 957 885 231
10810 Sugar industry 100% 29 094 144
10860 Manufacturing of homogenised food and dietary 100% 472 290 296 32991 Manufacturing of pens, pencils and similars 100% 735 802
CAE Sector MS Turnover €
10711 Baking 100% 1 085 590 274
10810 Sugar industry 100% 330 819 148
10821 Manufacture of cocoa and chocolate 100% 23 457 516 13101 Preparation and spinning of cotton type fibers 100% 149 946 840 32992 Iron manufacturing run, buttons and similars 100% 37 528 000
26
GFCFshareturn, Osubsshareturn, SESshareturn, Cpersshareturn) do not shown any
conclusion appearing as non-significant or with negative sign for just one or two years. This way it is not possible to analyse deeply this results. In 2004 the likelihood ratio chi-square of 23.49 and a Pseudo R of 0.0802 tell us that this model as a whole is statistically significant. Table VII.2 shows the marginal effects in the model estimated for year 2004. For example, for one unit increase in sector concentration (hhi_SV500101_mean) the probability of having a positive ROA (ROA_01_04) increases by 25%.
Table VII – Model Probit with ROA as the dependent variable
Pos – Positive signal; Neg – Negative signal; Ns – not significant; For the meaning of each variable see table XI
Source: Own computation based on SCIE data
Dependent Variable ROA_01_04 ROA_01_05 ROA_01_06 ROA_01_07 ROA_01_08 ROA_01_09 ROA_01_10 ROA_01_11
Independent Variables
hhi_SV500101_mean Pos Pos Pos Pos Ns Ns Ns Ns
Logturnover Ns Ns Ns Ns Ns Ns Pos Ns
TaxesshareGOS Ns Ns Ns Ns Ns Ns Ns Ns
serviceshareturn Pos Pos Ns Ns Ns Ns Ns Ns
Cpersshareturn Neg Ns Ns Ns Ns Neg Ns Ns
SESshareturn Ns Neg Ns Ns Ns Ns Ns Ns
GFCFshareturn Ns Ns Ns Ns Ns Ns Ns Ns
GOSshareturn Pos Pos Ns Ns Ns Pos Pos Pos
marginshareturn Ns Ns Neg Ns Ns Pos Ns Ns
Osubsshareturn Ns Ns Ns Ns Ns Neg Ns Ns RDshareempl_11 - - - Ns publicityoperesult_11 - - - Ns publicityproduction_11 - - - Ns publicityturnover_11 - - - Neg SV804400_mean_11 - - - Ns Number of obs 257 257 257 257 257 257 257 257 LR chi2 23,49 29,59 20,43 20,36 13,75 44,48 28,23 23,51 Prob > chi2 0,0091 0,001 0,0655 0,026 0,1848 0,0000 0,0017 0,0525 Pseudo R 0,0802 0,0971 0,0655 0,0672 0,0543 0,189 0,0971 0,0965
27
Table VII.2 – Marginal effects of 2004 (Dependent Variable: ROA)
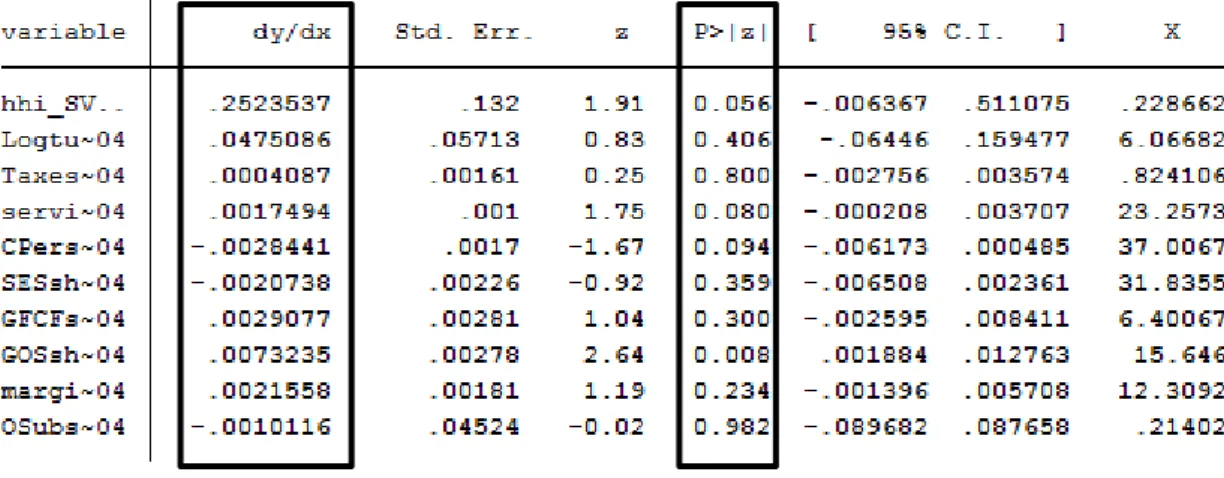
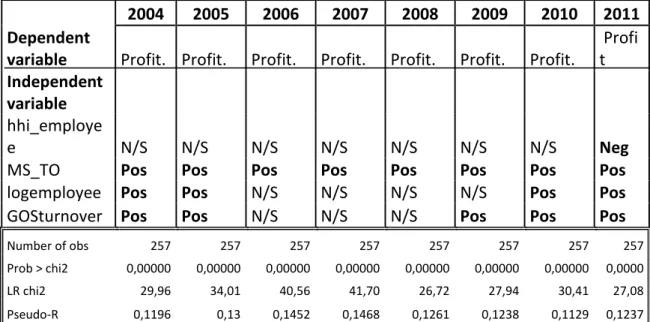
When considered Profitability as dependent variable in a Probit model and using the HHI measured by employees (Table VIII), for the years 2004, 2005, 2010 and 2011 the predictors, with positive impact, are: market share, the size by employees and the gross operating surplus by turnover. In this case, it is evident the positive relationship between the variable representing financial performance (Profitability) and the average market share of the firms in the sectors (MS_TO). So, the results suggest that financial performance and concentration are associated. HH index appears as a non-significant variable, reaching to the same results as Smirlock (1985): once market share and concentration are both included in a model as explanatory variables the concentration coefficient gets insignificant.
28
Table VIII – Model Probit with Profitability as dependent variable
Pos – Positive signal; Neg – Negative signal; N/s – not significant. For the meaning of each variable see table XI
Source: Own computation based on SCIE data
A different specification of the probit model with profitability as dependent variable was tested again – see table IX – and it proves once again that if HH index and market share are not included in the same model we get a positive relationship between financial performance and market share for all years except one. The exception, year of 2009 presents market share as non-significant. Probably this happens because of the greatest economic shock occurred between the year of 2008 and 2009 when there were negative impacts from the side of domestic and external demand thus reducing profitability conditions (costs cannot reduce immediately, specially fixed costs) and also the negative impacts from restrictions on the use of credit by domestic companies.
The rate of exploration margin (Mgexpl) shows that it is not a good variable to explain financial performance, being the exception year 2005 when the impact is positive. This model for year 2011 reveals some quality evaluated by the Pseudo R and
2004 2005 2006 2007 2008 2009 2010 2011
Dependent
variable Profit. Profit. Profit. Profit. Profit. Profit. Profit.
Profi t Independent variable hhi_employe e N/S N/S N/S N/S N/S N/S N/S Neg
MS_TO Pos Pos Pos Pos Pos Pos Pos Pos
logemployee Pos Pos N/S N/S N/S N/S Pos Pos
GOSturnover Pos Pos N/S N/S N/S Pos Pos Pos
Number of obs 257 257 257 257 257 257 257 257 Prob > chi2 0,00000 0,00000 0,00000 0,00000 0,00000 0,00000 0,00000 0,0000 LR chi2 29,96 34,01 40,56 41,70 26,72 27,94 30,41 27,08 Pseudo-R 0,1196 0,13 0,1452 0,1468 0,1261 0,1238 0,1129 0,1237
29
the Prob > chi2. However the model for year 2006 is the best. In 2005-2007 and 2010-2011 the profitability is positively predicted by the market share and the scale evaluated by the log of the value of assets. The table IX.2 includes the marginal effects for 2011, and shows that one unit of increase in the market share increases the probability of positive profits by 1.1%. Similarly, and a unit of increase of the value of assets (log) which evaluates the firm size (average) in each sector increases the probability of having positive profits by 6.2.%.
Table IX – Model Probit with Profitability as dependent variable
2004 2005 2006 2007 2008 2009 2010 2011
Dependent
variable Profit. Profit. Profit. Profit. Profit. Profit. Profit. Profit
Independent
variable
MS_VN Pos Pos Pos Pos Pos N/S Pos Pos
debttoequity N/S N/S N/S N/S N/S N/S N/S N/S
Mgexpl N/S Pos N/S N/S N/S N/S N/S N/S
Logassets N/S Pos Pos Pos N/S N/S Pos Pos
Number of obs 257 257 257 257 257 257 257 257 Prob > chi2 0,0000 0,0000 0,0000 0,0000 0,0000 0,0197 0,0000 0,0003 LR chi2 22,71 34,15 41,48 45 30,13 11,7 29,51 21,37 Pseudo-R 0,0907 0,1305 0,1485 0,1585 0,1423 0,0519 0,1095 0,0957
Pos – Positive signal; Neg – Negative signal; N/s – not significant - For the meaning of each variable see table IX
Source: Own computation based on SCIE data
30
Profitability is tested as dependent variable in a different Probit model. The independent variables are in this specification: HHI measured by turnover
(hhi_turnover), the size measured by turnover (logturnover), the gross operating surplus
measured by turnover (GOSturnover) and the market share (MS_TO).Table X present the results. Once more, the variable concentration measured by HHI is non statistical significant in most of the years contrary to the variable associated to the market share which has a positive association with the financial performance for all years. The scale variable (logarithm of turnover) shows that for almost every year (excluding 2007 and 2008) is a positive predictor of profitability.
Table X – Model Probit with Profitability as dependent variable
2004 2005 2006 2007 2008 2009 2010 2011
Dependent
variable Profit. Profit. Profit. Profit. Profit. Profit. Profit.
Profit .
Independen
t variables
hhi_turnove
r Neg N/S Pos N/S N/S Neg N/S N/S
logturnover Pos Pos Pos N/S N/S Pos Pos Pos
GOSturnover Pos Pos Neg N/S N/S Pos Pos Pos
MS_TO Pos Pos Pos Pos Pos Pos Pos Pos
Number of obs 257 257 257 257 257 257 257 257 Prob > chi2 0,0000 0,0000 0,0000 0,0000 0,0000 0,0000 0,0000 0,0000 LR chi2 31,35 37,01 42,99 42,87 26,52 32,04 31,98 26,82 Pseudo-R 0,1252 0,1415 0,1539 0,151 0,1252 0,142 0,1187 0,1225
Pos – Positive signal; Neg – Negative signal; N/s – not significant - For the meaning of each variable see table XI
31
Table XI – Description of variables used in the models of tables VII, VIII, IX and
X
*the _11 means that these variables were only calculated for the year 2011 **See table I
4. Conclusions and future research lines
The financial performance of companies is something unavoidable for them, being always on the main objectives of each company to achieve the best performance every year. The research question of this study was linked with the existence of a direct relationship between market structure and the financial performance of the companies in the manufacturing industry sector in Portugal. Several conclusions were drawn:
First, the financial performance (measured by profitability and ROA) has a positive relationship with concentration measures in most of the years studied (2004 to 2011). The probability of a positive profitability or a positive ROA (both financial performance
Variable name Meaning
hhi_SV500101_mean Mean of the turnover HHI inndex Logturnover Scale variable (logarithm turnover)
Taxes share GOS Taxes relativized by the gross operating surplus Servicesshareturn Services relativized by the turnover
Cpersshareturn Cost of personnel relativized by trunover
SESshareturn Supplies and external services relativized by turnover GFCFshareturn Gross fixed capital formation relativized by turnover GOSshareturn Gross operating surplus relativized by tunover marginshareturn Commercial margin relativized by turnover Osubsshareturn Operating subsidies relativized by turnover
Rdshareemplo_11* Research & development relativized by employees publicityoperesult_11 Publicity relativized by operating result
publicityproduction_11 Publicity relativized by production publicityturnover_11 Publicity relativized by turnover SV804400_mean_11 Spending on advertising HHI_employees HHI measured by employees MS_TO Market share measured by turnover logemployees Scale variable (logarithm employees)
debttoequity** Ratio that compares the liabilities of the firm with shareholders equity
Mgeexpl** Gross margin rate of exploration logassets Scale variable (logarithm assets) hhi_turnover HHI measured by turnover
32
measures) increases when concentration increases. There are differences across time, but when the market share is used (concentration measure) the association exists in most of the years. The results suggest that the answer to the question “Does the market
structure matter for firms’ profitability?” is positive.
Second, the scale variables representing the average size of the firms in each sector (evaluated by number of employers, turnover or value of assets) in some models shows a positive relationship with financial performance, but in many others the associated coefficients were statistically non-significant.
Third, factors as advertisement and taxes were tested as predictor of financial performance but the results were inconclusive.
Fourth, when included in the same model both concentration (measured by HH index) and market share, the concentration measure HH index gets, in general, inconclusive and non-significant;
Fifth, the quality of the results from probit models estimated for years 2008 and 2009 were in general very weak or with mixed and unexpected results. It is likely that this reflects structural shocks in manufacturing sectors as a consequence of the crisis.
Sixth, the market structure of the manufacturing sector in Portugal changed during the period 2004-2011. There was an increase of concentration independently from the indicators used to evaluate it: the HHI, the Market Share or the CR4.
The fact that we do not have information regarding mergers and acquisitions might have limited this research, because normally these actions lead to changes in concentration.
33
During this study several questions arise for future investigation such as:
- Be seen that this is an embryonic research and it was never done for this sector and period in Portugal several deepen studies may be done concerning this industry. For example if the changes occurred after 2008 correspond to structural changes in the association concentration-financial performance;
- It is interesting to apply the same research question for other sector in the Portuguese economy. For example to the banking sector;
- Further research studying how the market position of the firm, the age and the growth are linked would be very useful not just to see the connection between them but also to use them to understand better the results obtained in investigations like the present.
34
6 References
Ali, A., Klasa, S., & Yeung, E. (2014). Industry concentration and corporate disclosure policy. Journal of Accounting and Economics, 58(2), 240-264.
Ali, A., Klasa, S., & Yeung, E. (2009). The limitations of industry concentration measures constructed with Compustat data: Implications for finance research. Review of Financial Studies, 22(10), 3839-3871.
Allen, R. F. (1983). Efficiency, market power, and profitability in American manufacturing. Southern Economic Journal, 933-940.
Bain, J. S. (1951). Relation of profit rate to industry concentration: American manufacturing, 1936-1940. The Quarterly Journal of Economics, 293-324.
Banco de Portugal: Análise do sector da construção, Janeiro de 2014 www.bportugal.pt/pt-PT/.../Estudos%20da%20CB%2015_2014.
Bass, F. M., Cattin, P., & Wittink, D. R. (1978). Firm effects and industry effects in the analysis of market structure and profitability. Journal of Marketing Research, 3-10.
Beck, T., Demirgüç-Kunt, A., & Levine, R. (2006). Bank concentration, competition, and crises: First results. Journal of Banking & Finance, 30(5), 1581-1603. Berger, A. N. (1995). The profit-structure relationship in banking--tests of
market-power and efficient-structure hypotheses. Journal of Money, Credit and Banking, 404-431.
Bikker, J. A., & Haaf, K. (2002). Measures of competition and concentration in the banking industry: a review of the literature. Economic & Financial Modelling, 9(2), 53-98.
Bothwell, J. L., Cooley, T. F., & Hall, T. E. (1984). A New View of the Market Structure--Performance Debate. Journal of Industrial Economics, 397-417. Cabral, L. M., & Mata, J. (2003). On the evolution of the firm size distribution: Facts
and theory. American Economic Review, 1075-1090.
Cattó, V. (1980). Market share and profits. Business Economics, 39-44.
Caves, R. E., & Porter, M. E. (1978). Market structure, oligopoly, and stability of market shares. Journal of Industrial Economics, 289-313.
Chen, C. M., & Lin, Y. C. (2015). An analysis on the concentration–advertising relationship in the hospitality industry. Current Issues in Tourism, 18(3), 291-298.
35
Chortareas, G. E., Garza‐Garcia, J. G., & Girardone, C. (2011). Banking sector performance in Latin America: market power versus efficiency. Review of
Development Economics, 15(2), 307-325.
Curry, B., & George, K. D. (1983). Industrial concentration: a survey. Journal of
Industrial Economics, 203-255.
Dietrich, A., & Wanzenried, G. (2011). Determinants of bank profitability before and during the crisis: Evidence from Switzerland. Journal of International Financial
Markets, Institutions and Money, 21(3), 307-327.
Dunne, T., Klimek, S. D., Roberts, M. J., & Xu, D. Y. (2013). Entry, exit, and the determinants of market structure. The RAND Journal of Economics, 44(3), 462-487.
Efthyvoulou, G., & Yildirim, C. (2014). Market power in CEE banking sectors and the impact of the global financial crisis. Journal of Banking & Finance, 40, 11-27. Einav, L., & Levin, J. D. (2010). Empirical industrial organization: A progress
report (No. w15786). National Bureau of Economic Research.
EUROSTAT: http://ec.europa.eu/eurostat/web/structural-business-statistics/structural-business-statistics/sme
Evans, D. S. (1987). Tests of alternative theories of firm growth. The Journal of Political Economy, 657-674.
Fabling, R., & Sanderson, L. (2013). Exporting and firm performance: Market entry, investment and expansion. Journal of International Economics, 89(2), 422-431. Fedderke, J., & Naumann, D. (2011). An analysis of industry concentration in South
African manufacturing, 1972–2001. Applied Economics, 43(22), 2919-2939. Fedderke, J., & Szalontai, G. (2009). Industry concentration in South African
manufacturing industry: Trends and consequences, 1972–96. Economic
Modelling, 26(1), 241-250.
Fernandes, A. P., Ferreira, P., & Winters, L. A. (2014). Firm entry deregulation, competition and returns to education and skill. European Economic Review, 70, 210-230.
Grossack, I. M. (1965). Towards an integration of static and dynamic measures of industry concentration. Review of Economics and Statistics, 301-308.
Hansen, G. S., & Wernerfelt, B. (1989). Determinants of firm performance: The relative importance of economic and organizational factors. Strategic Management Journal, 10(5), 399-411.