A Work Project, presented as part of the requirements for the Award of a Masters Degree in Finance from NOVA – School of Business and Economics.
Trading the differences in expectations between the CDS and bond markets
João Pedro da Veiga Madeira nº 814
A Project carried out on the Finance course, under the supervision of:
Professor Afonso Eça
2
Trading the differences in expectations between the CDS and bond markets
ABSTRACT
This paper uses the framework developed by Vrugt (2010) to extract the recovery rate and term-structure of risk-neutral default probabilities implied in the cross-section of Portuguese sovereign bonds outstanding between March and August 2011. During this period the expectations on the recovery rate remain firmly anchored around 50 percent while the instantaneous default probability increases steadily from 6 to above 30 percent. These parameters are then used to calculate the fair-value of a 5-year and 10-year CDS contract. A credit-risk-neutral strategy is developed from the difference between the market price of a CDS of the same tenors and the fair-value calculated, yielding a sharpe ratio of 3.2
3 1. Introduction
The topic of sovereign defaults has been, for the past few years, increasingly under the spotlight of finance professionals and policymakers alike. At the origin of this concern was the sovereign debt crisis in Europe, which after starting out with Greece in 2010 quickly expanded to Ireland, Portugal, Cyprus and effectively almost all of peripheral Europe. More recently, the focus has moved to Argentina´s notorious debt trial, which resulted in its second sovereign default in thirteen years. This context makes this study particularly relevant as it focuses on understanding the market’s expectations on the probability of default and recovery rate for Portuguese sovereign debt during the most eventful part of 2011, from the beginning of March until the end of July, and uses these expectations to develop an investment strategy that aims to profit from possible arbitrage opportunities in the Credit Default Swaps market. This strategy can be applied in other situations, using the CDS contracts on the sovereign debt of countries which are perceived to be experiencing financial difficulties to achieve superior returns.
4
term-structure of the default risk instead of a static probability, which is particularly relevant when pricing Credit Default Swaps.
The remainder of this paper is organized as follows. Section 2 gives an overview of the literature that has focused on related topics and covers in particular detail the paper in which Vrugt presents the model that was used during the first part of this study. Section 3 describes the methodology followed and section 4 covers the data used in this study. Section 5 presents and discusses the results. Section 7 summarizes and concludes.
2. Literature Review
The first part of this study builds on a 2010 paper by Vrugt in which a model to estimate the implied term-structure of default probability and the recovery rate is presented. The paper improved existing credit risk models in two different ways: firstly, it extracts the implied recovery rate from the prices of the bonds outstanding, effectively creating a way of obtaining a credible and realistic value for the recovery rate of sovereign debt. This is particularly relevant as sovereign defaults in recent history have been scarce and geographically concentrated, thus making it particularly difficult to obtain a truthful and reliable recovery rate assumption for most countries, especially given that recovery rates in sovereign defaults are very country specific. On the other hand, the model also extracts the term-structure of the default probabilities, which is an important improvement from previous studies, where the default probability was assumed to be time-invariant.
5
outside this time-range. The rationale behind the model’s formulation is that the price of an asset (in this case a sovereign bond) is equal to the risk-neutral-probability-weighted cash-flows of that asset, discounted at the risk-free rate. Given that this asset in particular is a bond, there are only two different possible cash-flows at payment date: the bondholder receives either the promised cash-flow (coupon payment and/or principal) or, in case of default, a restructured bond, whose value is equal to the recovery rate, and which is worth less than the original. As such, the price of the bond can be seen as the sum of the default-probability-weighted cash flows and recovery rate, with the particularity that this default probability is not static and thus can vary between cash-flows. The implied recovery rate and term-structure of default probabilities can thus be estimated by minimizing the sum of squared pricing errors, which are defined as the difference between the market and fitted prices.
From applying this model to the Greek sovereign bond outstanding between April and May 2010, Vrugt finds that the estimated recovery rate is stable around 40 to 60 percent, while the default probabilities are extremely volatile, rising from 5% to 40% in a question of days, which is consistent with what I obtained when applying the model to the Portuguese sovereign bonds outstanding between March and July 2011.
6
7 3. Methodology
As previously mentioned, for the first part of this study, which consisted of extracting the recovery rate and default probabilities implied in the Portuguese sovereign bond market, the model developed by Vrugt was used. The formulation of the model is the following:
= [ × S + × × ] (1)
Where P is the bond price, df is the discount factor used, CF is the cash-flow expected for that period, RV is the recovery rate, S is the cumulative probability of non-default and π is the probability of defaulting in that period. As such, S can be represented as follows:
Sn = 1 − (2)
However, unlike previous models, the default probability is not static. Vrugt used the first part of the Nelson-Siegel formula to parameterize the probability of default, thus giving it enough flexibility to capture upward and downward-sloping term-structures of default probability:
= + × 1 − ! /# (3)
Where # is the number of years until the next cash-flow. By construction, the instantaneous default probability is + while the infinite maturity default probability is .
8
The second part of this study consisted of calculating the price of a CDS using the parameters estimated earlier. For the sake of coherence, the methodology chosen to do so was the Probability Model of CDS Pricing given that, similarly to Vrugt’s model, it is also a binomial model set in discrete time, which assumes that defaults can only occur in each node. Taking N as the number of periods, the model implicitly assumes that there are N + 1 possible outcomes, given that the underlying entity can default in each of the periods, or not default at all. As such, for each of the outcomes where default happens, for the seller of protection there is a negative cash-flow equal to 1- RV and positive cash-flows equal to the premium payments that had been made in previous periods. For each of these outcomes, the associated probability is the probability of defaulting in the current period n ( ) times the cumulative probability of survival until the period immediately before ( ), with S having the same formulation as in Vrugt’s model. For the last outcome, where no default happens, there is a positive cash-flow for the protection seller equal to all the premium payments that were paid during the duration of the contract. The probability associated with this outcome is the cumulative probability of survival until the last period, N, which is represented as . Discounting each cash-flow accordingly, one can represent the PV of a CDS contract for the protection seller as follows:
= $% × × [− 1 − RV × + × %
(
]) + × × % 4
9
Given that the present value of a CDS when contracted is zero, one can use the formula above to determine the CDS spread that corresponds to the recovery rate and the term-structure of default probability extracted from the Portuguese sovereign bond prices.
For the third part of the study a simple investment strategy was created to take advantage of the potential arbitrage opportunity that arose from differences in expectations between the derivatives and the bond market. It is a strategy that trades daily, with the underlying position lasting only that day. The rational is that the market price of the CDS should converge to the price that is calculated using the inputs extracted with Vrugt’s model. As such, if the market price of the CDS is above the fair-value the strategy sells protection and, if it is below, the strategy buys protection. Given that this is a daily strategy, the basis-points accrued from the CDS spread were disregarded. Instead, the points-up-front that must be transacted to buy/sell CDS were used to compute the returns of the position held in CDS.
To make this strategy credit-risk-neutral, investors must also take a simultaneous position in the sovereign bond of the same tenor. As such, if protection is sold (meaning that the investor is now exposed to credit-risk), then the respective bond is sold short and vice-versa if protection is bought. However, to guarantee that the overall position has no credit-risk, the nominal transacted in the two underlying positions is not necessarily the same. In fact, the nominal that should be transacted in CDS, as a percentage of the nominal that should be transacted in bonds is equal to the following:
+,-.
10
Where N is the nominal transacted, B is the market price of the bond, R is the recovery rate and C is the market value of the CDS. To understand this equivalence one can take as an example the case where the investor is long the bond and has bought protection. In that case, the value of the investor’s portfolio is equal to the nominal of the bond times its market price plus the nominal of the CDS times its market price:
= +/0 1× 2 + +,-.× (6)
In case of a default, the value of the portfolio now becomes the nominal of the bonds times the recovery value. On the other hand the investor is entitled to receive a default compensation payment, which is equal to 1 minus the recovery rate, times the nominal of the CDS. Finally, the market value of the CDS, C, drops to zero as the contract ends after it triggers. As such the new value of the portfolio is the following:
4= +/0 1× + +,-.× 1 − + +,-.× 0 (7)
To guarantee that the investor is fully protected against a default, meaning that the strategy is credit-risk-neutral, the value of the portfolio before default must be equal to its value after the default:
+/0 1× 2 + +,-.× = +/0 1× + +,-.× 1 − + +,-.× 0 (8)
11 4. Data
For the extraction of the implicit default probability and recovery rate using Vrugt’s model, all the sovereign bonds outstanding for the Portuguese Republic between the beginning of March and the beginning of August were considered. Perpetual bonds were excluded from the analysis thus leaving 14 bonds in the sample, which are presented in Table 1:
[Insert Table 1 around here]
For the risk-free interest rate that originates the discount factors used as an input in the model, the term-structure published daily by the ECB was used. This term-structure is calculated by applying the Svensson model to the yields of AAA-rated Eurozone government bonds.
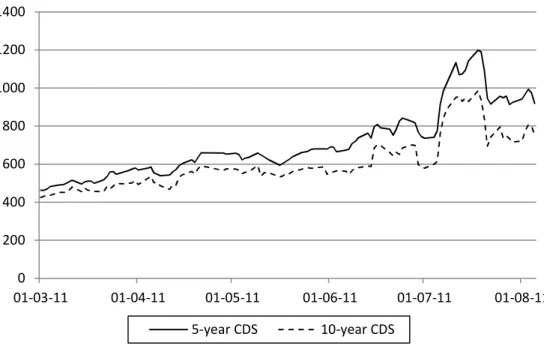
For the second part of the paper, the daily last prices of 5-year and 10-year credit-default-swaps offering protection against the Portuguese Republic were used. These quotes were extracted directly from Bloomberg. The evolution of the CDS spread for both tenors is presented in the figure below:
[Insert Figure 1 around here]
12 5. Results and Discussion
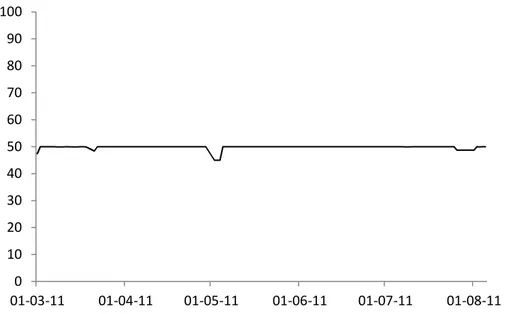
The implicit recovery rate, that was extracted using Vrugt’s model for the period between the 1st of March and the 5th of August 2011 is presented in Figure 2:
[Insert Figure 2 around here]
As one can easily observe, it remains roughly static at 50 percent throughout the entire period. This result is coherent with previous findings for both corporate and sovereign bonds, which all point towards a recovery rate of between 40 and 60 percent. Another relevant finding is that this recovery rate, which is implicit in the prices of the cross-section of Portuguese sovereign bonds, is significantly different from the street convention of 40% assumed by the CDS market. This difference clearly points towards the conclusion that the pricing assumptions used by the bond and the CDS market are not homogeneous, at least in what concerns the recovery rate of the bonds.
The instantaneous probability of default (α +β) which was yielded by the model for the period described above is presented in Figure 3:
[Insert Figure 3 around here]
13
Below is a timeline of the Portuguese Sovereign Crisis between the beginning of March and the beginning of August, with the respective reaction of the implicit instantaneous probability of default:
- March 23rd: Prime-minister José Sócrates resigns, which is immediately followed by a downgrade of the sovereign rating. The implicit probability of default quickly increases from 7.1 percent to 10.2 percent between the 22nd and the 24th
- April 6th: José Sócrates requests a bailout from the EU and the IMF. The probability of default, however, barely moves, suggesting that such action had been already priced-in by the bond market at that time
- May 16th: A bailout of €78 billion is approved. Although the probability of default does not experience a significant variation, it had gone from 16.5 to 12.1 percent between the 12th and the 16th, suggesting that the approval had already been gradually priced-in in the days immediately before
- July 5th: Moody’s downgrades the Portuguese sovereign rating to speculative-grade. The probability of default drastically reacts, going from 19.8 to 27.5 percent between the 5th and the 6th, clearly reflecting the sell-out prompted by this downgrade given certain entities’ investment guidelines (e.g. pension funds)
- July 21st: Greece selectively defaults on its debt. The probability of default goes from 31.5 to 22.1 percent between the 18th and the 22nd, suggesting that the market had gradually been expecting such action since the beginning of the week
14
infer the market’s expectations on a certain event to understand whether it was already priced-in or not. The first conclusion is particularly relevant given that one of the events that occurred during this period was the downgrade of the Portuguese rating to speculative-grade by Moody’s. These results show that it is the probability of default that fully absorbs this shock and that the expectation on the recovery rate of the Portuguese bonds does not change when its investment-status change, which could be an evidence against the widely used assumption that the recovery rate of speculative-grade entities is lower than that of investment-speculative-grade entities, at least in the sovereign universe.
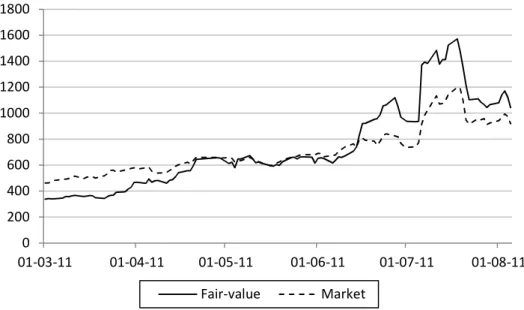
The results obtained from the pricing of a 5-year Credit-Default-Swap against Portuguese sovereign debt calculated with the inputs extracted from the bond prices using Vrugt’s model are presented below, contrasted with the market prices for the same CDS.
[Insert Figure 4 around here]
15
The 10-year CDS spreads for the period studied, calculated with the inputs extracted using Vrugt’s model are presented below, contrasted with the market prices for that same CDS:
[Insert Figure 5 around here]
The pattern is similar to the 5-year CDS, with both prices converging initially and then remaining extremely similar until mid-June 2011. However, from that point onwards the divergence is even more significant than in the 5-year tenor. This behavior is coherent with the conclusion that the longer the maturity of a CDS, the higher the impact of an increase in the default probability. Once again, one can easily observe that the derivatives market reacts faster to the European Sovereign Crisis events. This finding corroborates the work of Zhu (2004), who argues that the derivatives market tends to be ahead of the bond market in the price discovery process given its higher liquidity.
16
pricing decisions in the sovereign bonds of Europe’s periphery, which would then be reflected in the implicit probability of default. Finally, the fact that lower liquidity could translate into different paces in the pricing discovery process, as previously mentioned, is particularly relevant in this study, given that the securities studied are Portuguese sovereign bonds.
Applying the investment strategy described in the methodology for both tenors and combining the two in the simplest way possible - arithmetic average with weights of 50% for both - the results are the following:
[Insert Figure 6 around here]
The main statistics of the strategy are presented in Table 2:
[Insert Table 2 around here]
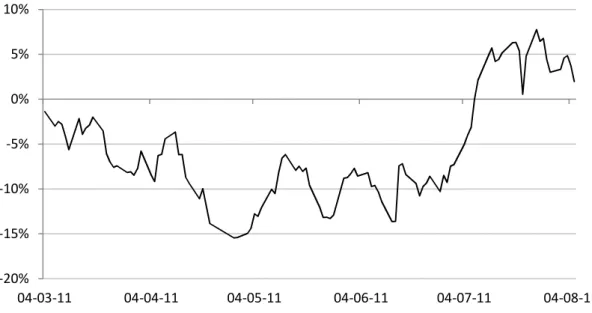
As one can easily observe, the strategy is not effective at all as it fails to yield significant positive returns, which in turn make the sharpe ratio close to zero. Furthermore the strategy is positively skewed but has fat tails given the excess kurtosis of 1.4. Based on this results one could conclude that the differences in the assumptions used by the CDS and the bond markets are not relevant enough to develop a profitable trading strategy. However, if a simple moving-average rule is included, stating that the investor does not enter any position whenever the return on the period immediately before is below the 10-days moving average, the results are the following:
[Insert Figure 7 around here]
17
[Insert Table 3 around here]
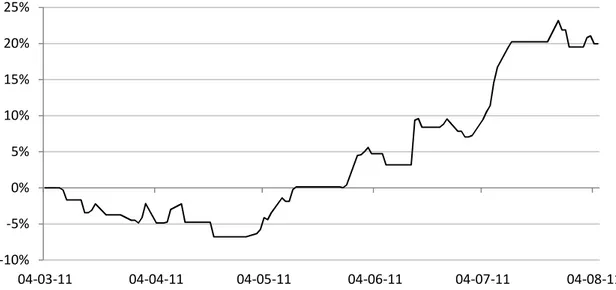
The results are now significantly better, with the sharpe ratio increasing to 2.4, mainly due to increasing returns, as the volatility of the strategy remains roughly stable. Although the skew is now even more positive, the kurtosis is also larger. However, it is clear that with this change it is now possible for investors to extract value from possibly flawed pricing decisions in the CDS market, exploiting opportunities that arise from the fact that both markets have different expectations on the same events.
These results can be significantly improved if, instead of simple 50% weights for both tenors, the following rule is used:
678 = 1 − 9:;<=>?@A :;<=>BC9
D:;<=>?@A :;<=>BCDED:;<FG>?@A :;<FG>BCD (9)
Where 678is the weight of the 5-year tenor, H IJK are the points-up-front that correspond to the CDS spread of the market and H <L are the points-up-front that correspond to the fair-value calculation of the CDS spread.
This change simply states that the further away the market price is from the fair-value calculation then the lower should be the weight for that tenor. The new results are the following:
[Insert Figure 8 around here]
[Insert Table 4 around here]
time-18
frame, possibly spanning all of the European Sovereign Crisis (late 2009 until today). Lastly, performing the study with more than two tenors for the CDS could have also resulted in more insightful and solid conclusions. In what concerns the trading strategy developed, there is also room for further improvement: on one hand, the strategy does not consider the negative effect of funding costs, even though such effect is probably mitigated by the fact that the strategy alternates between investment-positive and investment-negative. The strategy does not consider the negative effect of transaction costs either, which could be relevant given that it requires daily trading of Portuguese sovereign bonds. More importantly, the returns of the strategy are not taking into consideration the significant liquidity risk to which it is exposed, as it is likely that the prices observed would not be tradable, given the turmoil of the period under analysis. Finally, the strategy is also overlooking the effect of the carry, based on the fact that the investor only holds the position for a day.
6. Summary and Conclusion
19
using the recovery rate and term-structure of probability obtained initially, one is able to clearly understand that the assumptions used by the market to price Portuguese bonds during this period are substantially different from the assumptions used to price the CDS that offer protection against these same bonds: although the overall trend is the same, the CDS market uses the street convention of 40% for the recovery rate and, even accounting for this difference, it is still clear that the information on the default risk that is implicit in bond prices is not being fully used by participants of the CDS market. In the third and last part of the study, I present a credit-risk-neutral strategy that, based on the rational that the market price of a CDS should converge to the fair-value calculated using the expectations implicit in the bond market, yields a sharpe ratio of 3.24, presenting investors with an effective strategy to take advantage of the arbitrage opportunities that may arise between the bond and the CDS markets during particularly stressful moments such as this.
20
suggests a possible investment strategy to arbitrage this difference in expectations between the CDS and the bond market, namely by betting that the price of the CDS should converge to the fair-value obtained when the CDS is priced using the bond market’s expectations.
21 References
Andritzky, Jochen and Manmohan Singh. 2006. “The Pricing of Credit Default Swaps During Distress” IMF Working Papers 06/254
Choudhry, Moorad. 2006. “Trading the CDS Basis: Illustrating Positive and Negative Basis Arbitrage Trades” In The Credit Default Swap Basis. Wiley
Jarrow, R.A., D. Lando and S.M. Turnbull. 1997. “A Markov Model for the Term Structure of Credit Risk Spreads” Review of Financial Studies
Merton, R.C., 1974. On the Pricing of Corporate Debt: The Risk Structure of Interest Rates. Journal of Finance
Nelson, C.R. and A.F. Siegel, 1987. Parsimonious Modeling of Yield Curves. Journal of Business
O’Kane, Dominic. 2012. “The Link between Eurozone Sovereign Debt and CDS Prices” Banks, Markets and Investors, Number 117
Singh, Manmohan. 2004. “A New Road to Recovery” RISK Magazine
Svensson, L.E.O., 1994. Estimating and Interpreting Forward Interest Rates: Sweden 1992 – 1994. BER working paper 4871
Vrugt, Evert. 2010. “Estimating default probabilities and recovery values – The Case of Greece during the 2010 European Debt Crisis” Journal of Fixed Income
22 Appendices
Table 1: Overview of Portuguese bonds included in the sample
Issue Coupon Maturity Date
PGB 3.2 04/15/2011 Govt 3.2 04/15/2011
PGB 5.15 06/15/2011 Govt 5.15 06/15/2011
PGB 5 06/15/2012 Govt 5 06/15/2012
PGB 5.45 09/23/2013 Govt 5.45 09/23/2013
PGB 4.375 06/16/2014 Govt 4.375 06/16/2014
PGB 3.6 10/15/2014 Govt 3.6 10/15/2014
PGB 3.35 10/15/2015 Govt 3.35 10/15/2015
PGB 6.4 02/15/2016 Govt 6.4 02/15/2016
PGB 4.35 10/16/2017 Govt 4.35 10/16/2017
PGB 4.45 06/15/2018 Govt 4.45 06/15/2018
PGB 4.8 06/15/2020 Govt 4.8 06/15/2020
PGB 3.85 04/15/2021 Govt 3.85 04/15/2021
PGB 4.95 10/25/2023 Govt 4.95 10/25/2023
PGB 4.1 04/15/2037 Govt 4.1 04/15/2037
Figure 1: Market CDS spreads (in bp) for 5-year and 10-year tenors
0 200 400 600 800 1000 1200 1400
01-03-11 01-04-11 01-05-11 01-06-11 01-07-11 01-08-11
23
Figure 2: Recovery rate (in percentage) implicit in the cross-section of bonds
outstanding
Figure 3: Instantaneous probability of default (in percentage) implicit in the
cross-section of bonds outstanding
0 10 20 30 40 50 60 70 80 90 100
01-03-11 01-04-11 01-05-11 01-06-11 01-07-11 01-08-11
0.0% 5.0% 10.0% 15.0% 20.0% 25.0% 30.0% 35.0%
24
Figure 4: Market and fair-value CDS spread (in bp) for the 5-year tenor
Figure 5: Market and fair-value CDS spread (in bp) for the 10-year tenor
0 200 400 600 800 1000 1200 1400 1600 1800
01-03-11 01-04-11 01-05-11 01-06-11 01-07-11 01-08-11
Fair-value Market
0 200 400 600 800 1000 1200 1400 1600 1800
01-03-11 01-04-11 01-05-11 01-06-11 01-07-11 01-08-11
25
Figure 6: Cumulative returns of the investment strategy without moving-average
rule and considering weights of 50% for both tenors
Table 2: Statistics of the investment strategy without moving-average rule and
considering weights of 50% for both tenors
Investment Statistics
Mean 0.00%
Standard deviation 1.69%
Sharpe ratio 0.04
Skew 0.57
Kurtosis 1.40
-20% -15% -10% -5% 0% 5% 10%
26
Figure 7: Cumulative returns of the investment strategy with moving-average rule
and considering weights of 50% for both tenors
Table 3: Statistics of the investment strategy with moving-average rule and
considering weights of 50% for both tenors
Investment Statistics
Mean 0.18%
Standard deviation 1.21%
Sharpe ratio 2.39
Skew 1.46
Kurtosis 6.37
Figure 8: Cumulative returns of the investment strategy with moving-average rule
and dynamic weights for tenors
-10% -5% 0% 5% 10% 15% 20% 25%
04-03-11 04-04-11 04-05-11 04-06-11 04-07-11 04-08-11
-10% -5% 0% 5% 10% 15% 20% 25% 30% 35% 40%
27
Table 4: Statistics of the investment strategy with moving-average rule and
dynamic weights for tenors
Investment Statistics
Mean 0.30%
Standard deviation 1.48%
Sharpe ratio 3.24
Skew 1.91
Kurtosis 6.87
Figure 9: Summary diagram of the study
-! "
!
-# $