M
ASTER OF
S
CIENCE IN
F
INANCE
M
ASTERS
F
INAL
W
ORK
P
ROJECT
E
QUITY
R
ESEARCH OF
T
URKISH
A
IRLINES
S
ERCAN
D
AYSAL
M
ASTER OF
S
CIENCE IN
FINANCE
M
ASTERS
F
INAL
W
ORK
P
ROJECT
E
QUITY
R
ESEARCH OF
T
URKISH
A
IRLINES
S
ERCAN
D
AYSAL
S
UPERVISOR
(
S
):
P
ROFESSORA
D
OUTORA
I
NÊS
P
INTO
EQUITY RESEARCH OF TURKISH AIRLINES
By Sercan Daysal
The present project aims to value Turkish Airlines (THY), flag carrier airline of Turkey. Before the actual valuation procedure, main valuation techniques and their advantages and disadvantages were examined throughout a literature review chapter. After the review, an intrinsic value of 8.08 TRY was discovered for THY stocks as of December 2013 using discounted cash-flows method. This suggests that THY’s stocks are undervalued with a price of 6.44 TRY, and there is a 25.53% appreciation potential. Finally, relative valuation method is also applied to have a better outlook on the companies in the industry, and to identify THY’s position compared to these other companies.
Abstract
Turkish Airlines (THY) is the flag carrier airline of Turkey and it aims to be a permanent global actor in the airlines sector. THY considers itself having a constant competitive advantage since it is located on a natural hub, Istanbul.
The following Master’s Final Work is completed with an aim of discovering an intrinsic value for the stocks of THY as of December 2013. This project includes a literature review presenting pros and cons of different valuation techniques followed by an industry and company specific analysis. It continues with the actual valuation of THY performed by using Discounted Cash-Flows method. The final outcome using this method suggested an intrinsic value of 8.08 TL for THY stocks of those are undervalued with a price of 6.44 TL. This result indicates a 25.53% potential appreciation of the stock price for THY.
Finally, relative valuation method is also applied to identify THY’s position compared to how other companies in airline industry are being evaluated.
Keywords: Equity Research, Valuation, Free Cash Flow to Firm, Discounted Cash-Flows,
Resumo
A Turkish Airlines (THY) é a companhia aérea nacional da Turquia e tem como objetivo ser uma referência global no setor das companhias aéreas. A THY tem uma vantagem competitiva dada a sua localização central em Istambul.
O Trabalho Final de Mestrado que se segue tem como objetivo principal a estimatıva do valor intrínseco das ações da THY, a partir de Dezembro de 2013. Este projeto inclui uma revisão literária aos diferentes métodos de avaliação, enfatizando os seus pontos fortes e fracos. É feita uma análise específica ao nível do sector e da empresa.
Procede-se uma avaliação da THY através do método Discounted Cash-Flow, resultando um valor intrínseco de 8,08 TL por ação, indicando uma subvalorização face ao preço atual de 6,44 TL. Esta avaliação indica um potencial de valorização na ordem dos 25,53% do preço por ação.
Por fim, aplica-se o método de avaliação relativa para estimar a posição da THY no seu sector de atividade..
Palavras-chave: Equity Research, Valuation, Free Cash Flow to Firm, Discounted
CONTENTS
1. INTRODUCTION ... 1
2. LITERATURE REVIEW ... 2
2.1 Frameworks and Approaches of Valuation ... 2
2.2 Discounted Cash-Flow Valuations... 3
2.2.1 Equity Valuation ... 5
2.2.1.1 Dividend Discount Models (DDM) ... 5
2.2.1.2 Free Cash Flow to Equity (FCFE) ... 9
2.2.2 Firm Valuation ... 9
2.2.2.1 Free Cash Flow to Firm (FCFF) ... 10
2.2.2.2 Adjusted Present Value (APV)... 12
2.3 Relative Valuation... 15
2.4 Contingent Claim Valuation ... 17
3. INDUSTRY AND COMPANY INFORMATION ... 19
3.1 A General View of Airlines Industry ... 19
3.2 Turkish Airlines at a Glance ... 21
4. THY’S VALUATION ... 23
4.1 Assumptions ... 24
4.1.1 Sales Revenue ... 24
4.1.2 Costs and Expenses ... 25
4.1.3 EBITDA Margins ... 27
4.1.4 Cost of Equity ... 28
4.1.5 Cost of Debt ... 29
4.1.6. Capital Structure and WACC ... 30
4.2 DCF Valuation ... 31
4.3 Relative Valuation... 32
5. CONCLUSIONS ... 34
APPENDIX ... 36
Index of tables
Table 1: Subsidiaries and affiliates of THY ... 22
Table 2: Fleet development (avg. ratios, comparison) ... 27
Table 3: Cost of equity calculations for THY ... 28
Table 4: Cost of debt calculations for THY ... 29
Table 5: Capital structure of THY ... 30
Table 6: WACC Calculations ... 31
Index of figures
Figure 1: EBITDA Margins ... 27
Abbreviations ASK: Available seat kilometers
APV: Adjusted present value DCF: Discounted cash-flows DDM: Dividend discount model
EBIT: Earnings before interest and taxes
EBITDA: Earnings before interest, taxes, depreciation and amortization EV: Enterprise value
EV/EBITDA: Enterprise value-to-EBITDA ratio FCFE: Free cash-flow to equity
FCFF: Free cash-flow to firm GDP: Gross domestic product M&M: Modigliani and Miller P/BV: Price-to-book value ratio P/E: Price-to-earnings ratio
RPK: Revenue passenger kilometers ROA: Return on assets
ROE: Return on equity
1. INTRODUCTION
This master project is completed with the aim of discovering an intrinsic value for Turkish Airlines’ (THY) stocks as a final assignment of the Master of Science in Finance at Lisbon School of Economics and Management (ISEG). The motivation behind this work is to discover a share price for a company in the very challenging sector of airlines which is affected by countless numbers of variables from political conflicts to erupting volcanoes. I decided to choose THY as a subject of my project since it has been trying to grow and become a global actor from an emerging market, Turkey, which makes all the project even more challenging.
The dissertation is mainly divided into three parts except the introduction. The first one is literature review (Chapter 2). It presents the frameworks and approaches of valuation and continues with the different valuation techniques including their advantages and disadvantages. I made use DCF valuations and Relative valuation in this dissertation among the approaches of those had been presented.
The second part presents industry and company information (Chapter 3). It includes a general outlook of airlines industry and goes on with providing detailed information about Turkish Airlines.
The third part presents THY’s valuation (Chapter 4). It starts with the assumptions for the actual DCF valuation. After the assumptions, DCF valuation section follows with the share price discovered. This fourth chapter also includes a relative valuation section which allows a comparison of industry averages with the DCF valuation results.
As a summary, an intrinsic value of 8.08 Turkish Liras with a market cap of ~11.16B is discovered for THY which suggests a 25.53% increase compared to 6.44 TRY of share price on December 31st, 2013. In the relative valuation section, price-to-book value estimations offer us a share price of 11.68 TRY where price-to-earnings offers an 8.76 TRY and price-to-sales offers a 7.01 TRY.
2. LITERATURE REVIEW
2.1 Frameworks and Approaches of Valuation
Valuation studies and exercises, by their nature, cannot be considered completely scientific and objective ways to find out true values of assets (Damodaran 2012). Having this premise in hand, it is still fair to suggest that valuation exercises are forming starting points and providing base data in many situations. Fernández (2007) points out the importance of valuation from a corporate finance standpoint and states that “for anyone involved in the field of corporate finance, understanding the mechanisms of company valuation is an indispensable requisite”. Mergers, acquisitions, restructurings, investment evaluations, initial public offerings, credit processes, accounting and taxation procedures can be counted amongst the major reasons that require valuation assignments.
Valuation exercises include various assumptions and subjectivity; therefore there is not an absolute correct way of performing them. Yet, Fernández (2007) considers that methods of which are based on cash-flow discounting are conceptually correct compared to the other methods in his classification, namely: balance sheet-based methods, income statement-based methods and mixed methods. The term conceptually correct here means
their approach is similar to a cash budget approach which requires a comprehensive forecast of the cash to receive and to be paid in each period. Booth (2007) has a parallel opinion with Fernández on the idea of being conceptually correct and indicates that although there are numerous ways of calculating the value of a firm, it is possible to claim a conceptually correct value. Damodaran (2012) categorizes valuation approaches under three main segments: discounted cash-flow valuations (DCF), relative valuation, and contingent claim valuation. In the following sections, I will elaborate on these practices, of which I mentioned latter. I will focus on discounted cash flow methods since they are widely used in the market.
2.2 Discounted Cash-Flow Valuations
Generally speaking, the rationale behind calculating an asset’s value with this method is based on predicting expected cash-flows to be generated by the firm and discounting them to present time using a certain discount rate. Luehrman (1997) simplifies this rationale in other words and notes that “DCF valuation methodologies are all built on a simple relationship between present value and future value”. Before DCF valuation methodologies started gaining popularity in Europe and the USA around 1995, the dominant approach had been dividend discount model (DDM) of which introduced by Gordon (1959): the model that estimates value of a share through discounting dividends of those owners will receive at the cost of equity.
DCF valuation methodologies typically have advantages and disadvantages for valuation of firms in a broad sense. Taking a firm’s potential of growth, time value of
money and goodwill into consideration as well as allowing different scenario analysis can be regarded among advantages of DCF valuation. In contrast, difficulties on predicting future cash-flows and application of these methodologies to firms with negative cash-flows can be counted amongst drawbacks of DCF valuations1. In addition to these drawbacks, there is only limited empirical evidence to support DCF valuations deliver credible assessments in terms of market value (Kaplan & Ruback 1995).
Nowadays, there are different approaches present considering the implementation of DCF valuations. Kruschwitz & Löffler (2005) refer to entity approach and equity approach along with their competition against each other, in addition to this; they also classify concepts such as adjusted present value (APV) and weighted average cost of capital (WACC) under entity approach. Damodaran (2012) also categorizes DCF valuation approaches under two main groups of those are named as equity valuation and firm valuation, and describes them as such: “The first is to value just the equity stake in the business, while the second is to value the entire business, which includes, besides equity, the other claimholders in the firm (bondholders, preferred stockholders).” In the following sections, I will present DDM and free cash flow to equity (FCFE) considering equity valuation, and then I will continue with presenting free cash flow to firm (FCFF) and APV considering firm valuation. In a broad sense, FCFE and FCFF concepts will be versions of Damodaran's (2010) value of asset formula, of which cash flow component and discount rates are customized accordingly.
1
PricewaterhouseCoopers, 2013. İndirgenmiş Nakit Akım (Discounted Cash-Flow). In Şirket Değerleme Yöntemleri ve Uygulamaları (Company Valuation Methods and Applications) PwC Business School. Istanbul, p. 60
( ) ∑ ( ) ( )
In this equation, ( ) represents the expected cash flows of an asset. N represents the asset’s life time, and finally r is the discount rate which incorporates the risk factors of both the cash flow and financing (Damodaran 2010).
2.2.1 Equity Valuation
As I mentioned in the previous sections, there are many different valuation techniques and approaches. Equity valuation techniques also diverge into some subgroups. A great deal of them contains forecasting the future, but they differ on the variable to be forecasted, namely: dividends, cash flows, operating profit, or residual income (Penman 1998). I will represent DDM in the following section, and then I will continue with FCFE.
2.2.1.1 Dividend Discount Models (DDM)
DDM is considered to be the oldest DCF valuation methodology in use and although analysts tend to prevent using it nowadays, its fundamental principles still hold considering other DCF models (Damodaran 2005). DDM can be used to provide an assessment of expected return for stocks, and one can compare this return with the expected return on bonds using yield to maturity calculation before making an investment decision (Farrell 1985). The present value of dividends through infinity would represent the value of a stock according to Damodaran (2005), and it is formulized similar to Equation 1 with the necessary arrangements:
( ) ∑ ( ) ( )
In this equation, ( ) represents expected dividends per share in period t, and represents the discount rate, of which is cost of equity ( ) in this case. I will expand on cost of equity ( ) as a part of this very section, and then I will proceed with introducing two versions of DDM briefly considering different expectations about future growth.
Cost of Equity ( )
A simple definition of cost of equity would be the approximate return of which an equity investor would expect from a target firm. The risk-free rate, the market risk premium, and a company-specific risk adjustment form three main components of whose cost of equity is based upon (Goedhart et al. 2010).
Capital asset pricing model (CAPM) is the model widely used for estimation of cost of equity, yet, there are also Fama-French three-factor model and the APT arbitrage pricing theory (APT) model available. According to Goedhart et al. (2010), CAPM and Fama-French three factor models differ from each other based on their definition of risk; a stock’s sensitivity to the market is the primary concern for CAPM, whereas Fama-French three-factor model worries about the stock market, a portfolio based on firm size, and a portfolio based on book-to-market ratios regarding risk definition.(Fama & French, 2004) I will abide by CAPM factoring in the model’s largely use in practice. CAPM was originally introduced by Treynor (1961), Sharpe (1964), and Lintner (1965); and it builds on the
portfolio selection study of Markowitz (1959). According to Fernández (2007), CAPM is formulated in the following way:
( ) ( ̅̅̅̅ )
Where;
Rate of return for risk-free investments (treasury bonds)
̅̅̅̅ Expected market return
Market risk premium or equity premium
Share’s beta
Fama - French (2004) prefer to use regarding the notation of beta for an asset i; and defines it such: “it is the covariance of its return with the market return divided by the variance of the market return”. It is then formulated in the following way:
( ) ( ) ( )
Market risk premium is another component to be explained in CAPM formula. It is described as the additional return on top of risk-free rate an investor anticipates for investing in the risky stocks, and found by subtraction of the risk-free rate, , from an investment’s expected return in the whole stock market, ̅̅̅̅ (Stephenson 2009).
2.2.1.1.1 Two Versions of Dividend Discount Models
Analysts tend to fragment their forecasts into two stages: first stage usually takes care of forecasts of financial statement articles up to a maximum horizon of 15 years in most cases, and second stage concerns forecasting even beyond the horizon (Ohlson & Zhang 1999).
According to Damodaran (2012) based on different expectations about future growth, different DDM versions have been established. The first one is Gordon Growth
Model, a very sensitive model to assumptions about the growth rate, which can be utilized
to discover a firm’s value in steady state with a sustainable stable growth of dividends (Damodaran 2012). The Gordon Growth Model is expressed in the following way:
( )
( )
The second model is Two-Stage Dividend Discount Model, which considers a first growth phase with an extraordinary growth rate and a secondary phase of which regards a stable growth rate perpetually (Damodaran 2012). It is then formulated in the following way:
( )
2.2.1.2 Free Cash Flow to Equity (FCFE)
FCFE’s goal is simply finding out the value of the equity of a firm. It does not offer a drastic difference from the DDM (Damodaran 2005). Instead of using WACC as in FCFF method, this methodology uses cost of equity ( ) to discount cash-flows-to-equity for estimating equity value, additionally, it can be challenging to implement since it causes some forecasting difficulties due to having capital structure embedded in the cash flow (Goedhart et al. 2010). According to Damodaran (2005), potential dividends are discounted rather than actual dividends with the FCFE model, and free cash flow to equity can be a measure of cash flows after debt payments and reinvestment needs of a firm with the following formulae:
(7) FCFE = Net income + Depreciation – Capital expenditures – Change in non-cash working capital
– (New debt issued – Debt repayments)
Using FCFE, the value of equity is calculated in the following way:
( ) ∑ ( )
In this equation, represents the expected cash flow to equity in period t, and is the cost of equity (Damodaran 2010).
2.2.2 Firm Valuation
business as a whole including assets-in-place and growth assets (Damodaran 2005). During a reorganization time, an enterprise’s value can be obtained by projecting its earnings in future on the basis of its assets and prospects, and discounting them at a proper discount rate (Blum & Katz 1965). To set an example, this discount rate is chosen as WACC while applying FCFF method. First, I will present FCFF under this firm valuation section, and then I will continue with APV.
2.2.2.1 Free Cash Flow to Firm (FCFF)
According to Beneda (2003), FCFF is the available cash flow from operations to investors after deducting capital expenditures and investments in working capital required for ongoing operations, and it is explained in the following way:
( ) ( )
In this equation, ( ) represents after-tax operating income, which is also paralleled by Damodaran (2005).
Using FCFF, Damodaran (2012) suggests estimating a firm’s value with the following method adopting WACC as the discount rate:
( ) ∑ ( )
Where Life of the asset
Expected cash flow to firm in period t weighted average cost of capital
I will elaborate on WACC in the following passage as a part of this FCFF section. Weighted Average Cost of Capital (WACC)
WACC, in a broad sense, is utilized to find out an optimal capital structure of a firm that can provide a maximized total market value to the firm (Arditti 1973). WACC is denoted by the rates of return of a company’s both debt and equity holders require; and it is equal to weighted average of the after-tax cost of debt and cost of equity for a company financed only with debt and equity (Goedhart et al. 2010):
( ) ( )
Also, target level of debt to enterprise value using market-based (not book) values target level of equity to enterprise value using market-based values
cost of debt cost of equity
company’s marginal income tax rate
In this equation, cost of debt ( ) is usually characterized by yield to maturity of the company’s long-term, option free bonds for investment-grade companies (Goedhart et
al. 2010). It should be multiplied by 1 minus marginal tax rate to have an after-tax calculation, of which reflects the benefits of tax-deductible interest (Bruner et al. 1998).
2.2.2.2 Adjusted Present Value (APV)
Adjusting the unlevered value of a firm for the advantages to using debt can make a brief definition for APV (Booth 2007). The idea of APV method lies on examining value of financial side effects (interest tax shields, costs of financial distress) individually, and then adding those to the value of base-case that symbolizes value of a project as it was totally financed with equity (Luehrman 1997a). Goedhart et al. (2010) offers that usage of APV method does the job best when a company projects to change its capital structure, and the authors exemplify this with a usual case that a company obtains higher cash flows and decides to pay down its debt to lower debt-to-value ratios, where using WACC method would inflate the value of tax shields.
As it is also mentioned in the study of Booth (2007), Modigliani & Miller's (1958) well-recognized proposition 1, of which assumes the value of the firm is not dependent on its use of debt in a perfect world without tax obligations, constitutes a point of origin for most valuation models as well as APV:
( )
Where value of the firm with debt value of the firm without debt
advantage to using debt (e.g. corporate income tax) debt.
It is possible to conclude that in M&M’s perfect world without taxes according to Equation 12, and interactions start to happen once taxes are acknowledged. Based on this approach, APV has been advanced by Myers (1974), also making reference to possible other sources of interactions, namely; transaction costs or other market imperfections.
According to Damodaran (2005) a mathematical expression to estimate value of a firm using APV method can be delivered in the following way:
( )
Damodaran (2005), then, enlarges upon the elements of this formula and expresses them one by one, starting with the value of the unlevered firm:
( ) ( )
Where current after-tax operating cash flow unlevered cost of equity
expected growth rate of cash flows
The second component of the formula to elaborate is value of tax benefits:
( ) ∑ ( )
Considering this Equation 15, Damodaran (2005) adds that, if tax rate and debt were taken as constants and the pre-tax cost of debt utilized as discount rate, the equation would turn into the following one:
( ) ( )( )( )
( )( )
Finally, third component of Equation 13 is also explained mathematically:
( )
( )( )
Despite a lot of useful features, APV method has its handicaps like other methods. To set some examples, Luehrman (1997a) introduces two limitations of APV: firstly, analysts can overvalue the benefits of present value of tax shields due to taxation rate differences among investors, and secondly, analysts tend to ignore cost of financial distress related to corporate leverage.
2.3 Relative Valuation
The fundamental argument of relative valuation proposes that, it is possible to estimate value of most assets considering how market values the similar assets (Damodaran 2012). It can be regarded an easy and fast method to implement and revise, and it reflects the conditions in the marketplace accurately on the time of valuation. On the other hand, issues on the depth and efficiency of markets, or difficulties during obtaining the multiples and applying the method to the companies tend to grow can set drawbacks of relative valuation.
A relative valuation involves a multiples analysis, of which comparing a firm’s multiples with other companies alike, and can provide an examination of robustness of DCF valuations as well as explaining performance mismatches of a company compared to the marketplace (Goedhart et al. 2010). According to the same authors, “Using the right multiple”, “calculating the multiple in a consistent manner”, and “using the right peer group” are key requirements for a well-structured multiples analysis. Regarding finding the identical companies issue, Damodaran (2005) thinks that it is not an easy task to find sufficient number of comparable firms in a particular sector, or to define firms as comparable in a sector if their profiles (risk, growth, cash flows) are different. Damodaran (2005) adds that, if the market is not systematically overpricing or underpricing the whole sector or an asset group, relative valuations and DCF valuations would converge to each other.
The multiples of those have a common usage in the market are P/E (price to earnings) and P/BV (price to book value) associated with equity value, and EV/EBITDA (enterprise value to earnings before interest, taxes, depreciation and amortization) associated with enterprise value. Koller et al. (2011) observes that, bankers and sophisticated investors prefer EV/EBITA (not EBITDA) nowadays since it affords an even better comparison. I will expand on these multiples I mentioned in this paragraph except EV/EBITA, sticking to Damodaran's (2005) and Berk et al.'s (2012) way of formulating them.
P/E value stands for a company’s share price over its earnings per share, and although being common in the market it is subject the same limitations of dividend discount model since it concerns about equity and neglects debt effects (Berk et al. 2012). According to Damodaran (2005) it is possible to talk about three versions of P/E; the first one is current P/E estimated using current earnings, the second one is trailing P/E estimated using earnings over the last four quarters, and third one is forward P/E estimated using earnings in the next year. For a firm with stable growth, the author calculates P/E in the following way:
( )
( )
Where value of equity, earnings per share, cost of equity, and expected stable growth rate of cash flows. Briefly, a higher P/E ratio for a company compared to lower ones is better for investors since it shows an expectancy of higher growth.
Only adding the return on equity (ROE) variable to Equation 18, Damodaran's (2005) calculation of P/BV ratio is the following:
( )
( )
According to Berk et al. (2012), unlike P/E ratio which is associated only with the equity value, EV/EBITDA can provide comparison for companies with different leverage levels. The same authors calculate EV/EBITDA ratio considering a constant growth of expected cash-flows in the following way:
( ) ⁄
In this equation, current enterprise value, free cash flow, firm’s WACC, and constant long-run growth rate for free cash flows.
2.4 Contingent Claim Valuation
This method, of which uses option pricing models, is generally utilized to estimate the value of assets which shows option characteristics (Damodaran 2005). These option pricing models are mostly associated with valuing risk, or uncertainty. According to Vernimmen et al. (2009), we would not even have options if we knew the future accurately, because options value the risk that is associated with an uncertain future. As a different interpretation, Luehrman (1997b) prefers to name these situations as opportunities, and he further explains that they can be considered as potential future operations. According to the same author again, deciding on how much, or on which kind of R&D expenses to make
would be estimating those opportunities. On the other hand, Goedhart et al. (2010) introduces another definition called managerial flexibility related to option pricing; and they add that it is not the same thing with uncertainty, because it discusses the decisions of those managers make depending on the news among different business plans.
Binomial model and Black-Scholes model are the two models that are used frequently to value options. To explain in a broad sense, Cox et al. (1979) propose that “virtually all corporate securities can be interpreted as portfolios of puts and calls on the assets of the firm”. Generally speaking, the application of option pricing models to firms is not an easy task.
Regarding drawbacks of option pricing models, Damodaran (2012) emphasizes that, valuing long-term options on non-traded assets are subject to some limitations. The author notes that dealing with constant variance while estimating long-term options is tough. Considering non-traded assets, the author adds that if the underlying asset is a non-traded one, its value has to be evaluated instead of being extracted from the markets.
I will not enlarge on contingent claim valuation since I will not make use of it during valuation process due to its complex structure.
3. INDUSTRY AND COMPANY INFORMATION
3.1 A General View of Airlines Industry
Counting in its specific operations and effects on linked industries, airline industry can be easily conceived as a global economic actor which has taken a crucial part also in the making of a global economy (Belobaba et al. 2009). Aviation industry as a whole contributes $539 billion to world GDP –expected to be $1 trillion by 2026-, which would place it on 19th in the world in terms of GDP if it was a country2. Being such a giant, it is sensitive to the general state of the economy. Fuel prices, as an example, have a direct effect on the costs of airlines.
The industry has become more and more competitive after putting deregulation policies into practice; of those make cost efficiency, operating profitability and competitive behavior the number one issues instead of government policies with the beginning of 1980s (Belobaba et al. 2009). Although the industry shows a characteristic of sustained and rapid growth for the last 50 years, it has still not been highly profitable (Doganis 2010). According to the same author, growth rates vary a lot from one year to another (four -five years of downturn are likely to be followed by five-six years of high performance), since the industry seems to be cyclical and affected by outer factors. Another characteristic of the airlines industry is being capital intensive.
2
According to International Air Transport Association (IATA) data3, passenger traffic – expressed in revenue passenger kilometers (RPK)4 – grew by 5.3% in 2012, which indicates that air travel showed a 2.5 times faster growth than global GDP. In addition, Europe’s contribution to international air travel growth during 2012 was 23%, which may look like a good performance if the Eurozone crisis is considered, but it should be noted that this particular statistic includes Turkey and Russia where growth rate was higher compared to Eurozone. Another detail from IATA data indicates that, in terms of generating highest margins and largest profits, Asia-Pacific was the best performer in 2012 while European airlines could only broke even, mostly due to the Eurozone crisis.
According to Malighetti et al. (2011), some of the main factors affect valuations in the airlines industry are revenues, EBITDA margin, cash-flows, and beta considering financial side, ownership structure, and firm size and age considering other sides along with industry specific determinants such as passengers, passenger load factor5, number of routes and alliance agreements. The same authors note that low-cost airlines companies are likely to be valued greater than conventional ones by the market.
3
Annual Review 2013, available on: http://www.iata.org/about/Documents/iata-annual-review-2013-en.pdf 4
Revenue passenger miles/kms: “The basic measure of airline passenger traffic. It reflects how many of an airline's available seats were actually sold. For example, if 200 passengers fly 500 miles on a flight, this generates 100,000 RPMs.” http://web.mit.edu/airlinedata/www/Res_Glossary.html (accessed on 14th Apr 2014)
5
“Load factor represents the proportion of airline output that is actually consumed. To calculate this figure, divide RPKs by Available Seat Kms.(A measurement of airline output that refers to one aircraft seat flown one km, whether occupied or not.An aircraft with 100 passenger seats, flown a distance of 100 miles, generates 10,000 available seat miles.) Load factor for a single flight can also be calculated by dividing the number of passengers by the number of seats.” http://web.mit.edu/airlinedata/www/Res_Glossary.html (accessed on 15th Apr 2014)
3.2 Turkish Airlines at a Glance
Turkish Airlines (THY) is the flag carrier airline of Turkey. The company was established in 1933. It has been a member of Star Alliance since 2008 - according to Malighetti et al. (2011), alliance membership contributes positively to an airline regarding its valuation . THY enjoyed three prizes at the 2013 Skytrax World Airline Awards in the following categories: “Best Airline Europe” (3rd consecutive year), “Best Business Class Catering” and “Best Airline in Southern Europe”. As of December 2013, THY has flights to 201 international destinations in 105 countries as well as 43 domestic lines, and a total passenger number of 48.3 million during 20136. The company steadily increases its global market share from 0.7% to 1.6% since 2007. Its fleet has 233 aircrafts with a considerably young average fleet age of 6.7 years. THY has already ordered 95 aircrafts from Boeing and 117 aircrafts from Airbus, of those will be delivered until 2021.
Being located on a natural hub, Istanbul, THY considers itself having a permanent competitive advantage since this “reduces flight time and introduces the flexibility to use a variety of aircraft of diverse capacity” 7
. In details, being located in such a geographic place allows THY to use narrow body aircrafts which enables the company to save costs8. The company is planning to increase its flight network by taking advantage of this situation.
6 http://investor.turkishairlines.com/documents/ThyInvestorRelations/download/trafik/sunum_aralik_2013.pdf 7 http://investor.turkishairlines.com/documents/ThyInvestorRelations/download/icerikler/turkish_airlines_fact _sheet_eng.pdf 8
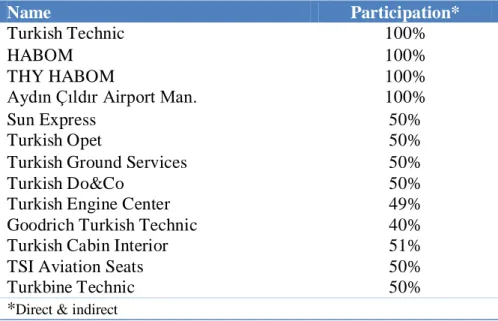
The state (Republic of Turkey Prime Ministry Privatization Administration) owns 49% of THY, and 51% of the company is open to public. It employs a total of 23,160 people as of December 20139. The company has the following subsidiaries and affiliates:
Table 1: Subsidiaries and affiliates of THY
THY is planning to follow a strategy of implementing more alliances and create more sub-brands for a better outcome regarding overall success.
9 http://investor.turkishairlines.com/documents/ThyInvestorRelations/download/finansal/2013_12_Months_Fi nancial_Report.pdf Name Participation* Turkish Technic 100% HABOM 100% THY HABOM 100%
Aydın Çıldır Airport Man. 100%
Sun Express 50%
Turkish Opet 50%
Turkish Ground Services 50%
Turkish Do&Co 50%
Turkish Engine Center 49%
Goodrich Turkish Technic 40%
Turkish Cabin Interior 51%
TSI Aviation Seats 50%
Turkbine Technic 50%
THY has been trying to raise its effectiveness and brand awareness through many sponsorship deals especially in Europe. The company had signed agreements with Manchester United and Barcelona, of those ended before the end of 2013. It still has ongoing agreements with clubs like Borussia Dortmund, Olympique de Marseille, and Aston Villa. The company has also some sponsorship deals with well-known athletes such as Lionel Messi, Kobe Bryant, Wayne Rooney, and Caroline Wozniacki as well as Europe-wide basketball organization, Euroleague. Additional to Europe, as stated in the company’s 2012 annual report, THY has intentions to implement a growth strategy in Africa. The company has already been flying to 33 airports in 23 countries as of December 2012; and it is planning to increase these numbers.
4. THY’S VALUATION
After the literature review and presenting the company itself, a DCF valuation based on WACC rates and using FCFFs is considered proper to adopt for the actual valuation of THY. The reasoning behind this can be the following: a DCF approach incorporates FCFFs makes a better representative of the value that a company generates from its core business instead of the value comes from debt and cash. By this method, finding out the cash that is available to both equity and debt investors is going to lead us an outcome of Enterprise Value. The DCF valuation is going to have a first stage during 2014-2016, a second stage during 2017-2019, and a terminal stage. These three different stages are adopted due to changing levels of country risk, fuel costs forecasts, and personnel cost forecasts over time.
Through the next section I will present the assumptions used for the DCF valuation and state the reasoning behind them from time to time. After the DCF valuation results, I will go ahead with presenting the relative valuation results.
4.1 Assumptions 4.1.1 Sales Revenue
In this study, the most important metric of which sales revenue forecasts are based on is RPK. As it has already been mentioned in the footnote 4, RPK is “the basic measure of airline passenger traffic. It reflects how many of an airline's available seats were actually sold”. Therefore, it is considered highly relevant for forecasting. Three different metrics are incorporated in a small algorithm to obtain a final RPK forecast both for international and domestic flights (Formula 21). Please refer to Appendix (1), (2), and (3) to see the overall outcome of forecasting for this section.
( ) (( ) ( ) )
In this formula, RPK is the Revenue Passenger Kilometers, representing how many of an airline’s available seats were sold. ASK is available seat kilometers which is a measurement of airline output that refers to one aircraft seat flown one km, whether occupied or not. Load factor is calculated by dividing RPKs by ASKs which represents the proportion of airline output that is actually consumed.
Basically, this formula is trying to discover the compound effect of passenger no forecast and ASK change forecast with the first part in paranthesis. Being the biggest player
in Turkish market, it is highly likely that THY’s passenger numbers will follow the trend of passenger number forecasts until 2016 of those announced by General Directorate of State Airports Authority (DHMI). These forecasts are seperated into two groups as international and domestic flights in the report. Following 2016, the forecast rates (percentages) are going to be reduced slightly by 5%. These passenger number forecasts are then incorporated in a formula with the ASK forecasts10 to discover the compound effect of them both. Finally, the value obtained in paranthesis is multiplied by the passenger load factor forecasts (varies for international and domestic passengers) which were based on average of previous five year’s numbers, since it is not reasonable to assume a 100% load factor all the time and compute the RPK forecasts on this assumption. Please refer to Appendix (4), (5), and (6) to see the forecasting inputs used in this study.
4.1.2 Costs and Expenses
In this study, I chose to forecast the cost of sales initially with a reasoning to obtain gross profit forecasts before expenses. Please refer to Appendix (1), (2), and (3) to see the relevant numbers. Cost of sales items are tried to be predicted one by one with a focus on fuel and personnel expenses bearing in mind that they are the most contributing ones to overall costs (Appendix 7,8 and 9). These two items were forecasted using different methods to be explained in the following paragraphs. Rest of the items’ forecasts are based on previous five year’s average except an item of which forecasts are already available in the annual reports -operational lease expenses-.
10
ASK forecasts were computed using the compound effect of fleet development numbers in the following years from the Annual Report presentation (2013),and total flight kilometers forecasts (based on last five year average). Please refer to Appendix (4), (5), and (6) to see forecasting inputs.
While calculating the forecasts for fuel costs, commodity price forecasts obtained from Bloomberg is made use of, as well as reports from EIA (U.S Energy Information Administration) and World Bank Commodity Market Outlook. Fuel costs are computed as ‘per ASK’. Fuel cost per ASK forecasts are the most challenging ones to compute in overall study for the obvious uncertainty and unstability reasons since fuel prices are easily affected by political and possible military conflicts. Based on the reports and forecasts from various sources, it is chosen not to increase fuel costs per ASK until 2016, and then it is decided to be increased by 0.50% in 2017, and 1% per year for 2018-19 with a reasoning that assuming no increase after the forecast period might not be realistic (Appendix 4, 5, and 6).
Personnel costs are also computed as per ASK. Even though THY obviously considers to grow, its proven success in terms of saving personnel costs are presumed to continue. Therefore, personnel costs per ASK is considered to increase the previous five years average where personnel number always grows steadily (Appendix 4, 5, and 6).
General administrative expenses and marketing & sales expenses are forecasted as a percentage of sales revenues based on previous three years ratios. THY’s operating profit after expenses had not been stable during the period of time between 2009-2011, therefore it is considered more suitable to rely on previous three years ratios where stable increase occurs. Another reasoning for using previous three years for these two kind of expenses would be THY’s developing marketing policy to raise brand awareness for the last three years. (Appendix 1,2, and 3)
4.1.3 EBITDA Margins
Having obtained operating profits and EBIT margins depending on them, the challenge faced is deciding the forecasts for depreciation and amortization. Based on the annual report presentation (2013), upcoming six years’ fleet development pace will be 80.21% of the previous five years fleet development in terms of percentage change.
Fleet development (increase by percent)
Prev. 10Y Average 2009-13 average 2013-19 average Ratio ('13-'19/'09-''13)
11.54% 15.27 % 8.41% 55.09%
Total growth (∆) between: 2009-13 2013-19 Ratio ('13-'19/'09-''13)
7 6.52% 61.37 % 80.21%
Table 2: Fleet development (averages, total growth, and ratios among different years)
Depreciation and amortization is presumed to follow this trend, and reflect 80% of the average of previous five years depreciation and amortization rate compared to sales revenue (Appendix 10 and 11). After deciding the forecasts for depreciation and amortization, EBITDA margins for the upcoming years are going to represent the trend in Figure 1.
1.9 2.7 2.6 3.9 5.2 6.8 8.4 10.2 12.69% 14.16% 10.36% 11.68% 11.06% 11.77% 11.00%10.14% 0.0% 2.0% 4.0% 6.0% 8.0% 10.0% 12.0% 14.0% 16.0% -2 4 6 8 10 12
2012 2013 2014E 2015E 2016E 2017E 2018E 2019E
Bi lli on s (T L)
EBITDA EBITDA margin
Please refer to Appendix (16) and (17) for the relevant calculations in Figure 1.
4.1.4 Cost of Equity
CAPM is implemented to compute cost of equity for THY. Formula (3) was made use of during calculations with a little difference. An additional country risk premium using Damodaran’s approach based on sovereign ratings (Moody’s Baa3) is applied on top of computed cost of equity, considering Turkey being an emerging, and obviously not the most stable market in economic and political terms.
( ) ( ) 2014-16 2017-19 Terminal 9.20% 9.20% 9.20% 1.13 1.13 1.13 15.42% 15.42% 15.42% 2.20% 2.43% 3.43% 18.43% 18.66% 19.66%
Ke, Cost of equity
Ke, Cost of equity, (Using CAPM)
Risk free rate (Rf) Beta
Expected market return (Rm)
Additional country risk premium (rating based)
Table 3: Cost of equity calculations for THY
In Table 2, Risk free rate (Rf) was obtained from Bloomberg using 10Y Turkish Government Bonds. Beta, and Expected market return (Rm) were as well acquired from Bloomberg. Three different additional country risk premium for Turkey are calculated bases on Damodaran’s approach that puts ratings into use (Moody’s Baa3). As the time passes, additional country risk premium is considered to increase due to growing uncertainty. It is assumed that Turkey’s additional country risk premium will be on the
same level of Western European countries’ average (obtained from Damodaran) in the medium term. Then in the long term an additional 1% risk applied on top of Western European countries average of 2.43%.
4.1.5 Cost of Debt
An approach of adding a spread on top of bond rate (Rf) is employed to compute cost of debt.
( ) ( )
By the help of Damodaran’s synthetic rating estimation approach, a rating and spread is discovered that can be considered suitable for THY.
2014 1,417 ,506,97 9 27 2,57 7 ,511 835,154,822 4.18 A-1.30% 10.50% 8.40% 7.43%
After-tax Cost of debt
Corresponding spread Pre-tax Cost of debt
Interest expense, (2013)
Debt value of operating leases (Damodaran)
Interest coverage ratio
Corresponding rating Kd, Cost of debt
Synthetic rating estimation (Damodaran) EBIT, (2013)
Table 4: Cost of debt calculations for THY
To assign a synthetic rating to THY, which will lead discovering a spread; it is first required to find out an interest coverage ratio. Including a circular reference in the calculations, the following approach had been followed:
( ) ( ) ( )
The interest coverage ratio value then used to find out corresponding rating, and spread. There are two after-tax cost of debt values computed. For the first value (8.40%), the tax rate applied is the one in THY’s statements (20%). The second one (7.43%) is computed using the effective tax-rate of which is 29.27% for the FY 2013. This second value with effective tax rate is then chosen to be used during WACC computation as a best assumption, because firms usually defer taxes for tax saving reasons and this creates a deviation from the standard tax rate. Effective tax rate would also be a better representative of what a company is paying instead of what it should be paying. It can display a better picture of the additional tax burden for each unit of pre-tax profit. Unlike cost of equity calculations, there are not three different cost of debts are computed for three different stages.
4.1.6. Capital Structure and WACC
Capital structure of THY is distributed in the following way with a weight of 64.02% on debt. 2013 6,962,490,356 35.98% 1,188,220,823 10,364,269,509 12,387 ,645,154 64.02% 19,350,135,510 Total - E+D Total %
Short term borrowings Long term borrowings
Total debt - D
Capital structure
Total equity - E
Total %
Table 5: Capital structure of THY
Based on this capital structure, and assuming it is not going to change dramatically over the next years three different WACC rates are calculated for three different stages.
2014-16 2017-19 Terminal 35.98% 35.98% 35.98% 1 8.43% 1 8.66% 1 9.66% 64.02% 64.02% 64.02% 7 .43% 7 .43% 7 .43% 11.39% 11.47 % 11.83% WACC WACC Share of Equity (%) Cost of equity Share of Debt (%) After-tax Cost of debt
Table 6: WACC Calculations
As it is shown in Table 6, 11.39% of discount rate will be applied to the unlevered free cash flows forecasts between 2014-2016, and 11,47% is to be applied between 2017-2019, and a 11.83% discount rate for the terminal period respectively.
4.2 DCF Valuation
To implement the DCF valuation method, future FCFF values are needed to be estimated. Taking formula 9 (p.10) into account, working capital needs and capital expenditure forecasts are required to come up with FCFF forecasts.
Working capital items (e.g. trade payables/receivables, inventories, passenger flight liabilities) are forecasted one by one based on their percentage compared to sales revenues –or cost of sales for inventory and trade payables-. The base approach is to use previous five year’s average for these items. Please refer to Appendix (12) and (13) to see the forecasts.
While estimating CapEx forecasts, the fleet development rates in Table 2 are consulted again. Factoring these ratios in together with the company’s fleet development plan, it can be assumed that investments on P&E will follow the same trend. A 5.07% year
over year change is presumed based on previous five year’s average percentage change multiplied by the relative fleet development rate of ~80% except 2017 since the company does not plan to develop their fleet during that year.
Having obtained all the forecasts for EBIT*(1-T), depreciation and amortization, working capital needs, and CapEx, FCFFs are computed. These FCFFs are then discounted on two different WACCs depending on their year, and a third WACC (11.83% in Table 6) rate is applied to terminal value. After the necessary calculations a share price of 8.08 Turkish Liras is discovered for THY. It offers us a 25.53% potential increase compared to 6.44 TRY of share price on December 31st, 2013. This difference might stem from the planned fleet and route development plan of THY that will try to meet the increasing passenger demand, in case the company implements a successful cost-saving program and manages to hedge itself especially against the fuel costs. Please refer to Appendix (14) and (15) to see the calculations.
4.3 Relative Valuation
Before deciding the peer group for THY, a company basket had been constituted which included twenty companies11 of those found suitable initially. There are companies in this initial list from various geographies of the world even though airlines based in/around Europe have more weight. The reasoning behind this is to have a better idea about the global picture, and to have bigger chances to find out companies which have a potential to be considered similar to THY. A number of sixteen metrics are chosen for
11
Air France-KLM, Intl Consolidated Airline, Lufthansa, Aeroflot-Russian Airlines, SAS AB, China Eastern Airlines, Hainan Airlines, Cathay Pacific Airways, Singapore Airlines, Thai Airways, AER Lingus, Easyjet, Ryanair, Norwegian Air Shuttle, Air Arabia, Delta Airlines, American Airlines, United Airlines, Garuda Indonesia, Copa Holdings.
comparison, some of those related with margins (EBITDA, operating profit, pretax profit, net profit), some related with liquidity ratios (current, quick), some related with profitability ratios (ROA, ROE), some related with investment valuation ratios (PBV, NFY PE, PS, NTM EV/EBITDA), and some individual basic metrics like Debt/EV, Market Cap, and Revenue one-year growth.
Nine companies12 out of those initial twenty are chosen to be in the peer group after those metrics are analyzed. Using the PBV, NFY PE, PS, NTM EV/EBITDA ratios belonging to these nine companies, different market values for THY are discovered.
PBV NFY PE PS NTM EV/EBITDA
2.32 12.53 0.52 5.23
6,962,490,356 965,244,255 18,7 7 6,7 84,325 2,658,034,138
N/A N/A N/A 13,910,378,657
N/A N/A N/A 11,552,490,332
N/A N/A N/A 513,555,407
N/A N/A N/A 1,338,983,835
16,122,620,456 12,090,059,701 9,670,043,927 4,210,427,567 12,627,574,695 11.68 8.76 7.01 3.05 9.15 Enterprise value - Net debt (-) - Financial investments (+)
THY Market value
Peer group average values
THY value (Actual book value, earnings, sales, and EBITDA)
- Cash&cash equivalents (+) Equity value
Average (PBV, PE, PS) Price
Price (if average of PBV, PE, PS was considered)
Legend
PBV: Price-to-book value NFY PE: Next fiscal year price-to-earnings
PS: Price-to-earnings NTM EV/EBITDA: Next 12 months Enterprise value/EBITDA
Table 7: Relative valuation results
It turns out that a share price of 9.15 TRY obtained which is 13.2% higher than the one obtained in DCF valuation which was 8.08 TRY.
12
Air France-KLM, Lufthansa, Aeroflot-Russian Airlines, SAS AB, Cathay Pacific Airways, Norwegian Air Shuttle, Air Arabia, Garuda Indonesia, United Airlines.
5. CONCLUSIONS
Throughout this project, the main aim has been obtaining a share price for THY to come up with an idea of company’s potential in terms of growing. After the literature review and following industry and company information chapters the actual valuation chapter started with my assumptions. I had presented different assumptions for sales revenue, costs and expenses, EBITDA margins, cost of equity, cost of debt and capital structure of those guided me obtaining three different discount rates (WACC). Forecasting future fuel and personnel costs was a real challenge during this project besides all the other assumptions. Three different discount rates (WACC) were later applied to the cash-flows for DCF valuation’s three different stages respectively for 2014-’16, 2017-’19, and a terminal stage. I also applied relative valuation method right after DCF to see THY’s position compared to how other companies in airline industry are being evaluated.
A further research idea in scope of this project might be elaborating on which tax rate to incorporate during cost of debt calculations. I decided to apply effective tax rate instead of a statutory tax rate with a reasoning that it would make a better representative of what a company is paying instead of what it should be paying. Additionally, companies usually defer taxes for tax saving reasons and this creates a different tax burden for them compared to what they would have with the statutory tax rates. On the other hand, according to Damodaran’s Q&A section in his web-site, it is not feasible to assume companies will defer their taxes in perpetuity.
Using the DCF valuation method, I ended up with a share price of 8.08 Turkish Liras for THY. It offers us a 25.53% potential increase compared to 6.44 TRY of share
price on December 31st, 2013. The market cap discovered for THY using DCF valuation method was ~11.16B.
Using the relative valuation method, twenty companies were analyzed initially on sixteen different metrics. This analyze led me nine comparable companies for THY of those are the following; Air France-KLM, Lufthansa, Aeroflot-Russian Airlines, SAS AB, Cathay Pacific Airways, Norwegian Air Shuttle, Air Arabia, Garuda Indonesia, United Airlines. After the necessary estimations I ended up having a share price of 11.68 TRY using price-to-book value multiple. Using price-to-earnings multiple the result I had was 8.76 TRY. Finally, using price-to-sales multiple I had a share price of 7.01 TRY.
APPENDIX
Appendix 1: Sales revenue, costs and expenses forecasts 2014-15
2014E Sales % 2015E Sales %
25.131.458.439 100,00% 33.660.333.403 100,00% (20.7 21.054.7 28) 82,45% (27 .309.7 23.824) 81,13% 4.410.403.7 11 17 ,55% 6.350.609.57 9 18,87 % (663.946.7 98) 2,64% (889.27 0.7 37 ) 2,64% (2.681.57 1.841) 10,67 % (3.591.618.148) 10,67 % 337 .542.435 1,34% 452.094.37 1 1,34% (184.7 85.110) 0,7 4% (247 .495.7 21) 0,7 4% 1.217 .642.398 4,85% 2.07 4.319.345 6,16% 251.314.584 1,00% 336.603.334 1,00% 22.67 9.863 0,09% 30.37 6.7 38 0,09% 1.491.636.844 5,94% 2.441.299.417 7 ,25% 323.045.631 1,29% 432.67 7 .7 80 1,29% (665.7 87 .222) 2,65% (891.7 35.7 48) 2,65% 1.148.895.253 4,57 % 1.982.241.449 5,89% (346.558.260) 1,38% (464.169.901) 1,38% 802.336.993 3,19% 1.518.07 1.549 4,51% Income Statement Sales revenue Cost of sales Gross profit
General administrative expenses
Net profit for the period
Marketing and sales expenses Other operating income Other operating expenses
Operating profit
Income from investment activities
Share of investments' profit/loss by using the equity method
Operating profit before financial income/expense
Financial income
Financial expenses (including interest)
Profit before tax from continuing operations
Tax expense of continuing operations
Appendix 2: Sales revenue, costs and expenses forecasts 2016-17
2016E Sales % 2017E Sales %
46.601.369.490 100,00% 57 .391.566.629 100,00% (38.097 .492.180) 81,75% (46.512.024.7 18) 81,04% 8.503.877.310 18,25% 10.879.541.911 18,96% (1.231.159.350) 2,64% (1.516.225.052) 2,64% (4.97 2.449.986) 10,67% (6.123.7 83.439) 10,67% 625.906.363 1,34% 7 7 0.830.281 1,34% (342.647 .810) 0,74% (421.985.337 ) 0,74% 2.583.526.526 5,54% 3.588.378.364 6,25% 466.013.695 1,00% 57 3.915.666 1,00% 42.055.365 0,09% 51.7 92.969 0,09% 3.091.595.586 6,63% 4.214.086.999 7,34% 599.024.87 7 1,29% 7 37 .7 24.589 1,29% (1.234.57 2.057 ) 2,65% (1.520.427 .946) 2,65% 2.456.048.406 5,27% 3.431.383.642 5,98% (642.624.444) 1,38% (7 91.419.309) 1,38% 1.813.423.961 3,89% 2.639.964.334 4,60% Income Statement Sales revenue Cost of sales Gross profit
General administrative expenses
Net profit for the period
Marketing and sales expenses Other operating income Other operating expenses
Operating profit
Income from investment activities
Share of investments' profit/loss by using the equity method
Operating profit before financial income/expense
Financial income
Financial expenses (including interest)
Profit before tax from continuing operations
Appendix 3: Sales revenue, costs and expenses forecasts 2018-19
2018E Sales % 2019E Sales %
7 6.262.459.7 25 100,00% 100.7 15.7 96.206 100,00% (62.394.048.17 9) 81,81% (83.257 .652.989) 82,67% 13.868.411.546 18,19% 17.458.143.217 17,33% (2.014.7 7 4.27 4) 2,64% (2.660.805.800) 2,64% (8.137 .341.691) 10,67% (10.7 46.556.699) 10,67% 1.024.286.610 1,34% 1.352.7 21.140 1,34% (560.7 38.130) 0,74% (7 40.537 .185) 0,74% 4.179.844.061 5,48% 4.662.964.673 4,63% 7 62.624.597 1,00% 1.007 .157 .962 1,00% 68.822.990 0,09% 90.890.882 0,09% 5.011.291.648 6,57% 5.761.013.517 5,72% 980.295.452 1,29% 1.294.624.345 1,29% (2.020.359.119) 2,65% (2.668.181.409) 2,65% 3.971.227.981 5,21% 4.387.456.453 4,36% (1.051.645.506) 1,38% (1.388.852.587 ) 1,38% 2.919.582.475 3,83% 2.998.603.866 2,98% Income Statement Sales revenue Cost of sales Gross profit
General administrative expenses
Net profit for the period
Marketing and sales expenses Other operating income Other operating expenses
Operating profit
Income from investment activities
Share of investments' profit/loss by using the equity method
Operating profit before financial income/expense
Financial income
Financial expenses (including interest)
Profit before tax from continuing operations
Tax expense of continuing operations
Appendix 5: Forecasting inputs 2016-17 % Change 15/16 % Change 16/17 -26,88% 10,20% -5,00% 9,69% -20,00% 8,00% -5,00% 7 ,60% 8,97 % 66.068.610 8,53% 7 1.7 02.907 8,00% 36.7 34.504 7 ,60% 39.526.327 10,20% 29.334.106 9,69% 32.17 6.581 39,58% 238.467 .333.829 23,04% 293.406.588.258 39,05% 203.055.035.267 22,64% 249.017 .849.418 Domestic 42,7 3% 35.412.298.561 25,35% 44.388.7 38.840 7 6,00% 7 6,00% 7 8,47 % 7 8,47 % -0,42% 82,08% 2,01% 83,7 3% 24,7 2% 22.448.319.27 5 24,7 2% 27 .997 .643.303 24,22% 1.083.842 24,22% 1.346.392
N/A N/A N/A N/A
22,15% 1.258.558.511 22,15% 1.537 .310.37 9 14,7 5% 319 -1,25% 315 40,16% 290.519.504.695 20,62% 350.415.504.939 0,00% 0,056 0,50% 0,057 1,39% 0,020 1,39% 0,021 11,16% 31.811 11,16% 35.360 4,7 3% 0,064 4,7 3% 0,067 46,7 9% 18.544.583.87 1 26,32% 23.425.117 .463
Other costs per ASK Other costs total
International International Passenger load factor Domestic Passenger load factor
Total flight kilometers Available ton kilometers - cargo Revenue ton kilometers - cargo
Projected passenger load factor (general)
Personnel number Personnel costs per ASK
Forecasting inputs/rates
Domestic flights passenger increase International flights passenger increase Passenger numbers
International Domestic
Revenue passenger kilometers (RPK)
Fuel costs per ASK Fleet development
Available seat kilometers (ASK)
Total cargo and mail tons (i.crg+d.crg+i.mail+d.mail)
Appendix 6: Forecasting inputs 2018-19
% Change 17/18 % Change 18/19 -5,00% 9,21% -5,00% 8,7 5% -5,00% 7 ,22% -5,00% 6,86% 8,11% 7 7 .518.7 23 7 ,7 1% 83.498.525 7 ,22% 42.380.128 6,86% 45.286.980 9,21% 35.138.596 8,7 5% 38.211.545 33,49% 391.67 5.463.806 32,58% 519.27 8.7 46.881 33,01% 331.230.983.522 32,11% 437 .602.221.7 39 Domestic 36,17 % 60.444.480.284 35,13% 81.67 6.525.142 7 6,00% 7 6,00% 7 8,47 % 7 8,47 % -0,22% 83,55% -0,41% 83,21% 24,7 2% 34.918.7 84.827 24,7 2% 43.550.863.215 24,22% 1.67 2.541 24,22% 2.07 7 .697
N/A N/A N/A N/A
22,15% 1.87 7 .801.613 22,15% 2.293.7 06.558 9,52% 345 8,99% 37 6 33,7 8% 468.7 91.7 97 .354 33,12% 624.07 5.168.097 1,00% 0,057 1,00% 0,058 1,39% 0,021 1,39% 0,021 11,16% 39.306 11,16% 43.692 4,7 3% 0,07 0 4,7 3% 0,07 3 40,10% 32.819.7 39.7 32 39,42% 45.7 56.067 .987
Other costs per ASK Other costs total
International International Passenger load factor Domestic Passenger load factor
Total flight kilometers Available ton kilometers - cargo Revenue ton kilometers - cargo
Projected passenger load factor (general)
Personnel number Personnel costs per ASK
Forecasting inputs/rates
Domestic flights passenger increase International flights passenger increase Passenger numbers
International Domestic
Revenue passenger kilometers (RPK)
Fuel costs per ASK Fleet development
Available seat kilometers (ASK)