WORKING PAPER SERIES
Universidade dos Açores Universidade da Madeira
CEEAplA WP No. 04/2012
Welfare Implications of Pension Reforms in
Portugal Using an Overlapping Generations
Model
Sameer Rege
António Gomes de Menezes January 2012
Welfare Implications of Pension Reforms in Portugal
Using an Overlapping Generations Model
Sameer Rege
CRP Henri Tudor
António Gomes de Menezes
Universidade dos Açores (DEG e CEEAplA)
Working Paper n.º 04/2012
Janeiro de 2012
CEEAplA Working Paper n.º 04/2012 Janeiro de 2012
RESUMO/ABSTRACT
Welfare Implications of Pension Reforms in Portugal Using an Overlapping Generations Model
We build a 60 period Overlapping Generations model for the Portuguese Economy to analyse the welfare impacts of pension cuts coupled with tax changes. The model is calibrated to the Portuguese economy of 2005.
We find that cutting pensions without change in taxes increases utility and is sensitive to the elasticity of substitution in the production function. Cutting pensions with an increase in retirement age has a marginal impact on utility, as people smooth consumption over their lifetimes. Cutting pensions and changing (lowering/raising) different taxes like VAT has larger welfare impacts (gain/loss) as opposed to taxes on capital.
JEL Nº: H55, E62, D91 Sameer Rege CRP Henri Tudor 66 rue de Luxembourg L-4221 Esch-sur-Alzette Luxembourg
António Gomes de Menezes Universidade dos Açores
Departamento de Economia e Gestão Rua da Mãe de Deus, 58
Welfare Implications of Pension Reforms in Portugal Using an Overlapping Generations Model
Reforma da Segurança Social e Implicações de Bem-Estar Social em Portugal: Uma Análise com base num Modelo de Gerações Sobrepostas
Sameer Rege CRP Henri Tudor 66 rue de Luxembourg L-4221 Esch-sur-Alzette Luxembourg [email protected]
António Gomes de Menezesi CEEAplA, Universidade dos Açores,
Rua da Mãe de Deus, 58
Ponta Delgada, São Miguel, Açores, Portugal Tel. +351 296 650 084
Welfare Implications of Pension Reforms in Portugal Using an Overlapping Generations Model
Abstract
We build a 60 period Overlapping Generations model for the Portuguese Economy to analyse the welfare impacts of pension cuts coupled with tax changes. The model is calibrated to the Portuguese economy of 2005.
We find that cutting pensions without change in taxes increases utility and is sensitive to the elasticity of substitution in the production function. Cutting pensions with an increase in retirement age has a marginal impact on utility, as people smooth consumption over their lifetimes. Cutting pensions and changing (lowering/raising) different taxes like VAT has larger welfare impacts (gain/loss) as opposed to taxes on capital.
JEL No.: H55, E62, D91
Resumo
Neste artigo é proposto e desenvolvido um modelo de gerações sobrepostas (OLG) de 60 períodos, com vista a análise dos efeitos de bem-estar da redução de pensões associadas a diferentes alterações de impostos. O modelo é calibrado à economia portuguesa em 2005. Os resultados indicam que a redução das pensões sem alterações em impostos resulta num aumento da utilidade, de modo sensível à elasticidade de substituição na função de produção. O corte de pensões associado a um aumento da idade da reforma tem um impacto residual na utilidade, dada a suavização do perfil do consumo ao longo da vida. O corte de pensões com alterações (aumentos/reduções) em diferentes impostos como IVA tem maiores impactos no bem-estar (aumentos/perdas) do por oposição a alterações em impostos sobre o capital. São discutidas implicações de política económica à luz da temática da sustentabilidade da segurança social em Portugal.
Introduction
This section briefly elucidates the motivation for the work and outlines the structure of the paper. We aim to study the impact on welfare of reduction in pensions either in isolation or in combination with other policies like changes in taxes or age of retirement. When it comes to pensions of the three possibilities where pensions can be increased or remain stable with time, the third possibility of falling pensions is the one that would affect the retired population the most in an adverse manner. The sustainability of pensions would depend on the amount of taxes collected. The tax collection in turn depends on the structure of taxation and the flexibility of the system to respond to the economic dynamics. Taxes can be broadly classified into direct and indirect taxes. The amount of direct taxes will largely depend on the active working population, labour skills, immigration and emigration in response to direct tax rates. The active working population is a direct output of fertility rates and the participation of women in the labour force would lower the size of the next generation leading to a baby bust.
Indirect taxes can be used by the governments to raise revenues and achieve equality by taxing the luxury goods at a higher rate, but the ability to change the indirect tax rates and the response of tax revenue generated may be limited. The problem is amenable to general equilibrium modelling with overlapping generations. The nebulous nature of the problem forces the policy analyst to focus on a specific issue under the aegis of a specific model.
We begin with a brief overview of some models used to model fiscal issues in pension reforms. We use the principal of Occam’s razor to choose a model that is relevant for the questions in this paper. We describe the model in brief and outline the calibration of the model for the base year. The simulation results follow with the final section concluding.
Literature Survey
The pioneering work on empirical overlapping generations was AK model Auerbach and Kotlikoff (1987). This study of the American economy was primarily focused toward dynamic effects of different fiscal policies like changing tax regimes.
Auerbach et. al (1989) was based on the AK model but with a greater emphasis on demographic changes and open economy and focused on four OECD countries,
Japan, Germany, Sweden and USA. The study focused on the sustainability of government revenues and tax rates for the existing level of expenditure given the demographic changes.
Bettendorf (1995) analysed the change in tax regimes by reducing taxes on labour employed in order to reduce unemployment by compensating the fall in revenue by imposing additional consumption taxes in an open economy framework with 2 countries and 20 period overlapping generations. Since the economies are small and there is balanced trade the impact of cutting labour taxes also affects the real exchange rate.
Beetsma, Bettendorf, Broer (2003) analyse the impacts of ageing on the Dutch economy with an overlapping generations model where agents differ within a generation as well across generations in terms of productivity and therefore income and have age specific death hazards. The model has eight sectors and four markets with two different pension systems. The ageing changes the structural composition of the generations and hence the ability to sustain the pension and health care system. The social security is reformed by reducing the pension benefits, increasing the retirement age besides smoothing the public pension over time.
Alders and Broer (2005) approach the problem of ageing and pension systems by endogenising the demographic changes. All the previous studies approached the pension problem with an exogenous shock to the demographics arising out of participation of women in the labour force. The participation in the labour force by women is a response to the anticipated high cost and non sustainability of the pension systems thus leading to lower fertility. Productivity shocks increase the opportunity cost of children through higher real wages. The lower size of the next generation has higher human capital and therefore higher real wage rates.
As our objective to study the impacts of tax changes and pension cuts on the Portuguese economy we use the model similar to Heer and Maussner (2005).
Model Description
The description follows Heer and Maussner (2005). Every year a generation is born. Households live for 60 years (they live for 80 years with the first 20 years being supported by their parents and enter workforce at 21). They work for T = 40 years and then lead a retired life for TR = 20 years. The following notation is used. The
superscript s denotes the age of the generation and the subscript t denotes the time. Thus
s t
c denotes the consumption of generation of age s at time t. During the first 40 years
households supply labour s t
n and enjoy leisure:lts = 1−nts.During their retirement the
labour supply is zero and all households retire after 40 years. Thus s t
n = 0 for s > T. The
household maximisation problem is as follows
∑
+ = +− +− − TR T s s t s s t s s l c U Max 1 1 1 1 ( , )β
where β is the discount factor. The instantaneous utility is a function of both, consumption c and leisure l given by
η
ψ
γ η − − + = − 1 1 ] ) [( ) , ( 1 l c l c UA small constant ψ = 0:001 is added to ensure finite utility in case of zero consumption arising out of no income. η = 2 implying that utility is negative and smaller negative values imply greater utility.
Agents are born without wealth kt1 =0 and leave no bequests. Therefore 0
61 =
t
k
Agents receive income from capital and labour and contribute an amount toward their pensions by paying taxes at the rate
τ
t. At any instant of time the pensions of the retired agents is paid by the tax collection of the working agents. Since all generations are of the same size the tax collection and pension btis steady across all generations. The budget constraint is given byT s c wn k t r k ts s t t s t k s t (1 (1 )) (1 ) ; 1,..., 1 1 = + − + − − = + +
τ
TR T T s c b k t r k ts s t k s t = + − + − = + + + +11 (1 (1 )) ; 1,...,The price of leisure is(1−
τ
t)wt, while the price of consumption is 1. The ratio of marginal utilities of consumption to leisure equals their price ratio.Production
There is a single firm that produces output Ytin period t using labour Ntand capitalKt. Labour is paid wtand capital is paid rtand depreciates at a rate δ. The
production function Yt =KtαL1t−αis Cobb-Douglas but we also subject the model to sensitivity analysis using a CES function.
Government
The government uses tax revenue from labour, capital and consumption to finance expenditure on social security. The total pension payments in each period t equal the total tax collected from the working cohorts.
∑
= = + + TR T s s t C t t k t t tw Nτ
rKτ
C bτ
EquilibriumIndividuals maximise the value function which is the discounted present value of the utility from the working and retired periods. Given initial distribution of capital
TR T s s s k0}==1+
{ and government policy b for pensions, the agents maximise the present
discounted value of the value function subject to their choice of consumption ( , t, t) s t s N K k
c , labour ns(kts,Kt,Nt)and capitalks(kts,Kt,Nt). The factor
prices,{wt,rt} are endogenously determined such that
1. the total labour supply at time t equals the labour supply of all working cohorts
∑
= = T s s t t n N 1and total capital supply at time t equals the capital supply of each
cohort
∑
+ = =T TR s s t t k K 12. Relative factor prices{wt,rt}, solves the firm's optimisation problem
3. Given the factor prices,{wt,rt}, government policy b, the individual policy choices for consumption ( , t, t)
s t s N K k c , labour ( s, t, t) t s N K k n and capital ) , , ( t t s t s N K k
4. The total demand equals total supply. The capital stock in period t + 1 is the production minus the consumption plus the non depreciated capital stock from
the current period t. t t
TR T s s t t N c K K K 1 (1 ) 1 1 α
δ
α = + − − − + = −∑
5. The government budget is balanced
Calibration
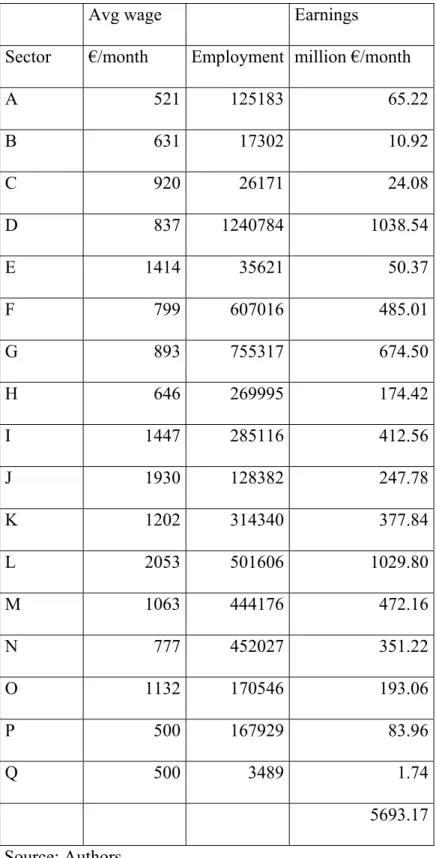
Data from different sources are reconciled to build the initial consistent data for simulation. We obtain the GDP for Portugal for 2005 from central bank sources. This is reconciled to the GDP from the income side with labour and capital income. The wages across sectors and skills are obtained from the International Labour Organisation (ILO) statistics. In case of the agriculture sector, as an average wage is not available we had to obtain the wages in different sectors as well as the average level of employment in each sector to arrive at the weighted average of labour emoluments in the agriculture sector. For the industrial sectors the details are available in the ILO statistics. The final wage payments are shown in table 1. The residual is attributed to capital payments.
Simulation Results
The model incorporates income taxes, corporate taxes (modelled as a tax on capital) and value added taxes on consumption. Our objective is to study the impact of cuts in pensions. The paper studies the cuts in isolation along with similar cuts but with changes in taxes and retirement age.
5.1 Base Case
The labour income equals labour supply in each period Nt times the net wagew(1−
τ
), where τ is the income tax rate levied on labour income. The corporate tax rate is levied on capital use of firms. The pension, denoted by b equals a fraction ζ of the wage income. As wage income varies across age, we model b, as a fraction of the average wage income (average labour supplyNxw− ). Thus − − = w N b
ξ
(1τ
)In the model the wage rate w, is determined endogenously through the demand and supply of labour in production. ζ, the replacement ratio, is a policy instrument in the hands of the policy maker and exogenous. The tax rate τ is determined to replicate ζ. As a benchmark case we maintain pensions at the same level as the wage and compare the utility with respect to this scenario.
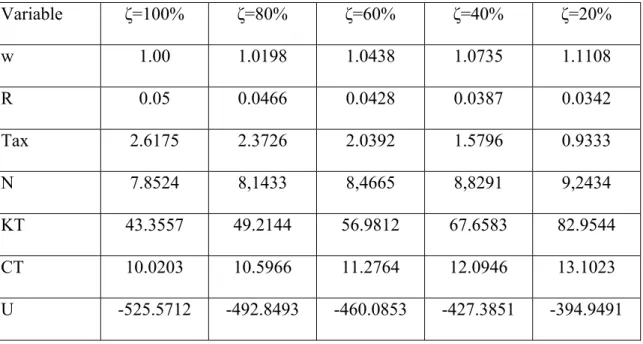
5.2 Cut in Pensions: ζ equals 80%, 60%, 40% and 20% of average wage
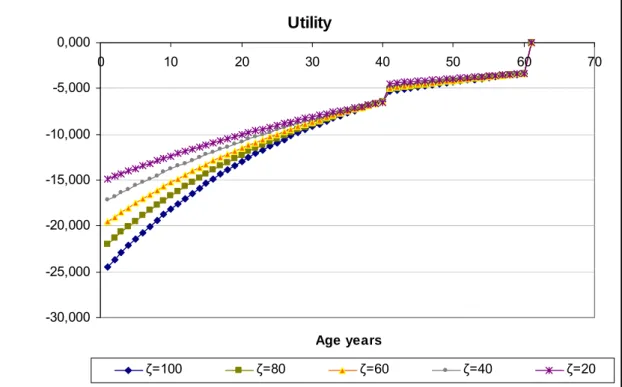
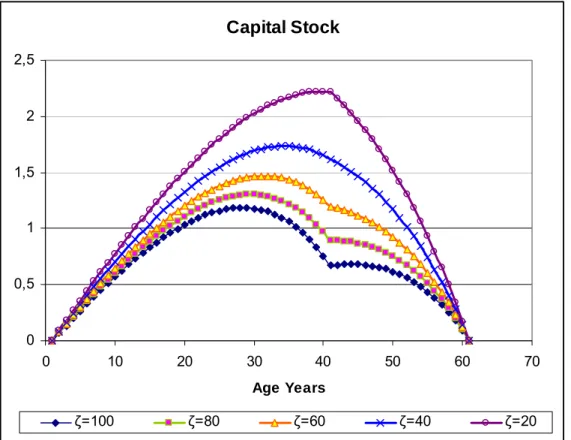
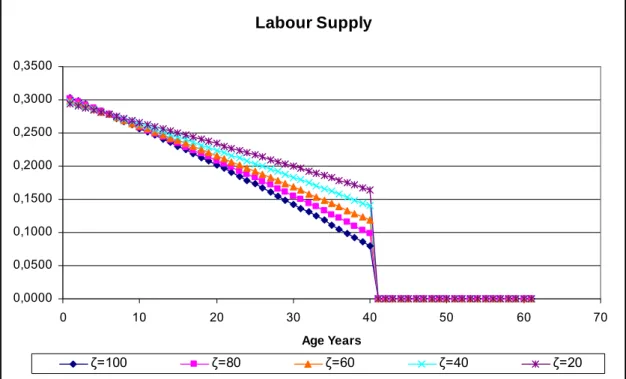
The impacts of pension cuts are tabulated in table 2. Figure 1 shows the changes in utility over time due to various pension cuts while figure 2 shows the changes in capital and figure 3 the changes in labour supply over time. As the pension as a fraction of the average wage reduces, there is an increase in the savings to cover the fall in pension income. The increased savings leads to greater capital stock and thus also leads to greater demand for labour. The increase in capital stock leads to a fall in the return to capital, but capital deepening leads to an increase in capital income. Even though the labour supply increases leading to a fall in leisure, the overall increase in income leads to an increase in consumption. This increase in consumption leads to an increase in utility despite a greater cut in pensions
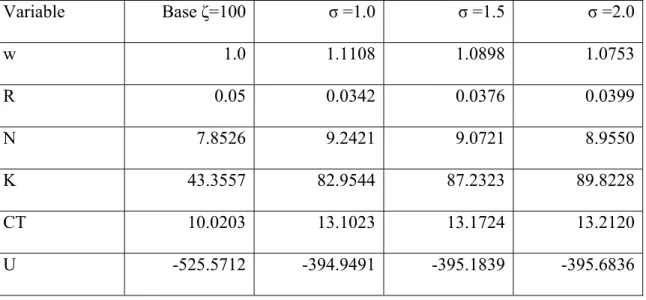
5.2.1 Sensitivity Analysis
We subject the model to changes in values of some parameters to ascertain the impact of these parameters on the model results. This section depicts the results of changes in the elasticity of substitution. We reduce the pensions to 20% while changing the elasticity from 1, 1.5 and 2.
The model results are driven by the fall in pensions and the income necessary to compensate for it. The logical alternative in absence of any labour income is the income from capital. One requires greater income from capital and that is possible only with greater savings and hence an increase in capital stock. The greater elasticity of substitution permits lower labour and higher leisure leading to lower wage rates. To compensate for less labour, greater savings result in a larger capital stock and lower return to capital. The impact on utility is marginal and one can conclude that elasticity of substitution has negligible effect on welfare.
Table 4 shows the impact on welfare with cut in pensions along with a simultaneous change in taxes. The cut in pensions followed by elimination of taxes is the most beneficial, though impractical, has been simulated only for the purpose of a benchmark. The elimination or reduction of capital taxes has a smaller positive impact on welfare as opposed to that of the VAT. The simulation results show the welfare after an imposition of capital taxes t and VAT K t which is the opposite of elimination of C
these taxes. The rationale for the greater gain in welfare after reduction or elimination of VAT is that the level of consumption directly affects welfare. Any taxes on consumption lowers the level of consumption and thus impacts utility. As far as capital taxes are concerned, they affect only the production decisions and lead to a lower capital stock and higher consumption.
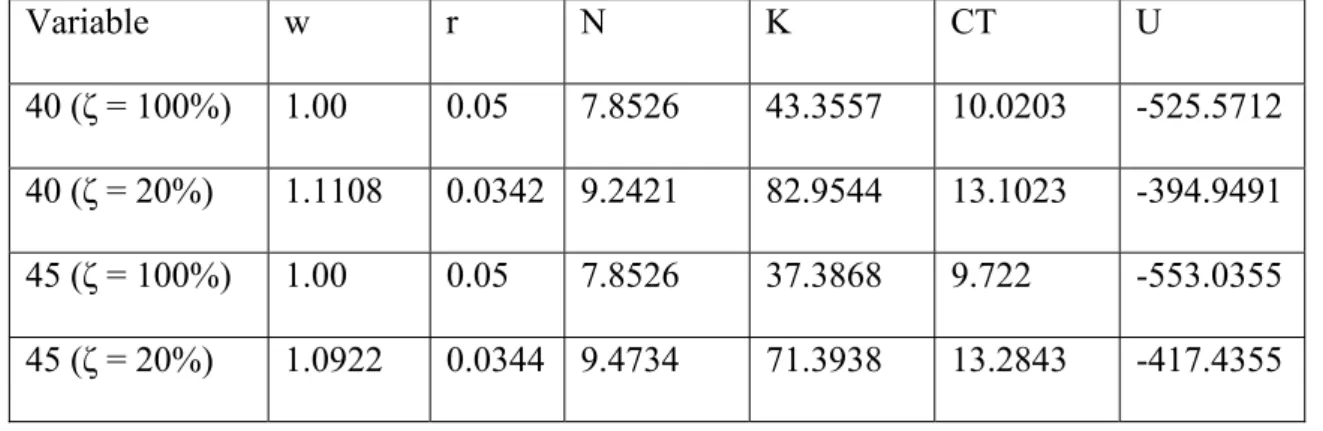
5.4 Reduce pensions and increase retirement age
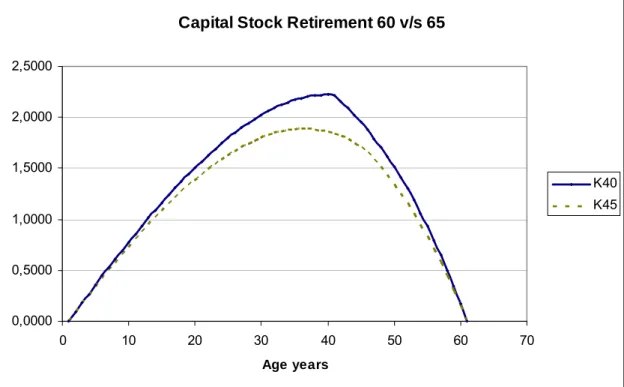
In the base case the pension is reduced to 20% of the average wage income when individuals are retiring at the age of 60. In the counterfactual, the retirement age is increased to 65. The effect of increasing the retirement age is that the average labour supplied over the lifetime increases and thus pension benefits available in the post retirement years are higher on account of the larger average labour supplied, albeit for a shorter duration. Table 5 shows the impact on major variables after the increase in retirement age. Figure 2 shows the change in labour supply, consumption and capital stock with the dashed lines representing the time path of these variables when the retirement age is increased to 65. The capital stock accumulation is less when the retirement age is increased as individuals have access to labour income and also have to live less on pensions as the fixed life span is 80 years. There is a minor decrease (approximately 5%) in utility from increase in retirement age on account of marginally greater consumption over the entire life span. The fall in utility is on account of additional labour supply for five years leading to loss of leisure during those years. Conclusion
We have undertaken three basic types of simulations viz. cutting pensions without change in taxes, cutting pensions with an increase in retirement age and cutting pensions and changing different taxes. We find that the cut in pensions forces individuals to save more and work more over their lifetimes. This leads to increase consumption over the lifetime contributing to an increase in utility. The result is not
very sensitive to the elasticity of substitution in the production function and the utility falls marginally with increase in elasticity.
Cutting or imposing VAT has a larger impact on welfare as opposed to cutting taxes on capital. VAT affects the level of consumption that has a direct bearing on welfare while cutting or imposing capital taxes has an effect on consumption but indirectly via lower capital stock that results from lower savings and higher consumption. Hence if a pension cut is proposed along with a reduction in taxes, VAT cut will lead to greater welfare.
The impact on utility of increasing retirement age from 60 to 65 for the same cut in pensions is marginal as individuals smooth consumption over their lifetimes. The additional work life leads to a lower savings and thus lower capital accumulation as fall in capital income is compensated by the increase in labour income.
References
Alders Peter and Broer Peter D. (2005) Ageing, fertility, and growth, Journal of Public
Economics, 89:1075-1095.
Auerbach Alan J and Kotlikoff Laurence J (1987), Dynamic Fiscal Policy, Cambridge University Press.
Auerbach Alan J, Kotlikoff Laurence J, Hagemann Robert P and Nicoletti Giueseppi (1989) The Economic Dynamics of an Ageing Population, Economics Department
Working paper No. 62, Organisation for Economic Cooperation and Development.
Beetsma Roel, Bettendorf Leon and Broer Peter (2003) The budgeting and economic consequences of ageing in the Netherlands. Economic Modelling, 20:987-1013. Bettendorf L (1995) General Equilibrium Simulations of Replacing a Wage Tax with a
Consumption Tax, Tidjschrift voor Economie en Management, XL (3-4):269-283,. Heer Burkhard and Maussner Alfred- Dynamic (2005) General Equilibrium Modelling-
Computational Methods and Applications, Springer.
i Corresponding Author
Table 1: Portugal: Wage earnings per month by sector 2005
Avg wage Earnings
Sector €/month Employment million €/month
A 521 125183 65.22 B 631 17302 10.92 C 920 26171 24.08 D 837 1240784 1038.54 E 1414 35621 50.37 F 799 607016 485.01 G 893 755317 674.50 H 646 269995 174.42 I 1447 285116 412.56 J 1930 128382 247.78 K 1202 314340 377.84 L 2053 501606 1029.80 M 1063 444176 472.16 N 777 452027 351.22 O 1132 170546 193.06 P 500 167929 83.96 Q 500 3489 1.74 5693.17 Source: Authors
Table 2: Variable Values: Pension as a % ζ of wage Variable ζ=100% ζ=80% ζ=60% ζ=40% ζ=20% w 1.00 1.0198 1.0438 1.0735 1.1108 R 0.05 0.0466 0.0428 0.0387 0.0342 Tax 2.6175 2.3726 2.0392 1.5796 0.9333 N 7.8524 8,1433 8,4665 8,8291 9,2434 KT 43.3557 49.2144 56.9812 67.6583 82.9544 CT 10.0203 10.5966 11.2764 12.0946 13.1023 U -525.5712 -492.8493 -460.0853 -427.3851 -394.9491
Table 3: Variable Values: Elasticity of Substitution σ = 1, 1.5, 2, ζ = 20% Variable Base ζ=100 σ =1.0 σ =1.5 σ =2.0 w 1.0 1.1108 1.0898 1.0753 R 0.05 0.0342 0.0376 0.0399 N 7.8526 9.2421 9.0721 8.9550 K 43.3557 82.9544 87.2323 89.8228 CT 10.0203 13.1023 13.1724 13.2120 U -525.5712 -394.9491 -395.1839 -395.6836
Table 8: Pension cut from ζ=80% to 20%, retirement age 65, change in taxes w R N K CT U tK% VAT% ζ % 1 1.0448 0.0404 10.0862 53.8069 11.9276 -438.8999 10 0 40 2 1.0367 0.0447 9.5395 76.6833 11.1934 -481.7129 0 10 40 3 1.0509 0.0424 9.7279 72.1919 12.4129 -427.8508 0 0 40 4 1.0780 0.0348 10.6753 68.3768 12.9277 -406.9945 10 0 20 5 1.0616 0.0419 9.9715 95.8243 12.1833 -443.5920 0 10 20 6 1.0875 0.0378 10.2986 88.6890 13.5070 -393.4440 0 0 20
Table 5: Pension 20% of wage and retirement age increased from 60 to 65 Variable w r N K CT U 40 (ζ = 100%) 1.00 0.05 7.8526 43.3557 10.0203 -525.5712 40 (ζ = 20%) 1.1108 0.0342 9.2421 82.9544 13.1023 -394.9491 45 (ζ = 100%) 1.00 0.05 7.8526 37.3868 9.722 -553.0355 45 (ζ = 20%) 1.0922 0.0344 9.4734 71.3938 13.2843 -417.4355
Figure 1: Utility Pension ζ = 100%, 80%, 60%, 40% and 20% of wage Utility -30,000 -25,000 -20,000 -15,000 -10,000 -5,000 0,000 0 10 20 30 40 50 60 70 Age years ζ=100 ζ=80 ζ=60 ζ=40 ζ=20
Figure 2: Capital Stock with replacement rate ζ = 20%, 40%, 60% 80% and no cut Capital Stock 0 0,5 1 1,5 2 2,5 0 10 20 30 40 50 60 70 Age Years ζ=100 ζ=80 ζ=60 ζ=40 ζ=20
Figure 3: Labour Supply- with replacement rate ζ = 20%, 40%, 60% 80% and no cut Labour Supply 0,0000 0,0500 0,1000 0,1500 0,2000 0,2500 0,3000 0,3500 0 10 20 30 40 50 60 70 Age Years ζ=100 ζ=80 ζ=60 ζ=40 ζ=20
Figure 4: Capital Stock- replacement rate ζ = 20% - retirement after 40 and 45
Capital Stock Retirement 60 v/s 65
0,0000 0,5000 1,0000 1,5000 2,0000 2,5000 0 10 20 30 40 50 60 70 Age years K40 K45