ISSN: 1809-4430 (on-line)
_________________________
1 Projeto realizado com fomento do CNPq
2 Graduando em Engº de Produção, Departamento de Engenharia de Produção de Sorocaba, UFSCar/Sorocaba – SP,
3 Engº Agrícola, Prof. Doutor, Departamento de Engenharia de Produção de Sorocaba, UFSCar/Sorocaba – SP, [email protected] TECHNICAL PAPERS
EFFECTS OF MAINTENANCE MANAGEMENT PROCEDURES IN SUGARCANE MECHANIC HARVESTING SYSTEM EQUIPMENT
Doi:http://dx.doi.org/10.1590/1809-4430-Eng.Agric.v35n6p 1187-1197/2015
LUÍS F. F. DE FARIA2, JOÃO E. A. R. DA SILVA3
ABSTRACT: The aim of this study was to evaluate the effects of modifying the maintenance programming of equipment used in sugarcane mechanical harvesting, by transferring actions that can be planned to periods when machines are inactive due to meal breaks and other working shift transitions stoppages. A simulation model was developed to represent the maintenance procedures of combines, haulouts, and other vehicles used by a harvest team. Scenarios were tested using alternatives for interventions such as refueling, lubrication and harvester blade replacement, enabling strategies to be focused towards better utilization of cutting, loading, and transport (CLT) system equipment. As a result, it was possible to remove one combine and two haulouts, while maintaining current daily production. The maintenance time for harvesters, which refers to corrective maintenance and the transfer of remaining interventions for periods of inactivity, was reduced from 10.0% to 3.5% over the useful period. This study indicates that maintenance management in the sugarcane sector enables the expanded use of equipment, leading to the greater productivity of the CLT system.
KEYWORDS:agricultural machinery, breakdowns, simulation.
EFEITOS DA PROGRAMAÇÃO DE PROCEDIMENTOS DE MANUTENÇÃO EM
EQUIPAMENTOS DO SISTEMA DE COLHEITA MECANIZADA DE
CANA-DE-AÇÚCAR1
RESUMO: O objetivo deste trabalho foi avaliar os efeitos da modificação da programação da manutenção dos equipamentos utilizados na colheita mecanizada de cana-de-açúcar, ao se transferir as intervenções que podem ser programadas para períodos em que as máquinas estão inativas, em razão de refeições e trocas de turno dos operadores. Um modelo de simulação foi desenvolvido para representar os procedimentos de manutenção de colhedoras, tratores-transbordo e veículos de uma frente de colheita. Foram testados cenários com alternativas de intervenções como o abastecimento, a lubrificação e a troca de facas das colhedoras, tornando possível a análise de estratégias para o melhor aproveitamento de todo o sistema de corte, carregamento e transporte (CCT). Como resultado, foi possível reduzir uma colhedora e dois tratores-transbordo, mantendo a quantidade de cana processada. A taxa de manutenção das colhedoras passou de 10,0% para 3,5% em seu período útil, referente às manutenções corretivas, transferindo as demais intervenções para os períodos de inatividade. O estudo indicou que a gestão da manutenção no setor sucroenergético viabiliza a ampliação do uso dos equipamentos e, consequentemente, a obtenção de maior produtividade do sistema de CCT.
INTRODUCTION
The sugarcane sector is a key economic activity in Brazil due to its productivity and due to the technology applied in agricultural areas. According to the National Supply Company (CONAB, 2014), in the 2013/2014 harvest, 658 million tons of sugarcane were processed, which produced 28 million cubic meters of ethanol and 38 million tons of sugar. Among the factors that drive forward this sector in Brazil, is the incentive to ethanol use, according to TRIANA (2011) and mentioned by MORAES et al. (2014), as it is both an alternative to fossil fuels and makes use of sugarcane sub products for energy purposes.
Sugarcane production chains were forced to restructure their processes in order to reconcile environmental, economic, and social issues. In manual harvesting, field burning enables cutting but reduces air quality and causes severe damage to public health (AGUIAR et al., 2009). After an act of São Paulo state legislation stipulating a chronogram to the end the burning (Law 11.241/02), producers intensified mechanization, using combines that process sugarcane without the need for previous burn. As reported by CAPAZ et al. (2013), mechanization in a haulout consists of the threshing, cutting and disposal of sugarcane.
Considering the complexity and high price of equipment, the interaction of processes that compose mechanical harvesting must be well planned to avoid wasting time and money. In accordance with HIGGINS et al. (2004), harvest and transport operations can potentially reduce costs, as they are independent sectors with representative costs. Among the operations subject to planning, maintenance is highlighted as being directly related to the appropriate use and productivity of machines. According to PINTO (1994) cited by FILIPE (2006), maintenance can be analyzed under three headings: economic, legal, and social. The first represents the best usage of conducted investments and increased useful life of equipment; the second represents adaptation to safety and quality standards and the third characterizes preservation and improvement of the corporate image.
As stated in requirements related to maintenance, such as NBR 5462 (ABNT, 1994) and the
British Standard BS EN 13306 (2010) cited by NARAYAN (2012), maintenance is the
combination of technical and administrative techniques, including supervision, aimed at keeping or replacing an item to a state in which it can perform a required role. Thus, it allows process continuity and greater employment of systems.
KARDEC & NASCIF (2012) highlight the importance of maintenance planning and organization, through creation of a system that allows the establishment of guidelines governing, for example, which services will be carried out, when they will be conducted and the materials that are required. Therefore, it is observed that focus on planning will minimize non-programed stoppages and guarantee efficiency of maintenance processes.
In order to have an efficient planning of operations related to maintenance, management tools can assist decision-making regarding activities subject to programming. Of the options, simulation of discrete events can be interesting as it consists of the development of a model that represents systems of interest in a digital environment. Therefore, simulation can enable us to explore scenarios and compare hypotheses that could be difficult to experiment. In other words, according to FREITAS FILHO (2008), simulation permits the analyst to carry out studies to answer questions without disturbing the systems themselves.
MATERIAL AND METHODS
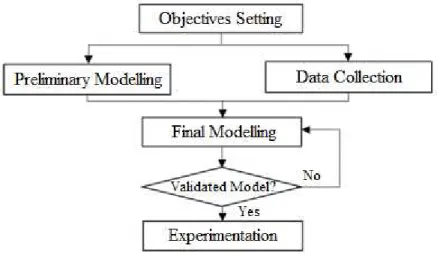
This study was based on the methodologies of FREITAS FILHO (2008), BANKS (1998), and KELTON et al. (2007), synthetized into six steps: aim definition, preliminary modeling, data
collection, definitive modeling, validation and experimentation (Figure 1).
FIGURE 1. Steps in a simulation study.
After defining the study objective, a preliminary model of cutting, loading, and transport
operations (CLT) was developed with a mechanic-harvesting front of sugarcane crop, using Arena
software v. 14. The model was focused on the harvest, trans-shipment, and transport of sugarcane to
the plant. There, the model considered the weighting (gross), sampling (probe), unloading and weighting of vehicle (tare). Maintenance, operation and handling times of equipment (combines, haulouts and vehicles), were collected at a Bauru/SP region plant. From this data, probability distributions were set to represent operations, thus concluding the definitive modeling. In this process, adherence was verified through Chi² and Kolmogorov-Smirnov tests, as identified by FREITAS FILHO (2008). The probability distributions obtained from statistical treatment were used in simulations of all studied scenarios.
The model was validated through the comparison of the results obtained using the model with the real results of CLT system, confirmed by the plant agricultural administration. According to BALCI (1994), PIDD (1995), and SARGENT (1994) cited by FREITAS FILHO (2008), the analysis and evaluation of models by specialists is the most simple and efficient validation form.
With assumptions from the plant, the reference scenario was designed for simulation, which in experimentation was explored in new intervention planning, in periods of machine inactivity (meal breaks/working shifts transitions stoppages). For each scenario, a comparison table and a histogram of sugarcane production were generated, to measure risk of not meeting the goal. The remaining assumptions are:
Simulated time of 200 days, with targeted average daily production of 3,000 Mg day-1;
Nominal milling of 125 Mg h-1, with 5% of increment (milling peak);
Equipment in reference scenario: 5 combines, 10 haulouts and 9 vehicles;
Transport in road trains, with net load of 55 Mg, with accommodation of 8 transshipments;
Haulout configuration: traction of two transshipment implements per tractor;
Average distance between the harvest team and plant of 25 km;
TABLE 1: Average values for agriculture operations.
Operation Average time (h)
Unloaded displacement 0.07
Harvest 0.33
Loaded displacement 0.08
Load transfer to vehicle 0.07
Maintenance/interruptions: for each intervention, two probability interventions were found:
time between interventions and time (duration) of intervention. Tables 2, 3 and 4 indicate average times for combines, haulouts and vehicles;
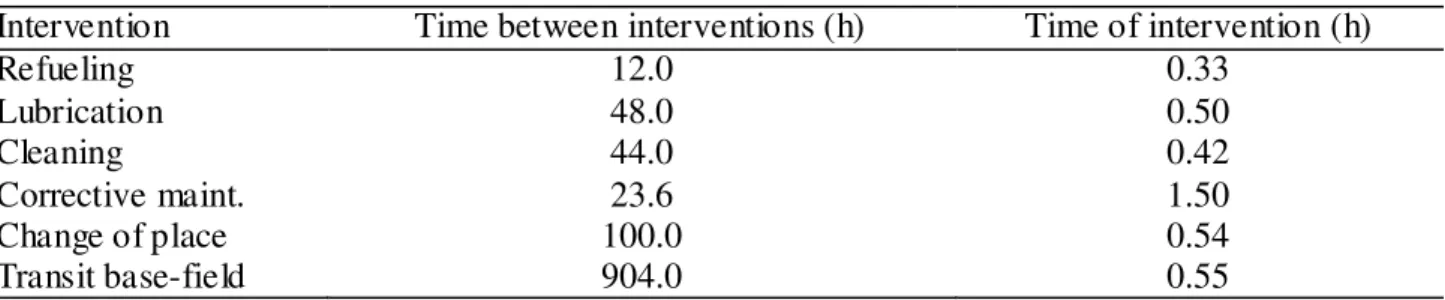
TABLE 2. Interventions for combines.
Intervention Time between interventions (h) Time of intervention (h)
Refueling 12.0 0.33
Lubrication 48.0 0.50
Cleaning 44.0 0.42
Corrective maint. 23.6 1.50
Change of place 100.0 0.54
Transit base-field 904.0 0.55
TABLE 3. Interventions for haulouts.
Intervention Time between interventions (h) Time of intervention (h)
Refueling 12.0 0.25
Lubrication 24.0 0.25
Change of place 95.0 0.44
Corrective maint. 23.7 1.10
Transit base-field 27.8 0.48
TABLE 4. Interventions for vehicles.
Intervention Time between interventions (h) Time of intervention (h)
Refueling 24.0 0.5
Lubrication 192.0 4.0
Field maint. 240.0 6.0
Garage maint. 168.0 4.0
Tire repair garage 360.0 4.0
Three shifts of 8 h day-1, starting at 7:00 am, 03:00 pm and 11:00 pm, with 1 h for meal;
Meal stoppage limit of 2 combines and 4 haulouts simultaneously;
Shift transitions can start at 0.5 h before the end of shift; together with 3 daily hours of meal breaks, the available time for production is around 21.0 and 19.5 h per day.
RESULTS AND DISCUSSION
Five scenarios were simulated: a reference scenario for validation and reference and four alternative scenarios with programing variations of maintenance subject to planning.
Reference scenario
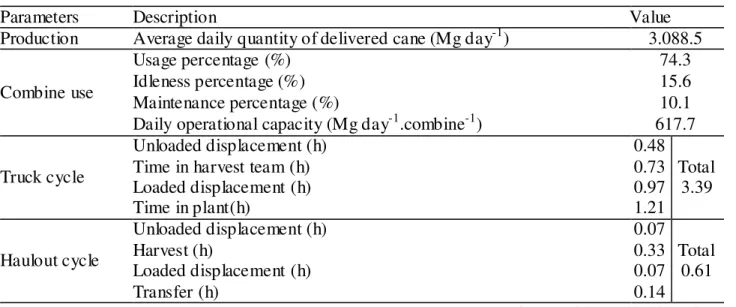
TABLE 5. Results for the reference scenario.
Parameters Description Value
Production Average daily quantity of delivered cane (Mg day-1) 3.088.5
Combine use
Usage percentage (%) 74.3
Idleness percentage (%) 15.6
Maintenance percentage (%) 10.1
Daily operational capacity (Mg day-1.combine-1) 617.7
Truck cycle
Unloaded displacement (h) 0.48
Time in harvest team (h) 0.73 Total
Loaded displacement (h) 0.97 3.39
Time in plant(h) 1.21
Haulout cycle
Unloaded displacement (h) 0.07
Harvest (h) 0.33 Total
Loaded displacement (h) 0.07 0.61
Transfer (h) 0.14
Source: Elaborated by the authors.
Source: Elaborated by the authors.
FIGURE 2. Average production and frequencies - reference scenario.
Daily delivery exceeded 3,000 Mg day-1 in 98% of simulated days, indicating comfortable
achievement of the targeted goal. In 2% of days, the delivered sugarcane was between 2,950 and
3,000 Mg day-1. Maintenance percentage of combines was 10.1% of available time for production.
Operational capacity of combines of 617.7 Mg day-1 was comparable with the existing system
in a partner plant where data was collected, without equipment overload. Regarding cycle time of transport, it is noted that the truck stayed for 1.21hrs in the plant, confirming that the unloading process operated within the limit, and constituted the CLT system bottleneck.
Scenario 1
In scenario 1, the quantity of combines and haulouts was reduced to 4 and 8, respectively,
once the delivery of 3,000 Mg day-1 had already been effortlessly reached in reference scenario. In
activities of combines were altered and transferred to meal times and shift transitions periods. These alterations led to results presented on Table 6 and Figure 3.
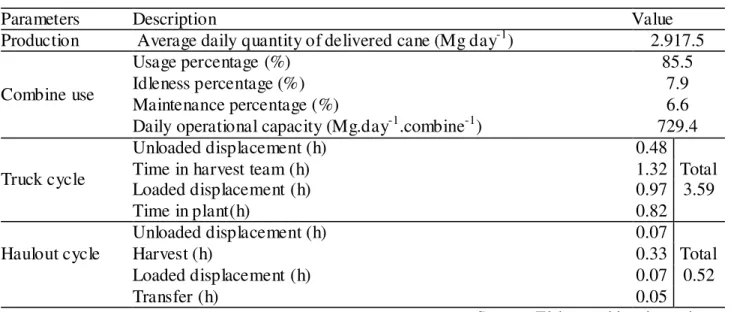
TABLE 6. Results for scenario 1.
Parameters Description Value
Production Average daily quantity of delivered cane (Mg day-1) 2.917.5
Combine use
Usage percentage (%) 85.5
Idleness percentage (%) 7.9
Maintenance percentage (%) 6.6
Daily operational capacity (Mg.day-1.combine-1) 729.4
Truck cycle
Unloaded displacement (h) 0.48
Time in harvest team (h) 1.32 Total
Loaded displacement (h) 0.97 3.59
Time in plant(h) 0.82
Haulout cycle
Unloaded displacement (h) 0.07
Harvest (h) 0.33 Total
Loaded displacement (h) 0.07 0.52
Transfer (h) 0.05
Source: Elaborated by the authors.
Source: Elaborated by the authors.
FIGURE 3. Average production and frequencies for scenario 1.
Scenario 1 showed a reduction in average daily production of 5.5%, to 2,917.5 Mg day-1,
compared to the reference scenario. Production above 3,000 Mg day-1 occurred in 38% of days. In
relation to the previous scenario, the time of vehicles in plant was reduced from 1.21 h to 0.82 h, as the CLT system bottleneck was transferred to field, motivated by a reduction of combine and of two haulouts. On the other hand, permanence time of truck in field increased from 0.73 h to 1.32 h, an increment of 80.1% and cycle time of haulouts reduced from 0.61 to 0.52; which means, a reduction
of 14.7%. The operational capacity of combines of 729.4 Mg day-1 was considered high, but
Scenario 2
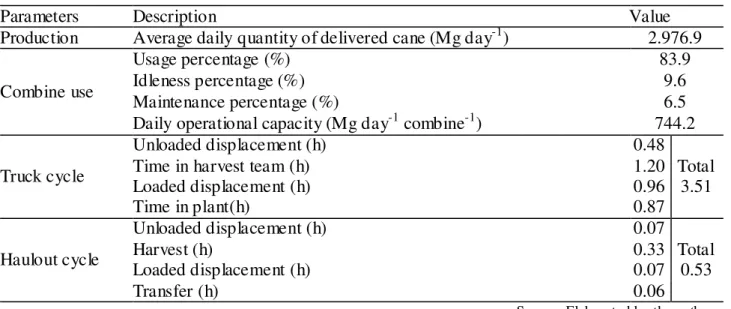
In scenario 2, refueling and lubrication operations of haulouts were also transferred to periods of meals and shift transitions. The remaining operational conditions are the same from scenario 1. The obtained results are described on Table 7 and Figure 4.
TABLE 7. Results for scenario 2.
Parameters Description Value
Production Average daily quantity of delivered cane (Mg day-1) 2.976.9
Combine use
Usage percentage (%) 83.9
Idleness percentage (%) 9.6
Maintenance percentage (%) 6.5
Daily operational capacity (Mg day-1 combine-1) 744.2
Truck cycle
Unloaded displacement (h) 0.48
Time in harvest team (h) 1.20 Total
Loaded displacement (h) 0.96 3.51
Time in plant(h) 0.87
Haulout cycle
Unloaded displacement (h) 0.07
Harvest (h) 0.33 Total
Loaded displacement (h) 0.07 0.53
Transfer (h) 0.06
Source: Elaborated by the authors.
Source: Elaborated by the authors.
FIGURE 4. Average production and frequencies for scenario 2.
The strategy used in scenario 2 enabled an increase on average daily delivery of 2%,
improving it to 2,976.9 Mg day-1; however, the greatest benefit was the indicative of daily registry
that pointed that in 71% of days the delivery was above 3,000 Mg day-1, which is promising,
Scenario 3
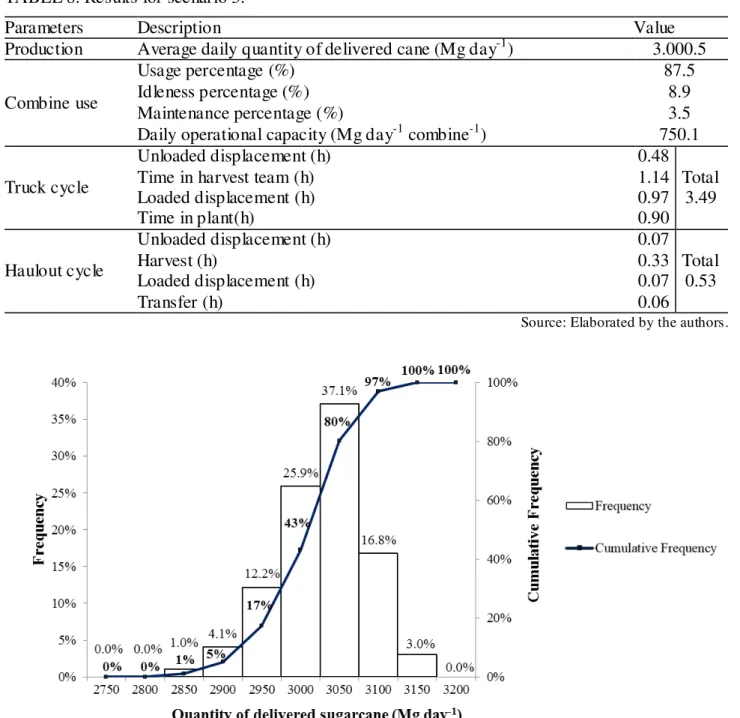
Additionally to characteristics and parameters of scenario 2, scenario 3 considers transfers of combine blade replacement procedures to meals and shift transitions periods. The results are presented on Table 8 and Figure 5.
TABLE 8. Results for scenario 3.
Parameters Description Value
Production Average daily quantity of delivered cane (Mg day-1) 3.000.5
Combine use
Usage percentage (%) 87.5
Idleness percentage (%) 8.9
Maintenance percentage (%) 3.5
Daily operational capacity (Mg day-1 combine-1) 750.1
Truck cycle
Unloaded displacement (h) 0.48
Time in harvest team (h) 1.14 Total
Loaded displacement (h) 0.97 3.49
Time in plant(h) 0.90
Haulout cycle
Unloaded displacement (h) 0.07
Harvest (h) 0.33 Total
Loaded displacement (h) 0.07 0.53
Transfer (h) 0.06
Source: Elaborated by the authors.
Source: Elaborated by the authors.
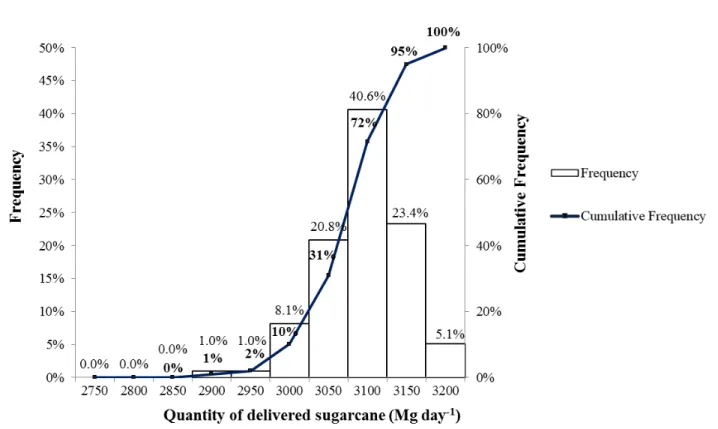
FIGURE 5. Average production and frequencies for scenario 3.
Sugarcane daily delivery of this scenario was above 3,000 Mg in 83% of days. The blade replacement alteration reduced combine maintenance percentage to 3.5% of useful time, which now corresponds only to non-planned corrective maintenance. This alteration enabled better use of the
combine, once average productivity reached 750 Mg day-1, as well as permanence time reduction of
Scenario 4
Scenario 4 adds to conditions of previous scenario the assumption that truck drivers should have their meals while waiting trucks being loaded by haulouts in field and during plant internal processes. This could be possible by hiring another employee to move trucks while drivers have their meals in the field or plant. The results are found on Table 9 and Figure 6.
TABLE 9. Results for scenario 4.
Parameters Description Value
Production Average daily quantity of delivered cane (Mg day-1) 3.073.1
Combine use
Usage percentage (%) 89.4
Idleness percentage (%) 7.1
Maintenance percentage (%) 3.5
Daily operational capacity (Mg day-1 combine-1) 768.3
Truck cycle Unloaded displacement (h) 0.48
Time in harvest team (h) 1.25 Total
Loaded displacement (h) 0.97 3.66
Time in plant(h) 0.96
Haulout cycle Unloaded displacement (h) 0.07
Harvest (h) 0.33 Total
Loaded displacement (h) 0.07 0.52
Transfer (h) 0.05
Source: Elaborated by the authors.
Source: Elaborated by the authors.
FIGURE 6. Average production and frequencies for scenario 4.
This scenario raised the average daily delivered sugarcane, where 98% of days reach the
reference of 3,000 Mg day-1. However, it was also verified that the total cycle of vehicles increased
Scenario evolution analysis
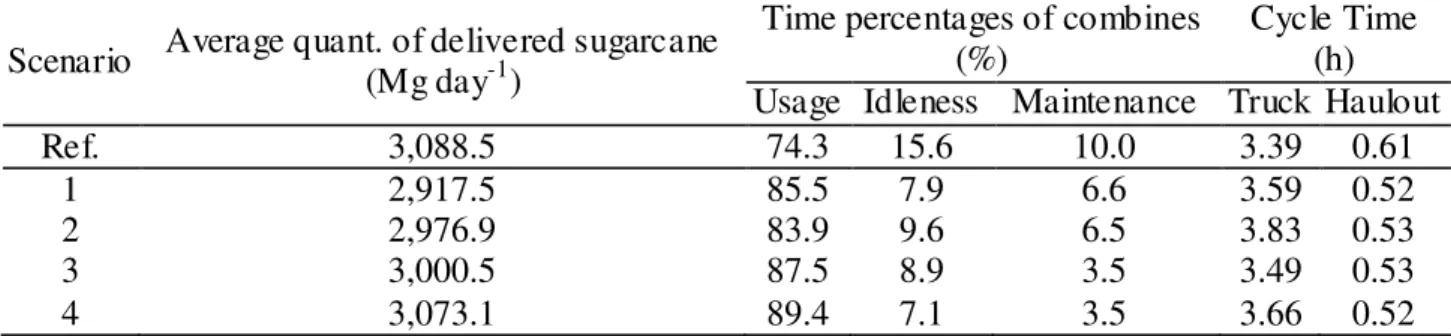
The results from each scenario were summarized on Table 10.
TABLE 10. Summary of results for 5 scenarios.
Scenario Average quant. of delivered sugarcane (Mg day-1)
Time percentages of combines (%)
Cycle Time (h) Usage Idleness Maintenance Truck Haulout
Ref. 3,088.5 74.3 15.6 10.0 3.39 0.61
1 2,917.5 85.5 7.9 6.6 3.59 0.52
2 2,976.9 83.9 9.6 6.5 3.83 0.53
3 3,000.5 87.5 8.9 3.5 3.49 0.53
4 3,073.1 89.4 7.1 3.5 3.66 0.52
Source: Elaborated by the authors.
It is observed that the average delivered sugarcane was kept stable in the scenarios, varying
from 2,917.5 and 3,088.5 Mg day-1 (5.9% amplitude), even with the reduction of one combine and
two haulouts, equipment of highest operational cost in the sector. According to SANTOS et al. (2014), in a reference scenario, a combine represented 75.5% of harvest and transshipment systems costs. Regarding combine costs, the maintenance and repair parcel corresponds to 40.4% and fuel cost to 34.3%.
Besides the drop of 5.5% of delivered sugarcane from reference scenario to scenario 1, the adopted actions related to maintenance and meal planning helped sustaining the delivered quantity of the reference scenario. Thereby, the proposed strategies advantageously maintained production, with low risk of destocking.
Differences in time percentages of usage, idleness and maintenance of presented combines were observed. As the scenarios progressed, maintenance rate varied from 10.0% to 3.5% of useful time, due to gradual transfer of maintenance procedures that can be planned for inactivity periods (meals and shift transitions stoppages). However, only the reduction of maintenance time in the useful journey does not guarantee increased operational capacity, once global performance of harvest system is limited to milling and transport system.
Regarding displacement cycles of haulouts and trucks, evolution of scenarios resulted in greater usage of combines and haulouts. Comparing the reference scenario with the remaining ones, there was a reduction in haulouts average cycle in approximately 0.09 h, which originally waited for combine maintenance during period available for production. The truck cycle is also diminished throughout 1, 2, and 3. In other words, as combines and haulouts present less time directed to maintenance procedures during the available time for production, greater is the equipment use efficiency.
In scenario 4, the meal alterations of trucks permitted increased average quantity of delivered sugarcane, with low risk of destocking, however, in order to be feasible, this scenario must accept hiring cost of additional labor.
CONCLUSIONS
The programming of subjected maintenances of sugarcane harvest and transport equipment benefits the whole CLT system. In the studied case, programming of refueling, lubrications and blade replacement enabled reduction of one combine and two haulouts, achieving the targeted sugarcane delivery, which proves interaction among CLT equipment, able to be represented by the simulation model. Similar studies of maintenance planning can be conducted in other sectors or in other sugarcane systems in order to evaluate strategies of greater use of production resources.
ACKNOWLEDGEMENTS
The authors thank CNPq for the research financial support.
REFERENCES
ABNT - ASSOCIAÇÃO BRASILEIRA DE NORMAS TÉCNICAS. NBR 5462: confiabilidade e
mantenabilidade. 1994.
AGUIAR, D. A.; RUDORFF, B. F. T.; ADAMI, M.; SHIMABUKURO, Y. E. Imagens de
sensoriamento remoto no monitoramento da colheita da cana-de-açúcar. Engenharia Agrícola.
Jaboticabal, v.29, n.3, p.440-451, jul./set. 2009.
BANKS, J. Handbook of simulation. New Jersey: John Wiley & Sons, 1998.
CAPAZ, R. S.; CARVALHO, V. S. B.; NOGUEIRA, L. A. H. Impact of mechanization and previous burning reduction on GHG emissions of sugarcane harvesting operations in Brazil.
Applied Energy, Amsterdam, v.102, p.220-228, fev. 2013.
CONAB - COMPANHIA NACIONAL DE ABASTECIMENTO. Acompanhamento da safra
brasileira de cana-de-açúcar - Quarto Levantamento. Brasília, 2014, v.1.
FILIPE, F. M. C. Gestão e organização da manutenção, de equipamento de conservação e
manutenção de infra-estruturas ferroviárias. Porto: Universidade do Porto, 2006.
FREITAS FILHO, P. J. Introdução à modelagem e simulação de sistemas: com aplicações em
Arena. 2. ed. Florianópolis: Visual Books, 2008.
HIGGINS, A.; ANTONY, G.; SANDELL, G.; DAVIES, I.; PRESTWIDGE, D.; ANDREW, B. A framework for integrating a complex harvesting and transport system for sugar production.
Agricultural Systems, Barking, v.82, p.99–115. 2004.
KARDEC, A.; NASCIF, J. Manutenção: função estratégica. 4. ed. Rio de Janeiro: Qualitymark,
2012.
KELTON, W. D.; SADOWSKI, R. P.; STURROCK, D. T. Simulation with Arena. 4th ed.
Boston: McGraw-Hill Higher Education, 2007.
MORAES, R. A.; ROCHA, J. V.; LAMPARELLI, R. A. C. Determination of total accumulated rainfall, global radiation, evapotranspiration and degree-days originated from the ECMWF model to
sugar cane crop. Engenharia Agrícola, Jaboticabal, v. 34, n. 2, p.322-331, mar./abr. 2014.
NARAYAN, V. Business performance and maintenance. Journal of Quality in Maintenance
Engineering, Bradford, v. 18, n.2, p. 183-195. 2012.
SANTOS, N. B.; SILVA, R. P.; GADANHA JÚNIOR, C. D. Economic analysis for sizing of
sugarcane (Saccharum spp.) mechanized harvesting. Engenharia Agrícola, Jaboticabal, v.34, n. 5,