358
The role of wetlands in the hydrological cycle
Andy Bullock
1and Mike Acreman
21Independent Consultant, Ledbury, Herefordshire, HR8 2DX, UK 2Centre for Ecology and Hydrology, Wallingford, Oxon. OX10 8BB, UK.
Email for corresponding author: man@ceh.ac.uk
Abstract
It is widely accepted that wetlands have a significant influence on the hydrological cycle. Wetlands have therefore become important elements
in water management policy at national, regional and international level. There are many examples where wetlands reduce floods, recharge
groundwater or augment low flows. Less recognised are the many examples where wetlands increase floods, act as a barrier to recharge, or
reduce low flows. This paper presents a database of 439 published statements on the water quantity functions of wetlands from 169 studies
worldwide. This establishes a benchmark of the aggregated knowledge of wetland influences upon downstream river flows and groundwater
aquifers. Emphasis is placed on hydrological functions relating to gross water balance, groundwater recharge, base flow and low flows, flood
response and river flow variability. The functional statements are structured according to wetland hydrological type and the manner in which
functional conclusions have been drawn. A synthesis of functional statements establishes the balance of scientific evidence for particular
hydrological measures. The evidence reveals strong concurrence for some hydrological measures for certain wetland types. For other
hydrological measures, there is diversity of functions for apparently similar wetlands. The balance of scientific evidence that emerges gives
only limited support to the generalised model of flood control, recharge promotion and flow maintenance by wetlands portrayed throughout
the 1990s as one component of the basis for wetland policy formulation. That support is confined largely to floodplain wetlands, while many
other wetland types perform alternate functions partly or fully. This paper provides the first step towards a more scientifically defensible
functional assessment system.
Keywords: wetlands, hydrological functions, flood reduction, groundwater recharge, low flows, evaporation
Introduction
Open any book on wetland conservation and it will
encourage the maintenance of wetlands partly because of
their role in the water cycle. Wetlands are said to perform
hydrological functions; to act like a sponge,
soaking-up water during wet periods and releasing it during dry
periods (eg. Bucher
et al.
, 1993). As Maltby (1991) reports
the case for wetland conservation is made in terms of
ecosystem functioning, which result in a wide range of
values including groundwater recharge and discharge, flood
flow alteration, sediment stabilization, water quality ...
Since wetlands cover around 6% of the land surface of the
earth (OECD, 1996) and many exist in the upstream parts
of river catchments, the total downstream area over which
a hydrological influence may be exerted is substantial. Yet
the hydrological processes and behaviour of wetland
ecosystems has certainly lacked the scientific integration
received by other land surface systems, such as forests.
Kusler and Riexinger (1985) reported that the science base
and efforts to assimilate existing studies are still inadequate
with regard to some functions, particularly hydrology.
The basic references on the hydrological functions of
wetlands are summaries of studies collated in the USA in
the 1980s (Adamus and Stockwell, 1983; Bardecki, 1984;
Carter, 1986). These summaries have been used by
organisations, such as IUCN-The World Conservation Union
(Dugan, 1990), Wetlands International (Davis and Claridge,
1993) and the Ramsar Convention on Wetlands of
International Importance (Davis, 1993). They have
influenced international wetland policy (OECD, 1996) and
its uptake at the national (eg. Zimbabwe and Uganda), and
continental levels e.g. Europe (CEC, 1995) and Asia (Howe
et al.
, 1992).
359
to ensure the integrity of ecosystems as part of integrated
water resources management. Also receiving high
prominence was the use of water to meet basic human needs
and economic development. Thus, it is essential to
re-examine, periodically, the conclusions of scientific studies
on wetland functions. This ensures that policy at all levels
is underpinned by a consensus of sound scientific opinion.
The scientific literature contains a range of studies that
describe the water quantity functions of individual or groups
of wetlands. They represent a substantial accumulation of
hydrological knowledge. The majority of these papers
supports the notion that wetlands have a significant influence
on the hydrological cycle. However, many recognise that
it is difficult to make definitive statements regarding the
role of various types of wetlands in runoff production or
storm water detention (Carter, 1986). Furthermore, some
studies have produced evidence that contradicts previous
widely accepted knowledge. For example, the classic
hydrological studies of Hewlett and Hibbert (1967)
identified headwater wetlands along river margins as flood
generating areas. Burt (1995) concluded that most
wetlands make very poor aquifers; ... accordingly, they yield
little base flow, but in contrast, generate large quantities of
flood runoff. Far from regulating river flow, wetlands usually
provide a very flashy runoff regime.
This paper has three objectives: first, to present an ordered
database of published papers on hydrological functions of
wetlands; second, to provide a collation of scientific
evidence among hydrological measures and wetland type;
third, to stimulate debate and further research. The focus of
this paper is limited to water quantity functions, including
impacts on water resource availability, groundwater
replenishment and flood control. It does not consider other
aspects of wetlands, such as water quality or biodiversity,
which are part of a wider case for wetland conservation.
Creating a literature-based review of
water quantity functions
With the objective of creating a comprehensive and
consistent database of past studies, a literature review of
water quantity functions was undertaken by keyword
searches on the major databases of abstracts, and by tracking
citations to earlier and related studies. Consequently, the
database is drawn from 169 publications that report the
results of scientific study that quantify hydrological
functions of wetlands. Papers that report other authors
findings or give only qualitative descriptions of wetland
process are not included.
Certain guidelines were followed, namely that:
l
the review is restricted to freshwater wetlands,
excluding lakes;
l
conclusions of wetland function must be supported by
hydrological data and not based on the original authors
opinion alone;
l
double-accounting is avoided, whereby repetition of
conclusions for an individual wetland in successive
publications is not duplicated;
l
unsubstantiated generic statements, such as wetlands
reduce flooding, are not included.
Consistency is ensured by extracting common elements from
the diverse sources. Important information is maintained in
the detail of the particular hydrological function, wetland
type and the manner of conclusion. The approach adopted
was to complete the following general statement (where
bracketed and underlined phrases relate to elements in
Annex 1) for each study:
(
Author(s)
) undertook a study in a given location
(
country
, or US State/Canadian Province or Territories) of
a particular hydrological type of wetland (
wetland type
),
also referred to by a more general or locally-specific wetland
term (
local term
). Based on results from a particular type
of study (
categorisation of wetland study
) and drawing
inferences in a particular manner (
basis of inference)
, the
authors conclude (
page number
) that the wetland performs
a particular function with respect to a specific hydrological
measure (
hydrological measure
), as can be summarised
by a functional statement (
summary functional statement
)
and a summary function (
summary of wetland water
quantity function
).
There are, therefore, ten elements extracted from each
publication, each entered into the database. Explanation of
each of these elements is expanded upon below. Because
the format of the review is tabular, abbreviated codes are
adopted for some elements for purposes of brevity.
Author(s)
: Citation to original source.
Country, or US State/Canadian Province or Territories
:
Location of wetland study.
360
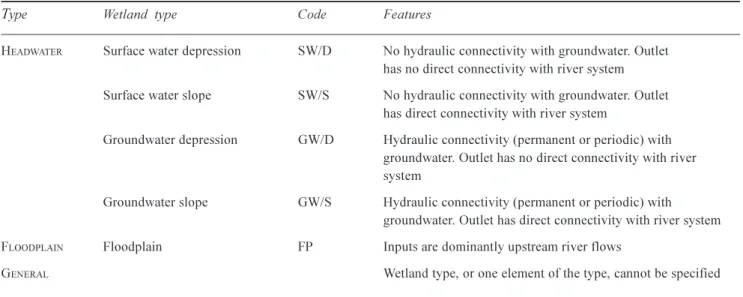
between headwater and floodplain; the distinction is that
headwater wetlands are not fed by significant stream sources.
Further subdivision applies only to headwater types. The
connectivity with the groundwater system distinguishes
groundwater types that are in hydraulic connectivity with
the groundwater system for all, or part of, the time, from
surface water types, which are not. Connectivity with the
downstream channel network distinguishes slope types,
which are characterised by an outlet to the downstream river
system, from depression types, which are not. This
categorisation deviates from that of Novitski and Adamus
and Stockwell by including a floodplain type and in the
surfaceslopetype which, in that scheme, categorises
lakeshore wetlands. Therefore, the two schemes are similar
but are not directly comparable. An unspecified category is
added, and applied where the hydrological context of the
wetland cannot be discerned.
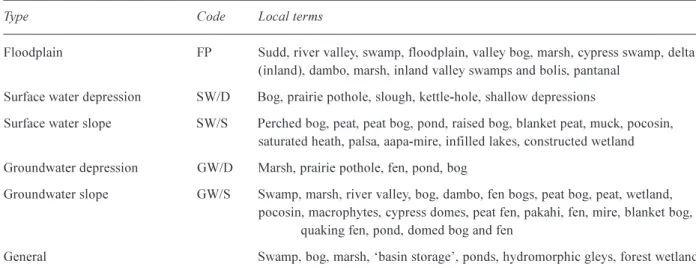
Local term
: Many local terms are applied to wetlands,
including such general anglicised terms as marsh, swamp,
bog etc, and regionally specific terms such as dambo,
pakihi, pocosin. There is no known means of providing a
direct association between local terms and hydrological type
in a fully inclusive manner.
Categorisation of wetland study
: Wetland studies have
adopted a number of experimental frameworks, ranging
from intensive long-term monitoring of the water balance
of wetland and non-wetland at the most complex extreme,
to analyses based on single flood event hydrographs. Table 2
Table 2.
Categorisation of methodological approach to wetland studies
Category of wetland study
Code
Conceptual catchment model
CCM
Calibration and application of a conceptual catchment model
Water balance
WB
Quantification of the terms of the catchment and/or wetland water balance
Long-term hydrograph
LTH
Analysis of the characteristics of long time series of river flows
Single-event hydrograph SEH
Analysis of the characteristics of a single river flow event
Trend analysis in time series
TS
Analysis of trends in hydrological time series (associated with detecting the
impacts of drainage)
Component process
COMP
aInvestigation of an individual water balance component or hydrological
process. (See Table 4 for definitions of a)
Chemical balance
CHEM
Quantification of a chemical process or chemical balance
Table 1.
Categorisation of wetland type by hydrological features
T
ype
Wetland type
Code
Features
H
EADWATERSurface water depression
SW/D
No hydraulic connectivity with groundwater. Outlet
has no direct connectivity with river system
Surface water slope
SW/S
No hydraulic connectivity with groundwater. Outlet
has direct connectivity with river system
Groundwater depression
GW/D
Hydraulic connectivity (permanent or periodic) with
groundwater. Outlet has no direct connectivity with river
system
Groundwater slope
GW/S
Hydraulic connectivity (permanent or periodic) with
groundwater. Outlet has direct connectivity with river system
F
LOODPLAINFloodplain
FP
Inputs are dominantly upstream river flows
presents categories of methodological approach with
abbreviated codes for brevity in the tabular review.
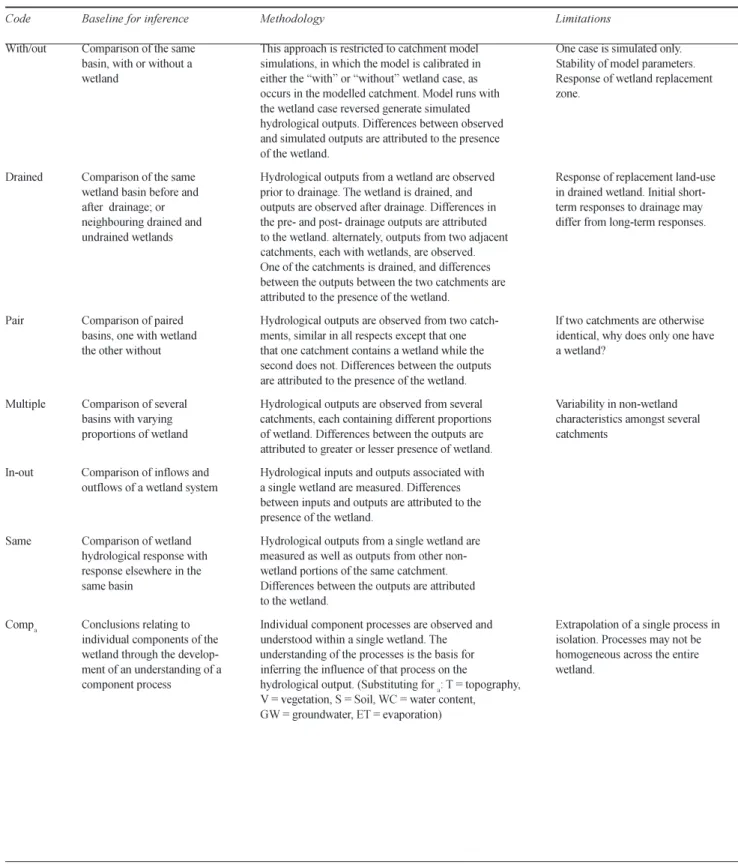
Basis of inference
: Many studies draw conclusions of the
kind that, for example, wetlands reduce floods or augment
dry season river flows. This kind of conclusion, when taken
out of context, leaves unanswered the basis for that
conclusion, notably that the wetland reduces (or increases)
river flows compared with what? Table 3 presents a set
of the comparative scenarios used amongst the various
Table 3
. Basis for inference of wetland function
Code
Baseline for inference
Methodology
Limitations
With/out
Comparison of the same
This approach is restricted to catchment model
One case is simulated only.
basin, with or without a
simulations, in which the model is calibrated in
Stability of model parameters.
wetland
either the with or without wetland case, as
Response of wetland replacement
occurs in the modelled catchment. Model runs with
zone.
the wetland case reversed generate simulated
hydrological outputs. Differences between observed
and simulated outputs are attributed to the presence
of the wetland.
Drained
Comparison of the same
Hydrological outputs from a wetland are observed
Response of replacement land-use
wetland basin before and
prior to drainage. The wetland is drained, and
in drained wetland. Initial
short-after drainage; or
outputs are observed after drainage. Differences in
term responses to drainage may
neighbouring drained and
the pre- and post- drainage outputs are attributed
differ from long-term responses.
undrained wetlands
to the wetland. alternately, outputs from two adjacent
catchments, each with wetlands, are observed.
One of the catchments is drained, and differences
between the outputs between the two catchments are
attributed to the presence of the wetland.
Pair
Comparison of paired
Hydrological outputs are observed from two catch-
If two catchments are otherwise
basins, one with wetland
ments, similar in all respects except that one
identical, why does only one have
the other without
that one catchment contains a wetland while the
a wetland?
second does not. Differences between the outputs
are attributed to the presence of the wetland.
Multiple
Comparison of several
Hydrological outputs are observed from several
Variability in non-wetland
basins with varying
catchments, each containing different proportions
characteristics amongst several
proportions of wetland
of wetland. Differences between the outputs are
catchments
attributed to greater or lesser presence of wetland.
In-out
Comparison of inflows and
Hydrological inputs and outputs associated with
outflows of a wetland system
a single wetland are measured. Differences
between inputs and outputs are attributed to the
presence of the wetland.
Same
Comparison of wetland
Hydrological outputs from a single wetland are
hydrological response with
measured as well as outputs from other
non-response elsewhere in the
wetland portions of the same catchment.
same basin
Differences between the outputs are attributed
to the wetland.
Comp
aConclusions relating to
Individual component processes are observed and
Extrapolation of a single process in
individual components of the
understood within a single wetland. The
isolation. Processes may not be
wetland through the develop-
understanding of the processes is the basis for
homogeneous across the entire
ment of an understanding of a
inferring the influence of that process on the
wetland.
publications as the basis for inferring wetland function. Each
basis has some limitations, and these are summarised. Again,
abbreviated codes are set out.
Page number
: Page number in the original publication on
which the conclusion is drawn.
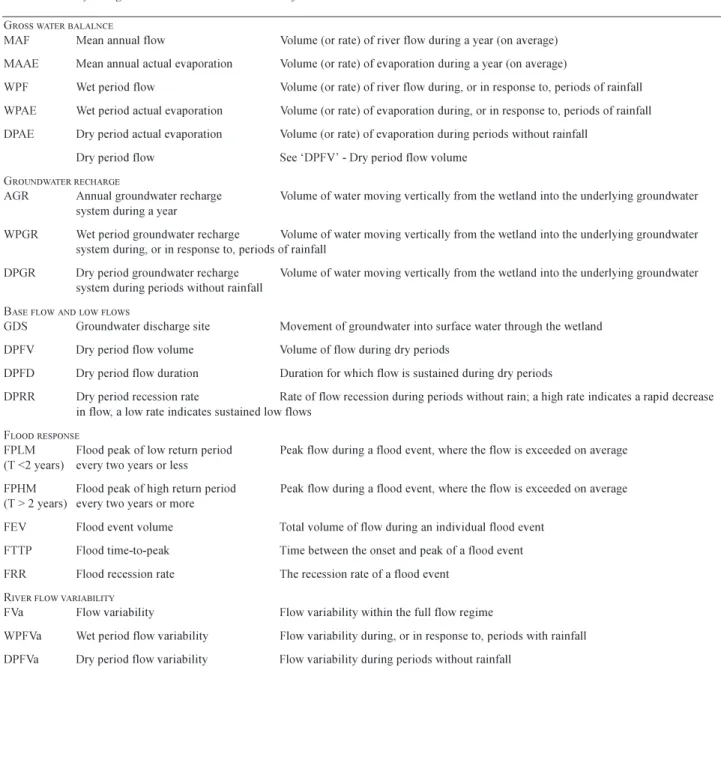
Hydrological measure
: There are many different measures
in hydrology to describe and define aspects of the flow
regime. While non-hydrologists might refer generically to
floods, the hydrologist would be concerned with measures
such as the magnitude of the peak flow during the flood
event, the volume of runoff contained in the event, and the
time-to-peak. Published studies in wetland hydrology are
not consistent in their attention to different measures; it is
possible to find one study analysing the return period of
flood peaks extracted from a 20 or 30 year flow record, and
another analysing the flood volume of a single event, with
both drawing conclusions on wetland influences on floods.
Table 4 presents and defines different hydrological measures
within five broad groupings of hydrological response,
namely; gross water balance, groundwater recharge, base
flow and low flows, flood response and river flow variability,
including some seasonal variations.
Summary of wetland water quantity function
:
Conclusions regarding water quantity functions extracted
directly, or in paraphrased form, from the original text are
presented.
Summary functional statement for hydrological
measure
: Functional statements of the form wetlands
increase low flows are expressed as the sign of the wetland
influence upon the hydrological measure; thus + indicates
an increasing influence upon the hydrological measure, -
indicates a reducing influence and . represents a neutral
influence (i.e. no significant influence exists or can be
detected). In the case of groundwater recharge and
groundwater discharge sites, there is interest in the
conservation-based literature whether either of these
functions is, or is not, present in a wetland. Therefore, =
indicates that this function is present and x indicates that
it is not.
Global data base of wetland water
quantity functions
The first objective of this paper is to redress the deficiency
in availability of hydrological information on wetland
functions by providing an accessible and consistent database
of past studies. Annex 1 presents the product of the
application of the global review. The database is composed
of 169 different published studies with 440 functional
statements, representing the fullest sample of studies that
could be traced, conforming to the principles adopted. It
would not be claimed that the sample is exhaustive, but it is
considered to be comprehensive.
BALANCE OF SCIENTIFIC EVIDENCE FOR
PARTICULAR HYDROLOGICAL MEASURES
Table 5(a to e) collates the number of functional statements
for each wetland type for the five principal groups of water
quantity measures. For example, interpreting Table 5a for
floodplain-type wetlands, two studies conclude that an
example of this wetland type increases mean annual flow,
two studies concludes that no significant influence can be
detected and eight studies conclude that examples of this
wetland type reduce mean annual flow. Total numbers of
functional statements are presented across all hydrological
measures and all wetland types.
Analysis of the balance of scientific evidence draws on
comparison of the number of papers that conclude a
particular function. This is seen to be an important step and
a precursor to more detailed exploration of the evidence for
particular measures for specific wetland types. The results
cannot yet be considered to reflect a balance of scientific
opinion, because there has been no inter-comparison
amongst the different studies.
There are some cautionary perspectives and some
limitations on the comparison that must be stated.
(1) The number of papers reporting a particular influence
on the water cycle does not necessarily indicate the total
picture. Some hydrological functions have been studied
more than others.
(2) The number of functional statements cannot be
interpreted as the number of wetlands performing a
function; for example, a functional statement based on
multiple catchments commonly involves a large number
of individual wetlands.
(3) There is no certainty that the 169 publications represent
all past studies of wetlands Although not exhaustive,
the sampling method has been applied independently
of any initial bias associated with policy interests.
However, it cannot be discounted that there is potential
bias in the wetlands that were selected for study by the
original authors.
363
Table 4.
Hydrological measures and their definition
CODE
Hydrological measure
Definition
G
ROSSWATERBALALNCEMAF
Mean annual flow
Volume (or rate) of river flow during a year (on average)
MAAE
Mean annual actual evaporation
Volume (or rate) of evaporation during a year (on average)
WPF
Wet period flow
Volume (or rate) of river flow during, or in response to, periods of rainfall
WPAE
Wet period actual evaporation
Volume (or rate) of evaporation during, or in response to, periods of rainfall
DPAE
Dry period actual evaporation
Volume (or rate) of evaporation during periods without rainfall
Dry period flow
See DPFV - Dry period flow volume
G
ROUNDWATERRECHARGEAGR
Annual groundwater recharge
Volume of water moving vertically from the wetland into the underlying groundwater
system during a year
WPGR
Wet period groundwater recharge
Volume of water moving vertically from the wetland into the underlying groundwater
system during, or in response to, periods of rainfall
DPGR
Dry period groundwater recharge
Volume of water moving vertically from the wetland into the underlying groundwater
system during periods without rainfall
B
ASEFLOWANDLOWFLOWSGDS
Groundwater discharge site
Movement of groundwater into surface water through the wetland
DPFV
Dry period flow volume
Volume of flow during dry periods
DPFD
Dry period flow duration
Duration for which flow is sustained during dry periods
DPRR
Dry period recession rate
Rate of flow recession during periods without rain; a high rate indicates a rapid decrease
in flow, a low rate indicates sustained low flows
F
LOODRESPONSEFPLM
Flood peak of low return period
Peak flow during a flood event, where the flow is exceeded on average
(T <2 years)
every two years or less
FPHM
Flood peak of high return period
Peak flow during a flood event, where the flow is exceeded on average
(T > 2 years) every two years or more
FEV
Flood event volume
Total volume of flow during an individual flood event
FTTP
Flood time-to-peak
Time between the onset and peak of a flood event
FRR
Flood recession rate
The recession rate of a flood event
R
IVERFLOWVARIABILITYFVa
Flow variability
Flow variability within the full flow regime
WPFVa
Wet period flow variability
Flow variability during, or in response to, periods with rainfall
DPFVa
Dry period flow variability
Flow variability during periods without rainfall
the focus of studies on North America. Consequently,
one cannot necessarily transfer the results of this study
to the general grouping of worldwide wetlands.
(5) Conclusions are presented as stated in the original paper;
no attempt is made to evaluate or uphold the conclusions
that are drawn. Further work in the critical evaluation
of past studies would represent a valuable contribution
to the science of wetland hydrology.
Table 5
68
a Gross water balance
FP
SW/D
SW/S
GW/D
GW/S
General
Total
Mean annual flow
MAF
+
2
2
4
-
8
1
5
1
7
1
23
.
2
1
4
8
1
16
Mean annual actual evaporation
MAAE
+
12
1
4
1
6
1
25
-
1
2
3
.
1
1
1
3
Wet period flow
WPF
+
1
3
5
6
15
-
1
2
2
5
.
1
1
1
1
4
Wet period actual evaporation
WPAE
+
1
1
-
1
1
2
.
0
Dry period actual evaporation
DPAE
+
4
3
15
22
-
1
1
.
0
increased flow or reduced evaporation
3
0
4
1
11
6
25
reduced flow or increased evaporation
25
2
12
2
30
5
76
not increased or reduced
4
3
5
1
9
1
23
b. Groundwater recharge
FP
SW/D
SW/S
GW/D
GW/S
General
Total
Annual groundwater recharge
AGR
+
1
1
2
1
5
-
1
2
4
7
.
2
1
1
4
X
1
5
1
7
2
16
=
8
4
2
4
6
2
26
Wet period groundwater recharge WPGR
+
1
1
-
0
.
0
X
1
1
=
1
1
1
1
4
Dry period groundwater recharge DPGR
+
0
-
1
1
2
.
0
X
1
1
=
1
1
2
increased recharge
1
1
0
1
2
1
6
decreased recharge
1
1
3
0
0
4
9
not increased or decreased
0
0
2
1
1
0
4
recharge does not occur
1
2
5
1
7
2
18
recharge occurs
9
6
3
5
7
2
32
c. Base flow and low flow
FP
SW/D
SW/S
GW/D
GW/S
General
Total
Groundwater discharge site
GDS
=
2
4
3
18
27
X
2
2
1
5
Dry period flow volume
DPFV
+
3
1
1
6
3
14
-
5
11
1
22
8
47
.
1
4
1
2
2
10
Dry period flow duration
DPFD
+
0
-
1
1
2
.
0
Dry period recession rate
DPRR
+
1
1
2
-
0
.
0
low flows sustained
3
1
1
0
7
4
16
low flows diminished
5
0
12
1
23
8
49
365
The association between hydrological types and local terms
is presented in Table 6. It is immediately evident that there
is no strong linkage between hydrological categorisation as
applied in this paper and the use of local or ecological
wetland terms; the terms peat, bog, marsh (and several
others) recur in different hydrological types. Thus, grouping
by hydrological type is seen as more meaningful than
grouping by local terms. For example, the term bog can
be found in all five hydrological types.
From a hydrological perspective, the content of the
database may be perceived as limited due to its emphasis
on functions rather than hydrological processes given
that the concept of functions is not well-established within
the hydrological community. However, while more process
information can be extracted from the set of publications,
the target of this paper is the use of functional generalisations
to represent wetland hydrology to the wetland management
and policy arena. Clearly, there is a strong case for bringing
hydrological processes and function closer together.
Geographically, the dataset is dominated by 92 studies
from North America (including 23 different U.S. States and
six Canadian Provinces/Territories), with additionally 33
studies from 14 countries in Europe, 27 studies from 10
countries in Africa and 17 from elsewhere (including New
Zealand (2), Australia, Brazil (3), India, Indonesia and
Malaysia). This distribution reflects the substantial
investment in scientific enquiry in North America compared
with other regions of the world and a relative dearth of
accessible information relating to Asian and South American
wetland hydrology.
The term wetland embraces a wide variety of land types,
from springs to large inland deltas. As a result, a lack of
consistency in the impact of wetlands on the water cycle
was anticipated. Unique conclusions concerning any specific
hydrological function cannot be drawn for all wetlands.
Taking flow variability as a single hydrological measure,
for example, there are 28 statements with good geographical
coverage, of which 10 show that variability is increased by
wetlands, 11 that variability is reduced, and 6 that wetland
influence is neutral. When wetlands are sub-divided into
d. Flood response
FP
SW/D
SW/S
GW/D
GW/S
General
Total
Floodpeak low magnitude (T>5 yrs)