Performance of yield and yield contributing...
463
PERFORMANCE OF YIELD AND YIELD CONTRIBUTING
CHARACTERISTICS OF BC
2F
3POPULATION WITH
ADDITION OF BLAST RESISTANT GENE
Desempenho produtivo e características de produção de populações de BC2F3 com gene de resistência a brunose
Muhammad Mahmudul Hasan1, Mohd Rafii Yusop2, Mohd Razi Ismail1, Maziah Mahmood3, Harun Abdul Rahim4, Mohammad Abdul Latif5
ABSTRACT
The study was carried out in the University Putra Malaysia (UPM) Rice Research Centre to evaluate the yield performance of newly developed selected blast resistant plants of BC2F3 generations derived from a cross between MR263, a high yielding rice variety but blast susceptible and Pongsu Seribu 1, donor with blast resistant (Pi-7(t) and Pi-d (t)1, Pir2-3(t) genes and qLN2 QTL), Malaysian local variety. On the basis of assessed traits, the plants 12, 6, 7, 5, 21, 22, 5, 26, 11, 8, 10, 13 and 15 had the higher yield, blast resistant and good morphological traits. More than 70% heritability was found in days to maturity, plant height, tiller numbers per hill, and panicle per hill, 80% heritability was found in filled grain and yield per hill and more than 90% heritability was found in grain length, grain width and seed weight. Cluster analysis based on the traits grouped 30 plants along with MR263 into seven clusters. According to PCA, the first four principal components account for about 69.3% total variation for all measured traits and exhibited high correlation among the characteristics analyzed.
Index terms: Yield; rice; fungi resistance.
RESUMO
O estudo foi realizado no Centro de Arroz da Universidade Putra Malásia (UPM), para avaliar o desempenho produtivo de plantas resistentes a brunose do arroz recém desenvolvidas de BC2F3 gerações derivadas do cruzamento entre MR263, uma variedade de arroz de alta produtividade, embora suscetível a brunose e Ponsu Seribu 1, doador com resistência a brunose [Pi- 7 (t) e Pi-d (t) 1, Pir2-3 (t) genes e qLN2 QTL], e também uma variedade local da Malásia. Com base nas características avaliadas, as plantas 12, 6, 7, 5, 21, 22, 5, 26, 11, 8, 10, 13 e 15 apresentaram o maior rendimento, resistência a brunose e boas características morfológicas. Mais de 70% de herdabilidade foram encontradas em dias para maturação, altura da planta, número
de perfilhos por cova, e panículas por cova, 80% de herdabilidade foram encontradas em grãos e rendimento por colina e mais
de 90% de herdabilidade foi observada em grãos, largura de grãos e peso das sementes. A análise de agrupamento com base nos traços agruparam 30 plantas, juntamente com MR263 em sete clusters. De acordo com o PCA, os quatro primeiros componentes principais responsáveis por cerca de 69,3% da variação total para todas as características medidas apresentaram alta correlação entre as características analisadas.
Termos para indexação: Rendimento; arroz; resistência fúngica.
1University Putra Malaysia – Faculty of Agriculture – Department of Crop Science – 43400 – UPM Serdang – Selangor – Malaysia 2University Putra Malaysia – Institute of Tropical Agriculture – 43400 – UPM Serdang – Selangor – Malaysia – [email protected]
3University Putra Malaysia – Deparment of Biochemistry – Faculty of Biotechnology and Biomolecular Sciences – 43400 – UPM Serdang – Selangor – Malaysia 4Malaysian Nuclear Agency – Agrotechnology and Bioscience Division – Bangi – 43000 Kajang – Selangor – Malaysia
5Bangladesh Rice Research Institute – Gazipur-1701 – Bangladesh
Received in december 1, 2014 and approved in may 22, 2015 INTRODUCTION
Rice is one of the most important staple food crops of the world and over half of the global population depends on it for their feed (Sasaki, 2005). The world population will grow up to 8.5 billion till 2030 and 9 billion in 2050 for that to feed this growing population about 40% more rice will be required (Singh et al., 2013). But unfortunately, its production is constrained by considerable number of diseases caused by various pathogens which include
bacteria, fungi, viruses and nematodes. The fungus
Pyricularia oryzae Cavara [synonym Pyricularia grisea
Sacc. the anamorph of Magnaporthe grisea (Herbert) Yaegashi and Udagawa] causes blast disease of rice is one of the most destructive and wide spread disease (Jia et al., 2000; Latif et al., 2011a; Singh et al., 2012; Tanweer
et al., 2015). Blast disease produces significant yield loss
the use of resistant cultivars which has proved to be most economical and environment friendly (Castano et al., 1990; Haq et al., 2002; Chandra et al., 2007; Latif et al., 2011b). But, with the appearance of new virulent races of the pathogen, this resistant can break down/over-come. So in this purpose we developed blast resistant lines through marker assisted backcrossing. The present study aimed to evaluate the agronomic characteristics and yield contributing characters of selected homozygous blast resistant plants of BC2F3 population derived from cross between MR263, a high yielding rice variety and donor, Pongsu Seribu 1, Malaysian local variety.
Plant breeders still use the approach although this is an old method. Morphological characters are important for the preliminary assessment of genotypes (Hien et al., 2007). In order to evaluate variation among genotypes, grain morphology was also taken into account as vital factor (Mathure et al., 2011). Morphological and physiological characterization is a traditional and general approach for the determination of genetic diversity as well as variation (Hien et al., 2007). However, they play crucial role in the selection and utilization of proper parents in breeding program. Moreover, yield and yield contributing characters are very helpful through which overall performance of genotypes could be determined. In this study, 30 selected homozygous blast resistant lines with MR263 were assessed and characterized for morphological traits with a view to gather knowledge for the further utilization. The present study deals with the following objectives: (i) to study genetic variation among blast resistant lines by quantitative traits and (ii) to estimate broad sense heritability, genetic advance.
MATERIAL AND METHODS
Plant materials
The experiment was conducted at UPM Rice Research Center, Serdang, Selangor, Malaysia. Newly developed 30 homozygous blast resistant plants out of 400 were selected from BC2F2 population derived from cross between MR263, a high yielding rice variety but blast susceptible and donor, Pongsu Seribu 1, Malaysian blast resistant variety. These 30 homozygous blast resistant plants were carried out to regenerate BC2F3 for the evaluation of yield and yield contributing characters. Breeding strategy
Pongsu Seribu 1 having Pi-7(t) and Pi-d (t)1,
Pir2-3(t) genes and qLN2 QTL were used as a donor
for blast resistance. This donor was crossed with the recurrent parent MR263, a popular rice variety with elite agronomic traits and high yielding but susceptible to blast disease. The lines derived from cross between MR263 and Pongsu Seribu 1, were named as BR-3, BR-4, BR-13 and MR263-BR-26. The carrying resistant 22 F1 out of 100 plants were backcrossed with MR263 to produce the BC1F1 seeds. 42 heterozygous plants out of 200 were selected using the gene linked markers RM5961 and RM263 to identify the Pi-7(t) and Pi-d (t)1, Pir2-3(t) genes
and qLN2 QTL in BC1F1 generation as foreground
selection. The four plants carrying resistance gene with highest resembling to recurrent parent were backcrossed to produce BC2F1 seeds independently in each of the backcrosses. 35 heterozygous plants out of 300 were selected using the same link markers (RM5961 and RM263). Foreground and phenotypic selections were carried out to select four best plants from each backcross to generate BC2F3 progenies following pedigree selection. The total scheme of work was shown in Figure 1.
Experimental design and management practices
From each plants, seeds were grown in plastic pots (28 cm x 25 cm) with randomized complete block design (RCBD) with 5 replications. MR263 variety was used as a control as a high yielding variety. We would like to mention here that only one seedling was transplanted in each pot. Management practices were done by Malaysian Agricultural Research and Development Institute (MARDI) recommended manual.
Molecular marker based screening of homozygous seedlings
Genomic DNA extraction
To extract genomic DNA, young and fresh leaves were collected of 4-week-old individual plants using the CTAB (Cetyltrimethylammonium bromide)
method modified from Doyle and Doyle (1990) and
65 ºC for one hour (60 minutes) by gently shaking the tubes at 10-minutes interval to mix appropriately. Finally the whole samples were centrifuged at 13,000 rpm for 5 minutes to precipitate solid parts of the cell. Afterwards, the total amount of supernatant was transferred into a new 2 ml eppendorf tube. Then equal volume of chloroform:isoamyl alcohol (24:1, v/v) was added in each sample and the tube was gently inverted to homogenize the mixture and centrifuged at 13,000 rpm for 5 minutes to precipitate polysaccharides. The upper phase was then transferred into a new 2 ml eppendorf tube excluding green and white lower phase and again incorporated with 600 µl cold isopropanol and mixed gently by inverting the tube at least 50 times. All samples were then incubated at -200C for 30 minutes. After that it was centrifuged for
10 minutes at 13,000 rpm to get DNA pellet. Carefully pipetted off the supernatant without losing the pellet and let the pellet air-dried. The DNA pellet was then washed
and dry out 1-2 times adding 600 µl of 4 ºC 75% ethanol
until white DNA fiber appeared. Finally 50 µl of TE
buffer (10 mM tris-HCl pH 8.0, 1 mM EDTA pH 8.0) and 1 µl of RNase (DNase free) were added and mixed
by finger overtaxing to dissolve DNA completely and
incubated at 37 ºC for 1 hour to break down RNA if any was present in the isolated DNA.
DNA identification and quantification
One µl of each DNA sample was put on NanoDrop spectrophotometry (ND-1000, NanoDrop Technologies Inc., Wilmington, DE, USA) and relative purity with concentration of the extracted DNA were estimated from
the computer displayed data value. The final concentration
of each DNA sample was diluted with 1xTE buffer (10 mM Tris-HCl, pH 8.0, 1 mM EDTA, pH 8.0) to get required concentration and maintained in a refrigerator of -20 °C for PCR analysis.
Polymerase chain reaction (PCR)
Genotype data was obtained by analyzing DNA
with SSR markers using 15 μL PCR reactions containing
1 µl DNA 2 µl of forward and reverse primer, 7.4 µl Master mix and 4.6 µl of water. Using an Eppendorf single or dual 96-well thermal cycler. After initial denaturation for 5 min at 94 °C, each cycle comprised 1 min denaturation at 94 °C, 1 min annealing at 55 °C, and 2 min extension at 72 °C with
a final extension for 5 min at 72 °C at the end of 35 cycles.
The PCR products were loaded to well and were analyzed by electrophoresis on 3% metaphor agarose gel using horizontal
Thermo Scientific Gel Electrophoresis tank. The gels were
documented using Alpha Imager 1220 (Alpha Innotech, CA, USA). Microsatellite or Simple sequence repeat (SSR) markers were used for the rice lines selection (Temnykh et al., 2001; McCouch et al., 2002; Ashkani et al., 2011). Data collection
Data were recorded on 10 quantitative characters of vegetative growth, grain qualities, yield and its attributes
viz. days to maturity, plant height, number of tillers per
hill, panicles per hill, panicle length, percentage of filled
grain, grain length, grain width, yield per hill and 100-seed weight were measured.
Statistical analysis
The analysis of variance was done with the help of SAS 9.2 (2013) and the mean differences were adjudged
by Tukey test at 5% level of significant.
Genetic parameters were estimated to determine genetic variation among genotypes and to assess genetic and environmental effects on various traits. Some formulas were given in order to calculate genetic parameters (Johnson et al., 1955).
Cluster and principal component analysis
Multivariate statistical analysis, such as cluster and PCA were used to assess the genetic diversity of quantitative traits using unweighted pair group method with arithmetic means (UPGMA) following the methods described by Mazid et al. (2013).
In this experiment, data were analyzed based on Euclidian distance method, Dice’s and Jaccard’s similarity
coefficient using NTSYS-pc software (version 2.1). In
order to determine genetic relationships among the rice genotypes the UPGMA algorithm and SAHN clustering were applied. The PCA of 41 rice accessions was calculated by EIGEN and PROJ modules of NTSYS-pc and Minitab software (version 15).
RESULTS AND DISCUSSION
Results have been presented in Tables 1 to 5 and
Figures 2 to 7. Since interaction effect was not significant
only main effect has been explained.
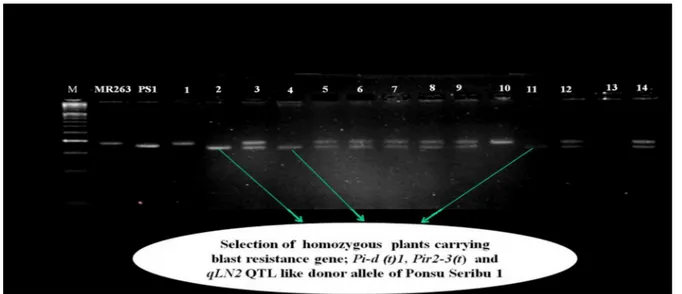
Molecular Marker based homozygous plants selection
Newly developed 30 homozygous blast resistant plants out of 400 were selected from BC2F2 population derived from cross between MR263, a high yielding rice variety but blast susceptible and donor, Pongsu Seribu 1, blast resistant, Malaysian local variety. These 30
homozygous blast resistant plants were also confirmed
using gene linked markers (RM263 and RM5961) at BC2F3 (Figures 2 to 5).
Many blast-resistant varieties have been developed through conventional and molecular breeding. However, conventional breeding requires approximately ten years or more to develop a new variety from beginning to release. Many blast resistance genes (Pi) have been successfully introgressed through marker-assisted backcrossing (MABC). For example, the Pusa1602 (PRR78+Piz5) and Pusa1603 (PRR78+Piz54) lines have recently been developed through the incorporation of the blast resistance genes Piz-5 and Pi54 that were derived from the donor lines C101A51 and Tetep into the background of PRR78 (highly blast susceptible) through an MABC breeding strategy (Singh et al., 2012; Hasan et al., 2015). The leaf blast resistance line D521, the neck blast resistance line D524 and bacterial blight resistance have been developed through the introgression of the leaf resistance gene Pi1; the neck blast resistance gene Pi2 derived from the donor BL122 into an elite, early-maturing maintainer line of hybrid rice disease susceptible to blast; and Ronfeng B hybrid rice through marker-assisted backcross breeding programs, respectively (Fu et al., 2012). In this study, our objective was to introgress blast resistant Pi genes (Pi-7(t) and Pi-d (t)1, Pir2-3(t) genes and qLN2 QTL) from Pongsu Seribu 1, into the background of a popular and mega Malaysian rice variety, MR263 susceptible to blast through MABC and also to evaluate the agronomic performance of improved genotypes.
Analysis of agronomical recorded data
Days to maturity
Analysis results revealed significant variation in
(103 days) respectively, and the lowest days to maturity (97 days) was observed in plant number 3 (Table 1). The remaining progenies were observed less days to maturity
than MR263 (103 days). Days to maturity in plant number 6 (~103 days) was observed very similar to MR263 (103 days) Table 1.
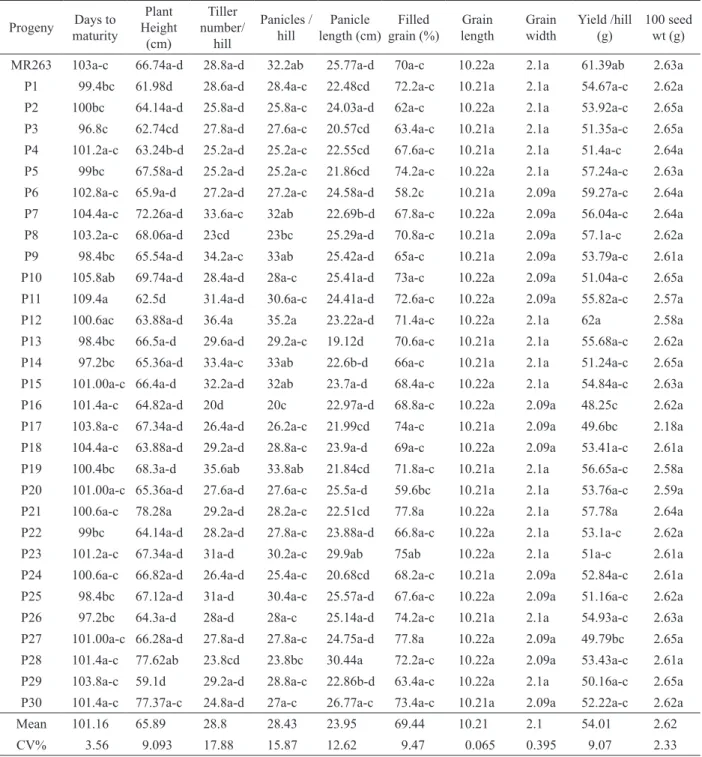
Table 1: Yield and yield contributing characteristics of 30 selected homozygous blast resistant plants.
Progeny Days to maturity
Plant Height
(cm)
Tiller number/
hill
Panicles / hill
Panicle length (cm)
Filled grain (%)
Grain length
Grain width
Yield /hill (g)
100 seed wt (g)
MR263 103a-c 66.74a-d 28.8a-d 32.2ab 25.77a-d 70a-c 10.22a 2.1a 61.39ab 2.63a
P1 99.4bc 61.98d 28.6a-d 28.4a-c 22.48cd 72.2a-c 10.21a 2.1a 54.67a-c 2.62a
P2 100bc 64.14a-d 25.8a-d 25.8a-c 24.03a-d 62a-c 10.22a 2.1a 53.92a-c 2.65a
P3 96.8c 62.74cd 27.8a-d 27.6a-c 20.57cd 63.4a-c 10.21a 2.1a 51.35a-c 2.65a
P4 101.2a-c 63.24b-d 25.2a-d 25.2a-c 22.55cd 67.6a-c 10.21a 2.1a 51.4a-c 2.64a
P5 99bc 67.58a-d 25.2a-d 25.2a-c 21.86cd 74.2a-c 10.22a 2.1a 57.24a-c 2.63a
P6 102.8a-c 65.9a-d 27.2a-d 27.2a-c 24.58a-d 58.2c 10.21a 2.09a 59.27a-c 2.64a
P7 104.4a-c 72.26a-d 33.6a-c 32ab 22.69b-d 67.8a-c 10.22a 2.09a 56.04a-c 2.64a
P8 103.2a-c 68.06a-d 23cd 23bc 25.29a-d 70.8a-c 10.21a 2.09a 57.1a-c 2.62a
P9 98.4bc 65.54a-d 34.2a-c 33ab 25.42a-d 65a-c 10.21a 2.09a 53.79a-c 2.61a
P10 105.8ab 69.74a-d 28.4a-d 28a-c 25.41a-d 73a-c 10.22a 2.09a 51.04a-c 2.65a
P11 109.4a 62.5d 31.4a-d 30.6a-c 24.41a-d 72.6a-c 10.22a 2.09a 55.82a-c 2.57a
P12 100.6ac 63.88a-d 36.4a 35.2a 23.22a-d 71.4a-c 10.22a 2.1a 62a 2.58a
P13 98.4bc 66.5a-d 29.6a-d 29.2a-c 19.12d 70.6a-c 10.21a 2.1a 55.68a-c 2.62a
P14 97.2bc 65.36a-d 33.4a-c 33ab 22.6b-d 66a-c 10.21a 2.1a 51.24a-c 2.65a
P15 101.00a-c 66.4a-d 32.2a-d 32ab 23.7a-d 68.4a-c 10.22a 2.1a 54.84a-c 2.63a
P16 101.4a-c 64.82a-d 20d 20c 22.97a-d 68.8a-c 10.22a 2.09a 48.25c 2.62a
P17 103.8a-c 67.34a-d 26.4a-d 26.2a-c 21.99cd 74a-c 10.21a 2.09a 49.6bc 2.18a
P18 104.4a-c 63.88a-d 29.2a-d 28.8a-c 23.9a-d 69a-c 10.22a 2.09a 53.41a-c 2.61a
P19 100.4bc 68.3a-d 35.6ab 33.8ab 21.84cd 71.8a-c 10.21a 2.1a 56.65a-c 2.58a
P20 101.00a-c 65.36a-d 27.6a-d 27.6a-c 25.5a-d 59.6bc 10.21a 2.1a 53.76a-c 2.59a
P21 100.6a-c 78.28a 29.2a-d 28.2a-c 22.51cd 77.8a 10.22a 2.1a 57.78a 2.64a
P22 99bc 64.14a-d 28.2a-d 27.8a-c 23.88a-d 66.8a-c 10.22a 2.1a 53.1a-c 2.62a
P23 101.2a-c 67.34a-d 31a-d 30.2a-c 29.9ab 75ab 10.22a 2.1a 51a-c 2.61a
P24 100.6a-c 66.82a-d 26.4a-d 25.4a-c 20.68cd 68.2a-c 10.21a 2.09a 52.84a-c 2.61a
P25 98.4bc 67.12a-d 31a-d 30.4a-c 25.57a-d 67.6a-c 10.22a 2.09a 51.16a-c 2.62a
P26 97.2bc 64.3a-d 28a-d 28a-c 25.14a-d 74.2a-c 10.21a 2.1a 54.93a-c 2.63a
P27 101.00a-c 66.28a-d 27.8a-d 27.8a-c 24.75a-d 77.8a 10.22a 2.09a 49.79bc 2.65a
P28 101.4a-c 77.62ab 23.8cd 23.8bc 30.44a 72.2a-c 10.22a 2.09a 53.43a-c 2.61a
P29 103.8a-c 59.1d 29.2a-d 28.8a-c 22.86b-d 63.4a-c 10.22a 2.1a 50.16a-c 2.65a
P30 101.4a-c 77.37a-c 24.8a-d 27a-c 26.77a-c 73.4a-c 10.21a 2.09a 52.22a-c 2.62a
Mean 101.16 65.89 28.8 28.43 23.95 69.44 10.21 2.1 54.01 2.62
CV% 3.56 9.093 17.88 15.87 12.62 9.47 0.065 0.395 9.07 2.33
Table 2: Estimation of genetic variables of 10 morphological characteristics of 30 selected homozygous blast resistant plants.
Traits Mean MSG MSE σ2
G σ
2
P PCV (%) GCV (%) hB
2 (%) GA (%)
Days to maturity 101.16 57.22 9.006 24.107 33.113 5.6884 4.85359 72.80 8.53105 Plant height 66.8027 97.18272 11.9 42.6414 54.5414 11.0553 9.77511 78.18 17.805 Tiller number/Hill 28.8 81.10666 12.543 34.2818 46.8248 23.76 20.3301 73.21 35.8344 Panicles/Hill 28.43 76.46 13.3754 31.5423 44.9177 23.5739 19.7547 70.22 34.1016 Panicle length (cm) 23.95 38.847 7.14 15.8535 22.9935 20.0215 16.6248 68.94 28.437 Filled grain 69.44 127.66 13.314 57.173 70.487 12.0905 10.8889 81.11 20.202 Grain length(mm) 10.21 0.000436 0.000018 0.00021 0.00023 0.14757 0.14159 92.07 0.27988 Grain width (mm) 2.1 0.000358 0.000008 0.00018 0.00018 0.64418 0.62994 95.62 1.269 Yield/ hill (gm) 54.01 91.489 9.004 41.2425 50.2465 13.1244 11.8905 82.08 22.1914 100 seed weight 2.62 0.00557 0.00014 0.00272 0.00286 2.0394 1.98877 95.09 3.99515 Notes: MSG – Genotype mean squares; MSE – Error mean squares; σ2G – genetic variance; σ2
P – Phenotypic variance; PCV- Phenotypic coefficient of variation; GCV-Genetic coefficient of variation; hB2 – Broad-sense heritability; GA- Genetic advanced.
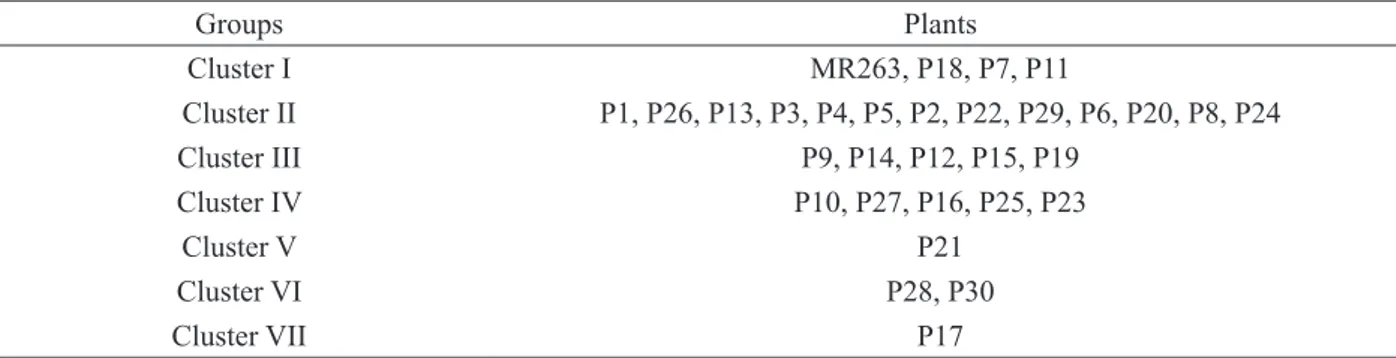
Table 3: Groups of 30 blast resistant plants with MR263 based on 10 yield and yield according to cluster analysis.
Groups Plants
Cluster I MR263, P18, P7, P11
Cluster II P1, P26, P13, P3, P4, P5, P2, P22, P29, P6, P20, P8, P24
Cluster III P9, P14, P12, P15, P19
Cluster IV P10, P27, P16, P25, P23
Cluster V P21
Cluster VI P28, P30
Cluster VII P17
Table 4: Mean values of 10 morphological characters for seven groups revealed by cluster analysis on 30 blast resistant plants with MR263 variety.
Groups Days of maturity
Plant Height (cm)
Tiller number/
hill
Panicles / hill
Panicle length
(cm)
Filled grain (%)
Grain length
Grain width
Yield /hill (g)
100 seed wt (g)
Cluster I 105.30 66.35 34.36 33.40 24.19 69.85 10.22 2.09 58.81 2.64
Plant height
The highest plant height (78.28 cm) was observed in plant number 21 followed by plant number 30 and 28 respectively and the lowest (59.1cm) was seen in plant
number 29. They had highly significant difference. This result
was in consistent to those of Mazid et al. (2013) who observed variable plant height among forty-one rice genotypes from various origins. Although the height of the rest of the plants
was different but did not differ significantly and very close to
the height of MR263. Meaning is that plant height of newly developed plants is near about same with MR263 (Table 1). Number of tillers hill-1
Significant variations were also observed for number of
tillers hill-1 with the highest tiller number in plant 12 (36) followed
by plant number 19 (35), 9 (34) and 7 (33) respectively and the lowest tiller number was recorded in plant number 16 (20). The rest of the progenies had different values but were statistically similar. It indicates that tiller number of new progenies is similar to MR263 (Table 1). Tiller is a unique character to rice production. With decreasing tillers hill-1, yield will be decreased
considerably. The same results were also observed in our present
study. Mondal, Islam and Siddique (2005) also found significant
differences in number of tillers hill-1 among the lines.
Panicle length
Increasing panicle length might have increased grain yield of rice indirectly by increasing panicle length.
The highest panicle length was measured in plant 28 (30.44 cm) followed by plant 23 (29.9 cm), 30 (26.77 cm) and 25 (25.57 cm) respectively and lowest panicle length was recorded in plant 13 (19.12 cm) which were statistically differed. Similar results were also recorded by Idris and Matin (1990). The most of the progenies were statistically similar to MR263 (Table 1).
Panicles hill-1
Highly significant variations were recorded in
number of panicle per hill with the highest in plant number 12 (35) followed by plant number 19 (34), 14 (33) and 7 (32) respectively and the lowest tiller number was seen in plant number 16 (20). The rest of the progenies had
different values but were statistically non-significant. It
indicates that tiller number of new progenies is similar to MR263 (Table 1).
Percentage of filled grains
Number of filled grains panicle-1 is the most important
yield attributing traits differed significantly among the progenies. Plant number 21 and 27 had the highest number of
filled grains (77.8%) followed by plant number 23 (75%) and 5 (74.2%) respectively and the lowest filled grain was measured
in plant number 6 (58.2%) which differed statistically. This
result is also similar with the findings of Dutta, Mia and
Khanum (2002).The remaining measured values of progenies
were different but statistically non-significant (Table 1).
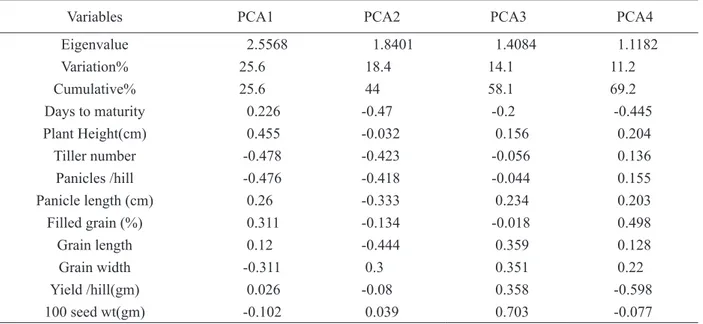
Table 5: Eigenvectors and eigenvalues of the first four principal components.
Variables PCA1 PCA2 PCA3 PCA4
Eigenvalue 2.5568 1.8401 1.4084 1.1182
Variation% 25.6 18.4 14.1 11.2
Cumulative% 25.6 44 58.1 69.2
Days to maturity 0.226 -0.47 -0.2 -0.445
Plant Height(cm) 0.455 -0.032 0.156 0.204
Tiller number -0.478 -0.423 -0.056 0.136
Panicles /hill -0.476 -0.418 -0.044 0.155
Panicle length (cm) 0.26 -0.333 0.234 0.203
Filled grain (%) 0.311 -0.134 -0.018 0.498
Grain length 0.12 -0.444 0.359 0.128
Grain width -0.311 0.3 0.351 0.22
Yield /hill(gm) 0.026 -0.08 0.358 -0.598
Figure 2: Selection of homozygous plants carrying blast resistant gene same as donor allele of Pongsu Seribu 1 (PS1) at BC2F2population using gene linked marker RM263.
Figure 5: Marker assisted foreground selection at BC2F3 families for genes using gene linked marker RM263. MR263- recurrent parent; PS1- Pongsu Seribu (blast resistant parent) and M- 50bp ladder.
Figure 6: The dendrogram of 30 blast resistant plants with MR263 based on 10 measured yield and yield contributing characteristics.
Grain length
Statistically non-significant differences were observed
for grain length in MR263. It indicates that it is controlled by genetically (Ashraf; Khalid; Ali, 1999). Meaning is that the genetic components of newly developed lines have become same with parental lines, MR263 (Table 1).
Grain width
Grain widths were also non-significantly differed
among all the progenies of MR263. It means that there was no environmental effect on seed widths (Ashraf; Khalid; Ali, 1999) (Table 1).
Grain yield per hill
Yield/hill had shown variability among the studied progenies. The highest yield/hill was recorded in plant 12 (62 g) followed by plant number 6 (59.27 g), 21 (57.78 g) and 5 (57.24 g) respectively and lowest yield/hill was observed in
plant number 16 (48.25 g) which was statistically significant.
This result agrees with the results of Dutta, Mia and Khanum (2002) and Mondal Islam and Siddique (2005). The rest of the progenies had different values but were statistically similar.
It indicates that yield/hill of new progenies were near about similar with MR263 (Table 1).
100 seed weight (g)
Thousand-grain weight, an important yield determining component, is a genetic character least
influenced by environment (Ashraf; Khalid; Ali, 1999).
Results revealed that the 100 seed weight of all progenies
had no significant difference. It means that seed weight did
not affect by environmental factors (Table 1).
Phenotypic coefficient of variation (PCV), Genetic coefficient of variation (GCV) and the estimation of
genotypic heritability
The estimation of genotypic, phenotypic and heritability for each and every trait was calculated and presented in Table 2. The level of variation was different among various quantitative traits (Table 2). The highest
phenotypic coefficient of variation (PCV) was observed
recorded in grain length (0.15%). The highest genetic
coefficient of variation (GCV) was also noted for number
of tillers per hill (20.33%) followed by panicles per hill (19.75%), panicle length (16.62%) and yield per hill (11.89%) respectively while the lowest value was recorded for grain length (0.14%). Some researcher observed high
GCV and PCV for number of filled grains per panicle and
yield (Akhtar et al., 2011; Zahid et al., 2006) Moreover, high GCV and PCV were also observed for number of tillers per hill (Pandey; Anurag, 2010; Habib et al., 2005). The results of high GCV as well as PCV were supported by Shahidullah et al., (2010) who found the same result in aromatic rice genotypes. High GCV and PCV for the
traits like number of unfilled grains per panicle and total
number of spikelet’s per panicle were observed by Ghosh and Sharma (2012).
Among the traits, days to maturity, plant height, tiller numbers per hill, and panicle per hill showed more than 70% heritability (Table 2). Whereas more than 80%
heritability was found in filled grain and yield per hill.
The rest of the traits, grain length, grain width and seed weight showed more than 90% heritability. So it indicates that the more heritability, the more genetic transfer of the desired traits to the generation. Present study showed that these traits are easily inherited characters to the next generation as they possess high heritability and are less affected by environmental factors. High heritability was found in the present study for the traits such as yield per hill, total number of tillers per hill, panicles per hill,
panicle length, number of filled grains per panicle, days
to maturity, 100 grain weight. The results were mostly
in accordance with the findings of Iftekharuddaula et al.,
(2001) who reported high heritability for days to maturity,
number of filled grains per panicle and 1000 grain weight.
Almost same result for days to maturity and number of
filled grains per panicle was also reported (Akhtar et al.,
2011). Approximately similar results were also recorded by Habib et al., (2005). High heritability for yield per hill was also in agreement with Pandey and Anurag (2010). High heritability for the following traits such as total number of
spikelets per panicle, yield per hill, days to 50% flowering, flag leaf length, 1000 grain weight, were also supported
by Ghosh and Sharma (2012). Moderate heritability for plant height was noticed in this study which got conformity
with findings of Ghosh and Sharma (2012).
Cluster analysis
The standardized recorded data were employed to calculate the Euclidean distances among the 30 selected homozygous progenies along with MR263 variety and
an UPGMA dendrogram was constructed using these values (Figure 6). In this dendrogram, 30 progenies along with MR263 based on 10 measured characteristics were grouped into seven clustered at 1.21 dissimilarity
coefficients. In this case, cutoff point was set at 1.21 only
for the convenience of discussion.
Cluster I, II, and III had namely 4, 13 and 5 plants and clusters IV, V, VI and VII had 5, 1, 2 and one plants respectively (Table 3). The highest and nearly highest yield and yield component traits such as number of panicles per hill, panicle length, yield per hill, 100 grain weight was under cluster I. Cluster V consisted of progeny with the
highest average of plant height and filled grain %. Cluster
III had the highest days to maturity. Cluster I expressed better yield performance than remaining clusters (Table 4).
The 30 selected homozygous blast resistant plants with MR263 grouped into seven clusters based on
morphological traits at distant coefficient of around 1.21
which implies level of morphological diversity in the rice genotypes. Result of this assay unveiled the better resolution power of quantitative traits for grouping of the rice genotypes. On the basis of 18 morphological traits 58 rice varieties were clustered in to four groups in a study conducted by Ahmadikhah, Nasrollanejads and Alishah (2008). The genetic distance was approximately 0.75. In their study, a group consisted of merely one member and group B, C and D had 14, 20 and 23 members respectively. Moreover, 23 rice populations were clustered into 10 different groups based on 20 morphological traits. The last group was the largest comprising of seven members on the other hand the smallest groups such as one; two and seven had only one member (Veasey et al., 2008).
Principal component analysis
It was found from the principal component analysis that the similar genotypes were grouped together (Figure
7). Cluster analysis was mostly confirmed by PCA and
three dimensional plot (3D) (Figure 7) evidences of it.
According to PCA the first four principal components
account for about 69.3% of total variation for all measured traits and exhibited high correlation among the characteristics analyzed (Table 5). The same way it was
substantiated for physiological traits where first three PCs
expressed 66.60% of total variation, with PC1 explaining 26.10% of the variation, PC2 21.90% and PC3 18.60% of
the total variation. The first 10 principal components were
variation among 32 upland rice varieties was also noticed (Lasalita-zapico et al., 2010) where almost 66.9% variation showed by PC1 and 15.87% by PC2. It was noticed from the eigen vectors analysis that 25.6, 18.4, 14.1and 11.2% variation of measured traits could be explained in respect
by the first four principal components.
As stated before, PC1 depicted 25.6% of total variation (Table 5). Among the 10 morphological traits six traits were positively and four traits were negatively correlated to PC1. The positively correlated traits were days to maturity (0.226), plant height (0.455), panicle
length (0.26), filled grain (0.311) grain length (0.12) and
yield/hill (0.026). The negatively associated traits were tiller number/hill (-0.478), panicles per hill -0.476), grain
width (-0.311) and 100 seed weight (-0.102). The first
PC increases with the decrease of negatively correlated traits but with the increase of positively correlated traits. This indicated that rising in one trait among the positively
correlated traits will influence the other to increase. The
PC1 could be viewed as a measure of the quality of the positively correlated traits. Moreover, first PC most strongly correlated to tiller number (-0.478).
Similarly, PC2 showed 18.4% of total variation. Among 10 traits, 8 traits were negatively and rests of the traits were positively correlated in this component. The days to maturity (-0.47), plant height (-0.032), tiller number/hill (-0.423), panicles/hill (-0.418), panicle length
(-0.333), filled grain (-0.134), grain length (-0.444) and
yield /hill (-0.08) were the negatively correlated traits. On the other hand, grain width (0.3) and the 100 seed weight (0.039) were positively correlated traits. Thus, the PC2 decreases with the increases of positively correlated traits but the increases of negatively correlated traits. It could be stated from the correlation value that PC2 was mainly a measure of days to maturity (-0.47) which was most strongly associated to this principal component (Table 5).
The third PC explained 14.1% of total variation. It was observed that in the third PC, 6 traits were positively correlated which were plant height (0.156), panicle length (0.234), grain length (0.359), grain width (0.351), yield/ hill (0.358) and 100 seed weight (0.703). The rest of the four traits were negatively correlated which were days to maturity (-0.2), tiller number/hill (-0.056) panicle number/
hill (-0.044) and filled grain (-0.018). This PC rises with the
rising of positively correlated traits but with the decline of negatively correlated traits. The PC3 could be said a measure of panicle length on the basis of correlation value (0.234) as it was most strongly correlated to this PC (Table 5).
The fourth PC described 11.2% of total variation which was the lowest among the 4 PCs. This PC consisted
of 3 negatively as well as 7positively correlated traits. The negatively correlated traits were days to maturity (-0.445), yield/hill (-0.598) and 100 seed weight (-0.077). On the contrary, the 7 positively correlated traits were plant height (0.204), tiller number/hill (0.136), panicles/
hill (0.155), panicle length (0.203), filed grain (0.498),
grain length (0.128) and grain width (0.22). On the basis of correlation value number of tillers per hill most strongly and negatively correlated with this PC (Table 5).
CONCLUSIONS
After all analysis and discussions we conclude that
most of the traits including number of filled grains , panicle
length,100 grains weight, number of tillers per hill and number of panicles per hill revealed relation to the yield per hill. Several of the studied traits were highly heritable in present study as well as other studies conducted by different scientists from different countries of the world. The current study unveiled that yield per hill, total number
of spikelet’s per panicle and number of filled grains have
high heritability and genetic advance which are regarded as essential for trait selection by the scientists. Therefore, this is a good prospect for rice breeder to select economically
vital traits with little environmentally influenced errors.
The selected 30 homozygous plants of BC2F3 showed homozygous in comparison with the recurrent parent MR263. The maximum progenies of BC2F2 families observed the similarity like MR263. The results revealed
that the values of filled grains, grain length, grain width,
yield per hill, grain weight, panicle length were higher or equal to MR263. Very few progenies showed less performance than MR263. It indicates that the measured traits of developed selected blast resistant plants tend to MR263.
Some better plants were identified from the cluster
analyses based on measured traits. Some plants could be selected for future breeding program from the previous discussion based on evaluated traits. On the basis of assessed traits the following plants could be used as parents which might produce higher yield, blast resistant and good morphological traits having plants, such as plant number 12, 6, 7, 5, 21, 22, 5, 26, 11, 8, 10, 13 and 15.
ACKNOWLEDGMENTS
The authors express their acknowledgements to the Long-term Research Grant Scheme (LRGS), Food Security Project (Research grant number: 5525001), Ministry of
Education, Malaysia, for the financial support to conduct
REFERENCES
AHMADIKHAH, A.; NASROLLANEJADS, S.; ALISHAH, O. Quantiative studies for investigating variation and its effect on heterosis of rice.
International Journal of Plant Production. 2(4):297-308, 2008.
ASHKANI, S. et al. Analysis of simple sequence repeat markers linked with blast disease resistance genes in a segregating population of rice (Oryza sativa). Genetics and Molecular Research. 10(3):1345-1355, 2011. ASHKANI, S. et al. Genetic dissection of rice blast resistance by QTL mapping approach using an F3 population. Molecular Biology Reports.40:2503-2515, 2013.
ASHRAF, A.; KHALID, A.; ALI, K. Effect of seedling age and density on growth and yield of rice in saline soil. Pakistan Journal of Biological Sciences. 2(3):860-862, 1999.
AKHTAR, N. et al. Estimation of heritability,
correlation and path coefficient analysis in fine grain
rice (Oryza sativa L.). The Journal of Animal and Plant Sciences. 21(4):660-664, 2011.
CALDO, R.A. et al. Morphology-based genetic diversity analysis of ancestral lines of rice in Philippine rice cultivars. Philippine Journal of Crop Science. 21(3):86-92, 1996.
CASTANO, J.B. et al. Upland rice genotypes resistant to blast (B1) disease in west Sumatra. International Rice Research Newsletter.15(4):11-20, 1990. CHANDRA, S. et al. Effects of the 2004 El Niño on tropospheric ozone and water vapor. Geophysical Research Letters.34:1-5 2007.
DOYLE, J.J., DOYLE, J.L. Isolation of plant DNA from fresh tissue. Focus.12:12-15, 1990.
DUTTA, R.K.; MIA, M.A.B.; KHANUM, S. Plant
architecture and growth characteristics of fine grain
and aromatic rice and their relations with grain yield. International Rice Commission Newsletter.51:51-55, 2002.
FU, C. et al. Genetic improvement of resistance to blast and bacterial blight of the elite maintainer line Rongfeng B in hybrid rice (Oryza sativa L.) by using marker-assisted selection. African Journal of Biotechnology. 11:13104-13124, 2012.
GHOS, S.C.; SHARMA, D. Genetic parameters of agro- morpho-physiological traits in rice (Oryza sativa L.). Electronic Journal of Plant Breeding. 3(1):711-714, 2012. HABIB, S.H. et al. Genetic analysis and morpho- physiogical selection criteria for traditional Biron in Bangladesh rice germplasm. Journal of Biological sciences. 5(3):315-318, 2005.
HAQ, I.M. et al. Screening of rice germplasm against Pyricularia oryzae and evaluation of various fungitoxicants for control of disease. Pakistan Journal of Phytopathology.14(1):32-35, 2002.
HASAN M.M. et al. Marker-assisted backcrossing: a useful method for rice improvement. Biotechnology
and Biotechnological Equipment.29(3):237-254, 2015.
HIEN, N.L. et al. Genetic diversity of morphological responses and the relationships among Asia aromatic rice (Oryza sativa L.) cultivars. Tropics.16:343-355, 2007.
IDRIS, M.; MATIN, M.A. Response of four exotic strains of aman rice to urea. Bangladesh Journal of Agricultural Science. 17(2):271-275, 1990.
IFTEKHARUDDAULA, K.M. et al. Genetic variability, character association and path parameters of yield components in irrigated rice (Oryza sativa L.).
Bangladesh Journal of Plant Breeding and Genetics. 14:43-49, 2001.
JIA, Y. et al. Direct interaction of resistance gene and avirulence gene products confers rice blast resistance. The EMBO Journal. 19:4004-4014, 2000.
LASLITA-ZAPICO, F.C.; NAMOCATCAT, J.A.; CARINI-TURNER, J.L. Genmetic diversity analysis of traditional upland rice cultivars in Kihan, Mlapatan, Sarangani province, Philippines using morphometric markers. Philippine Journal of Science. 139(2):177-180, 2010.
LATIF, M.A. et al. Genetic diversity analyzed by quantitative traits among rice (Oryza sativa L.)
genotypes resistant to blast disease. African Journal of Microbiology Research.5(25):4383-4391, 2011a.
LATIF, M.A. et al. Identification of genotypes resistant
to blast, bacterial leaf blight, sheath blight and tungro
and efficacy of seed treating fungicides against blast
disease of rice. Scientific Research and Essays. 6(13):2804-2811, 2011b.
MATHURE, S. et al. Characterisation of aromatic rice
(Oryza sativa L.) germplasm and correlation between
their agronomic and quality traits. Euphytica. 179:237-246, 2011.
MAZID, M.S. et al. Agro-morphological characterization and assessment of variability,
heritability, genetic advance and divergence in bacterial blight resistant rice genotypes. South African Journal of Botany. 86:15-23, 2013.
MCCOUCH, S.R. et al. Development and mapping of 2240 new SSR markers for rice (Oryza sativa L.). DNA Research.9(6):199-207, 2002.
MONDAL, M.M.A.; ISLAM, A.F.M.S.; SIDDIQUE, M.A. Performance of 17 modern transplant aman cultivar in the northern region of Bangladesh. Bangladesh Journal of Crop Sciences.16:23-29, 2005.
SAS, THE SAS SYSTEM FOR WINDOWS. Version 9.2 (TS1M0), SAS Institute Inc., Cary, NC, USA, 2013
SINGH, M.K. et al. Association analysis for yield and quality attributes in Indica rice and screening of hybrids against Blast Disease (Magnaporthe grisea Barr.). Journal of Plant Sciences. 8:45-56, 2013.
PANDEY, P.; ANURAG, P.J. Estimation of genetic parameters in indigenous rice, AAB. Bioflux. 2(1), 2010.
SASAKI, T. The map-based sequence of the rice genome. Nature. 436:793-800, 2005.
SHAHIDULLAH , S.M. et al. Biomass accumulation
and energy conversion efficiency in aromatic rice
genotypes, Comptes Rendus Biologies. 333:61-67, 2010.
SINGH, V.K. et al. Incorporation of blast resistance into “PRR78”, an elite Basmati rice restorer line, through marker assisted backcross breeding. Field Crops Research. 128:8-16, 2012.
TANWEER F.A. et al. Current advance methods for the
identification of blast resistance genes in rice. Comptes
Rendus Biologies.338(5):321-334, 2015.
TEMNYKH, S. et al. Computational and experimental analysis of microsatellites in rice (Oryza sativa L.): frequency, length variation, transposon associations, and genetic marker potential. Genome Research. 11:1441-1452, 2001.
VEASEY, E.A. et al. Morphoagronomic genetic diversity in Amaerican wild rice species. Brazilian Archives of Biology and Technology. 51(1):94-104, 2008.


![Selection Indices in Indian Mustard [Brassica juncea (L.) Czern & Coss]](data:image/gif;base64,R0lGODlhAQABAIAAAP///wAAACH5BAEAAAAALAAAAAABAAEAAAICRAEAOw==)