MORPHOLOGICAL AND AFLP MARKERS FOR DESCRIBING GENETIC
RELATIONSHIPS AMONG WHITE-OAT GENOTYPES (
1)
GIOVANI BENIN (2); FERNANDO IRAJÁ FÉLIX DE CARVALHO (3); ANTONIO COSTA DE OLIVEIRA (3); VOLMIR SÉRGIO MARCHIORO (4);EDUARDO ALANO VIEIRA (5); IVANDRO BERTAN (3);
IGOR PIRES VALÉRIO (3); JOSÉ ABRAMO MARCHESE (2); GILVANI MATEI (2)
ABSTRACT
The use of different genetic dissimilarity indicators can help in both the selection of crop improvement strategies and as artificial crosses. The objectives of this work were to estimate the genetic dissimilarity among seven oat genotypes (Avena sativa L.) through molecular (dg) and morphological (dm) markers. Data were obtained from two experiments carried out in Capão do Leão County, RS, Brazil, in 2000. The estimated correlation coefficient (r = 0.33) indicated a low association between dg and dm estimates. The genotypes with similar pedigrees (UPF 16 and UPF 17), with a bootstrapping value of 82.7%, performed the most consistent group (dg) and clustered more closely in both techniques (dg and dm). However, genotypes with similar pedigree clustered in distant groups. Both dissimilarity estimates need to be used in order to obtain a more reliable choice of dissimilar parents, with higher probability of developing promising base populations.
Key words: Choice of parents, genetic dissimilarity, genetic variability.
RESUMO
MARCADORES MORFOLÓGICOS E AFLP PARA A AVALIAÇÃO DAS RELAÇÕES GENÉTICAS ENTRE GENÓTIPOS DE AVEIA BRANCA
O uso de diferentes medidas de dissimilaridade genética auxilia na definição de estratégias de melhoramento e no direcionamento de cruzamentos artificiais. O objetivo deste trabalho foi estimar a dissimilaridade genética entre sete genótipos de aveia branca (Avena sativa L.) através de marcadores moleculares AFLP (dg) e caracteres agronômicos (dm). Os resultados foram constatados em dois experimentos desenvolvidos no município de Capão do Leão (RS), Brasil, em 2000. O coeficiente de correlação encontrado (r=0.33) indicou baixa correspondência entre as estimativas de dg e dm. Os genótipos com a mesma genealogia (UPF 16 e UPF 17), com valor de bootstraping de 82,7%, formaram o grupo mais consistente (dg) e o agrupamento mais similar em ambas as técnicas (dg e dm); entretanto, agruparam-se genótipos de genealogia similar em diferentes grupos. Ambas as estimativas de dissimilaridade, quando utilizadas conjuntamente, proporcionam maior suporte para a escolha de genitores dissimilares, com grande probabilidade de desenvolvimento de populações-base promissoras.
Palavras-chave: Escolha de genitores, dissimilaridade genética, variabilidade genética.
(1) Received for publication in january 31, 2007 and accept in February 7, 2008.
(2) Universidade Tecnológica Federal do Paraná – Campus Pato Branco, Curso de Agronomia - Via do Conhecimento, km 01,
85501-970 Pato Branco (PR). E-mail: [email protected]. (*) Correspondent author.
(3) Universidade Federal de Pelotas, Faculdade de Agronomia Eliseu Maciel, Departamento de Fitotecnia, Campus Universitário, s/nº. 96010-900 Pelotas (RS).
(4) Cooperativa Central de Pesquisa Agrícola (COODETEC) - Programa de Melhoramento Genético de trigo, BR 467, km 98,
Caixa Postal 301, 85818-660 Cascavel (PR).
2. MATERIALS AND METHODS
Phenotypic measures
Seven white-oat genotypes were evaluated on the experimental field of the Centro de Genômica e Fitomelhoramento (CGF) from the Faculdade de Agronomia Eliseu Maciel - UFPel, located in Capão do Leão, Brazil, in the agricultural year of 2000.
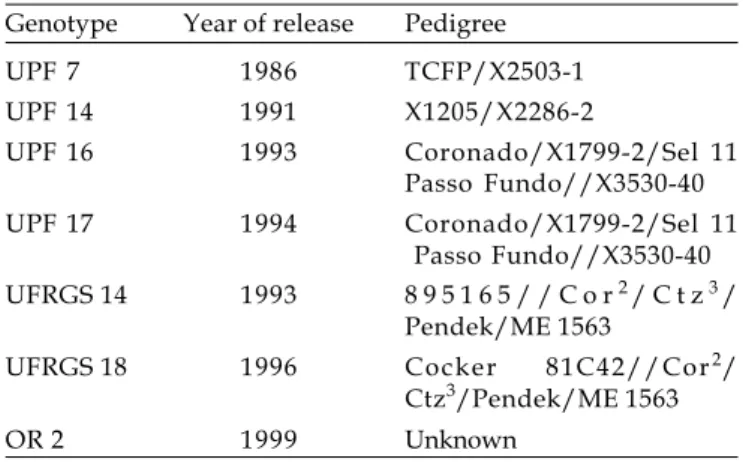
The criteria for selecting the white-oat genotypes were their known contrasting phenotypes for many agronomical and grain quality traits and an overall genetic dissimilarity. A list containing pedigrees of parental genotypes as well as their year of release is shown in table 1.
1. INTRODUCTION
Increasing the probability of obtaining superior segregating populations is a major concern worldwide. Accurate assessment of genotypes is vital for the identification of diverse parental combinations and to create segregating progenies with maximum genetic variability for further selection.
Genetic dissimilarity can be estimated using morphological and molecular markers (GEPTS, 1993).
Phenotypic analyses that take morphological and agronomical differences between parents into account have been widely used for parental selection (SINGH,
1981; BARBOSA-NETO et al., 1996; BENIN et al., 2003b).
Such expectations are due to the fact that both heterosis and specific combining ability effects are a function of non-additive gene actions.
However, morphological variability is often restricted, agronomic traits may not be obvious at all stages of the plant development, and phenotyping has the disadvantages of being influenced by both environmental and genetic factors. Therefore, these may not provide an accurate measure of genetic diversity (FERREIRA e GRATTAPAGLIA, 1998; VIEIRA et al.,
2005). In unfavorable environments, the experimental error inflates these inaccuracy problems, often becoming a major portion of the deviations from the phenotypic value (BENIN et al., 2003a).
As opposite to phenotypic characters, DNA markers enable a more direct measure of genetic dissimilarity, since the latter are independent from environmental effects (KARDOLUS et al., 1998). AFLP
(Amplified Fragment Length Polymorphism) markers detect large numbers of polymorphic fragment (KRAUSS,
1999) that are distributed across the genome (high multiplex ratio) and each fragment is assumed to originate from a different local of the plant genome (RAFALSKI et al., 1996).
Plant selection criteria can determine selection errors, especially for quantitative characters, where the environmental effects are more pronounced. Many oat studies have described that panicle weight has great potential to be used as an indirect selection criterion for grain yield (CAIERÃO et al., 2001; KUREK et al., 2002).
The success of such character is due to its low straw content ( around 10 to 12% of whole panicle weight is straw) and as a consequence, close to grain weight, and its simplicity for applying field selection (MARCHIORO et al., 2003).
Therefore, the present study aimed to estimate the genetic relationships among seven oat genotypes through molecular (dg) and morphological (dm) assessed by AFLP and agronomical trait measures, respectively.
Table 1. Parents used for obtaining the eight studied populations and their pedigrees. Pelotas (RS), 2000
Genotype Year of release Pedigree
UPF 7 1986 TCFP/X2503-1
UPF 14 1991 X1205/X2286-2
UPF 16 1993 Coronado/X1799-2/Sel 11
Passo Fundo//X3530-40
UPF 17 1994 Coronado/X1799-2/Sel 11
Passo Fundo//X3530-40 UFRGS 14 1993 8 9 5 1 6 5 / / C o r2/ C t z3/
Pendek/ME 1563
UFRGS 18 1996 Cocker 81C42//Cor2/
Ctz3/Pendek/ME 1563
OR 2 1999 Unknown
The white-oat genotypes were evaluated in the field in random blocks with four replications. The experimental plots consisted of five rows five meters long, with 0.2 m spacing between rows, with a density of 350 viable seeds m-2. The evaluated variables were:
(a) grain yield (GY) in kg ha-1, by harvesting the center
three rows from each plot, (b) days from the emergence to flowering (VC), measured as the number of days needed for achieving 50% of the plants with exposed panicles, (c) plant stature (PS), obtained as the average in centimeters of three measures (at 21 days after anthesis) of culm length from soil surface to the tip of the inflorescence, (d) hectoliter weight (HW) in kg hl-1, (e) panicle weight (PW), obtained as
The genetic dissimilarity between genotypes, using phenotypic data, was estimated using the generalized dissimilarity of Mahalanobis (D2), based on the genotype means and the residual covariance matrix (CRUZ and CARNEIRO, 2003), using the Genes
Software (CRUZ, 2001). From the dissimilarity matrix,
a dendrogram was obtained using the UPGMA clustering method. For the adjustment between the dissimilarity matrix and the dendrogram, the cophenetic correlation coefficient (r) was calculated (SOKAL and ROHLF, 1962), using the NTSYS software
(ROHLF, 2000).
Genomic DNA
Genomic DNA used for the genetic similarity measures was obtained according to the protocol described in SA G H A I-MAROOF et al. (1984). DNA
concentration was estimated through comparison with Standard marker Low DNA Mass Ladder (Invitrogen). The AFLP analysis was performed according to the protocol presented by the manufacturer (AFLP Analysis System I, Gibco/BRL), being used the same seven primer combinations selected and used by VIEIRA
et al. (2005) (C1: E-ACG/M-CAC; C2: E-ACA/M-CTA; C3: E-ACG/M-CTA; C4: E-ACA/M-CAC; C5: E-AGC/ M-CTC; C6: E-ACC/M-CAG; C7: E-ACC/M-CAA where, E: EcoRI and M: MseI). The amplified fragments were electrophoresed in denaturing polyacrylamide gel (6%) at a constant power of 60 W for a period of 1h and 40 min and visualized with silver staining (CRESTE et al., 2001). The resulting gels were scored
visually and independently by two people, and only the coinciding fragments were considered.
Binary data obtained from the presence/ absence of AFLP bands were used for the calculation of genetic similarity between all the pairs of parents, using the NTSYS software and the Dice coefficient (DICE, 1945). The genetic similarity was transformed
in genetic dissimilarity according to the following equation: Dij = 1 – Sij, where Dij= genetic dissimilarity between each pair of i and j genotypes and Sij = genetic similarity between each pair of i and j genotypes. Based on the dissimilarity matrix, a dendrogram was built using the UPGMA method. To verify the adjustment between the dissimilarity matrix and the dendrogram, a cophenetic correlation coefficient (r), was applied (SOKAL and ROHLF, 1962).
The statistical stability of genetic similarity estimates can be influenced by the sampling procedure (EFRON
and TIBSHIRANI, 1993). Thus, the stability of clusters
was computed by Bootstrap analysis with 2000 replications, using the computational program Winboot, based on the similarity matrix (YAP and
NELSON, 1996). To obtain the correlation estimates
between the genetic dissimilarity matrices based on the morphological and molecular data, a Mantel’s test was performed (MANTEL, 1967).
3. RESULTS AND DISCUSSION
The cultivars UPF 16 and UPF 17, which have the same pedigree (Table 1), exhibited statistically similar means for all the evaluated characters. Genotype differences for the studied traits are shown in table 2. The character grain yield (GY) ranged from 762 to 2,621 kg ha-1 in the cultivars UPF 7 and OR 2, respectively, indicating higher yield potentials in recently released genotypes.
The seven primer combinations used generated a total of 166 markers (Table 3), from which 154 (92.7%) were polymorphic, indicating the great potential of AFLP markers in assessing the genetic variability present among the eight studied genotypes. The primer combinations C3, C4 and C1 revealed the higher numbers of polymorphic markers with 51, 29 and 25, respectively.
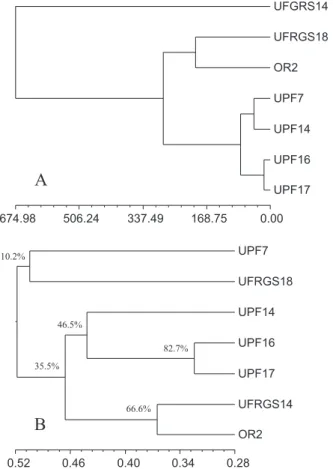
Dendrograms displaying the clustering analysis based on morphological (dm) and molecular dissimilarity (dg) were somewhat different(Figures 1A and 1B). The cophenetic correlation was 0.94 and 0.75 for dm and dg, respectively; therefore, the dendrograms corresponded graphically to 94 and 75% of the dissimilarity matrices, respectively, demonstrating a higher reliability on the representation obtained through the dm dendrogram. For some clusters, consistent results between dm and dg were found. The cultivars UPF 16 and UPF 17 were the closest genotypes grouped on both analyses. A bootstrap analysis indicated this cluster as the most consistent (82.7%). This result is supported by the fact that these two cultivars share the same pedigree. Another cluster was formed by cultivars with similar pedigree (UFRGS 14 and OR 2), with a bootstraping value of 66.6%.
The lack of agreement between dendrograms obtained from the two techniques (Figure 1 A and B) was confirmed by a low (but significant) correlation (r = 0.33; P<0,01) between dissimilarity matrices (dm vs. dg). A low correlation can be due to a partial and insufficient genome representation when morphological data are used (SOUZA and SORRELLS, 1991). A correlation of 0.89
Table 2. Means of the characters grain yield (GY), weight of a thousand grains (WTG), hectoliter weight (HW), panicle weight (PW), grain weight per panicle (GWP), number of grains per panicle (NGP), plant stature (PS) and vegetative cycle (VC) among seven white oat cultivars. Pelotas (RS), 2000
Genotype GY WTG HW PW GWP NGP PS VC
kg ha-1 g kg hl-1 g n cm days
OR 2 2,621 a 22 b 36 a 1.82 B 1.51 b 80 a 106 c 86 d
UFGRS 14 1,758 b 28 a 36 a 2.56 A 2.09 a 63 a 101 c 83 d
UFRGS 18 1,292 c 22 b 30 b 1.91 B 1.58 b 62 a 123 a 100 a
UPF14 1,222 c 22 b 31 b 1.98 B 1.65 b 69 a 105 c 96 b
UPF 17 1,037 d 22 b 31 b 1.59 C 1.23 c 49 b 97 c 93 c
UPF 16 994 d 22 b 29 b 1.47 C 1.13 c 57 b 105 c 91 c
UPF 7 762 d 21 b 30 b 1.57 C 1.27 c 60 a 112 b 97 b
Means 1,383 23 32 1.84 1.49 62 107 92
CV(%) 10 3 4 8 9 12 5 3
Means followed by the same letter do not differ significantly at 5% error probability by the Scott & Knott test.
Table 3. Number of polymorphic and monomorphic AFLP markers generated by primer combinations in a set of seven parents. Pelotas (RS), 2000
Primer Polymorphic Monomorphic
combinations markers markers
C1: E-ACG/M-CAC 25 2
C2: E-ACA/M-CTA 16
-C3: E-ACG/M-CTA 51 2
C4: E-ACA/M-CAC 29 3
C5: E-AGC/M-CTC 16 1
C6: E-ACC/M-CAG 13 4
C7: E-ACC/M-CAA 4
-Total 154 12
Figure 1. Dendrograms resulting from clustering analysis of seven oat genotypes: A) obtained from the Mahalanobis dissimilarity based on morphological data by the UPGMA - dm (eight agronomic characters) and B) obtained from the complement of the similarity coefficient (DICE 1945) based on AFLP analysis and clustering method UPGMA - dg (164 markers). Cophenetic correlation coefficient values are 0.94 and 0.75 for dm and dg, respectively. The Mantel correlation coefficient between dm and dg matrices is 0.33. Pelotas (RS), 2000.
The low correlation observed in the present work between dm and dg can perhaps be explained by an absence of linkage between the loci that control the studied morphological characters and the evaluated markers. Similar results were also found in oats by MOSER and LE E (1994) which observed a
correlation of –0.05 between the dg (RFLP) and dm. Several reasons for this lack of correlation could include: the limited number of traits observed, the limited variation for these traits, the number of underlying genes for these traits, which may also be limited, and possible epistatic interactions between these genes (SCHUT et al., 1997).
On the dendrogram based on dm data, three groups can be observed: i) a cluster containing UPF 16, UPF 17, UPF 14 and UPF 7 ; ii) a cluster where the cultivars UFRGS 18 and OR 2 were grouped, and iii) genotype UFRGS 14 is the most dissimilar genotype.
A
0.00 168.75
337.49 506.24
674.98
UFGRS14
UFRGS18
OR2
UPF7
UPF14
UPF16
UPF17
B
0.28 0.34
0.40 0.46
0.52
UPF7
UFRGS18
UPF14
UPF16
UPF17
UFRGS14
OR2
46.5%
82.7%
66.6% 10.2%
ACKNOWLEDGEMENTS
The authors thank the CNPq and CAPES for financial support to carry out this study.
REFERENCES
ATCHLEY, W.R, NEWMANN, S.; COWLEY, D.E. Genetic divergence in mandible form in relation to molecular divergence in inbred mouse strains. Genetics, Baltimore, v.120, p.239-253, 1988.
BARBOSA-NETO, J.F.; SORRELLS, M.E.; CISAR, G. Prediction of heterosis in wheat using coefficient of parentage and RFLP-based estimates of genetic relationship. Genome, Ottawa, v.39, p.1142–1149, 1996.
BENIN, G.; CARVALHO, F.I.F.; OLIVEIRA, A.C.; FLOSS, E.L.; LORENCETTI, C.; MARCHIORO, V.S.; SILVA, J.A.G. Implicações do ambiente sobre o rendimento de grãos em aveia e suas influências sobre estimativas de parâmetros genéticos. Revista Brasileira de Agrociência, Pelotas, v.9, n.3, p.207-214, 2003a.
BENIN, G.; CARVALHO, F.I.F.; OLIVEIRA, A.C.; MARCHIORO, V.S.; LORENCETTI, C.; KUREK, A.J.; SILVA, J.A.G.; CRUZ, P.J.; HARTWIG, I.; SCHMIDT, D.A.M. Comparações entre medidas de dissimilaridade e estatísticas multivariadas como critérios no direcionamento de hibridações em aveia. Ciência Rural, Santa Maria, v.33, n.4, p.657-662, 2003b.
CAIERÃO, E.; CARVALHO, F.I.F.; PACHECO, M.T.; LORENCETTI, C.; MARCHIORO, V.S.; SILVA, J.A.G. Seleção indireta em aveia para o incremento no rendimento de grãos.
Ciência Rural, Santa Maria, v.31, n.32 p.231-236, 2001. CRESTE, S.; TULMANN-NETO, A.; FIGUEIRA, A. Detection of single sequence repeat polymorphism in denaturing polyacrylamide sequencing gels by silver staining. Plant Molecular Biology Reporter, v.19, p.1-8, 2001.
CRUZ, C.D. Programa Genes: aplicativo computacional em genética e estatística. Viçosa: UFV, 2001. 648p.
CRUZ, C.D.; CARNEIRO, P.C.S. Modelos biométricos aplicados ao melhoramento genético. Viçosa: UFV, 2003. 585p. DICE, L.R. Measures of the amount of ecological association between species. Ecology, Washington, v.26, p.297-302, 1945. DUARTE, J.M.; SANTOS, J.B.; MELO, L.C. Genetic divergence among common bean cultivars from different races based on RAPD markers. Genetics and Molecular Biology, Ribeirão Preto, v.22, n.3, p.419-426, 1999.
EFRON, B.; TIBSHIRANI, R.J. An introduction to the bootstrap. New York: Chapman and Hall, 1993. 436p.
FERREIRA, M.E.; GRATTAPAGLIA, D. Introdução ao uso de marcadores moleculares em análise genética. 3.ed. Brasília: EMBRAPA-CENARGEN, 1998. 220p. (EMBRAPA-CENARGEN, Documento, 20)
T h e s e r e s u l t s r e f l e c t a h i g h e r g e n e t i c s i m i l a r i t y b e t w e e n g e n o t y p e s f r o m t h e s a m e b r e e d i n g p r o g r a m , s i n c e t h e g e n o t y p e s f r o m Universidade de Passo Fundo (UPF) and those from the Universidade Federal do Rio Grande do Sul (UFRGS) were clustered, respectively, in separate major groups. One important reminder is that cultivar OR2 was developed from populations originated by the UFRGS program. This observation suggests that these genotypes were targeted by similar selection criteria, since the morphological characters evaluated for the dm estimate were the o n e s m o s t c o m m o n l y u s e d f o r s e l e c t i o n a n d , therefore, more subjected to artificial selection and breeder’s preferences.
Distinct patterns were observed for the dissimilarity matrices estimated with dm and dg. suggesting that dm and dg are subjected to different sources of variation. Molecular markers represent a sample of the plant genome, and even so, are used to make an inference on the whole genome (MOSER and
LEE, 1994). A source of molecular marker error is the
underestimation of the genetic dissimilarity, since two bands with same mobility on the gel, assumed identical, can come from the same or different chromosomes within a genome. Morphological dissimilarity is influenced by the environmental variance, non additive effects, correlation between characters, heterogeneity between variance and covariance, and genotype x environment interaction (ATCHLEY et al.,1988).
R e g a r d i n g t h e h i g h c o m p l e x i t y o f t h e relationship between phenotypic and genotypic variance, lines that are phenotypically different, can be genetically identical, and lines very similar in appearance and/or performance, can be genetically dissimilar. Thus, both dissimilarity estimates (dm and dg) must be used in order to obtain a more reliable selection of dissimilar parents. Thus, the efficiency of white oat breeding programs can be improved by concentrating the resources for line development and testing on the most promising base populations.
4. CONCLUSIONS
1. No relationship between morphological and AFLP dissimilarity matrices were found, suggesting that these analyses are subjected to different error types.
GEPTS, P. The use of molecular and biochemical markers in crop evolution studies. In Evolutionary Biology, New York, v.27, p. 51-94, 1993.
KARDOLUS, J.; ECK, H.; BERG, R. The potential of AFLP in biosystematics: a first application in Solanum taxonomy. Plant Systems Evolutive, v.2, p.87-103, 1998.
KRAUSS, S.L. Complete exclusion of nonsires in analysis of paternity in a natural plant population using amplified fragment length polymorphism (AFLP). Molecular Ecology, Loughborough, v.8, p.217-226, 1999.
KUREK, A.J.; CARVALHO, F.I.F.; OLIVEIRA, A.C.; CARGNIN, A.; MARCHIORO, V.S.; LORENCETTI, C. Coeficiente de correlação entre caracteres agronômicos e de qualidade de grãos e sua utilidade na seleção de plantas de aveia. Ciência Rural, Santa Maria, v.32, n.3, p.371-376, 2002.
MANTEL, N. The detection of disease clustering and a generalized regression approach. Cancer Research, v.27, p.209-220, 1967.
MARCHIORO, V.S., CARVALHO, F,I,F,; OLIVEIRA, A.C.; LORENCETTI, C.; BENIN, G.; SILVA, J.A.G.; CARGNIN, A.; SIMIONI, D. Expressão do fenótipo em populações segregantes de aveia conduzidas em diferentes ambientes. Ciência Rural,
Santa Maria, v.33, n.4, p.651-656, 2003.
MOSER, H.; LEE, M. RFLP variation of genealogical dissimilarity, multivariate dissimilarity, heterosis and genetic variation in oats. Theoretical and Applied Genetics,Berlin, v.87, p.947–956, 1994.
RAFALSKI, J.A.; VOGEL, J.M.; MORGANTE, M.; POWELL, W.; ANDRE, C.; TINGEY, S.V. Generating and using DNA markers in plants. In: Nonmammalian Genome Analysis. A Practical Guide (Birren, B. and Lai, E., Ed.). San Diego: Academic Press, 1996. p. 75-134.
ROHLF, F.J. NTSYS-pc: numerical taxonomy and multivariate analysis system, version 2.1. New York: Exeter Software, 2000. SAGHAI-MAROOF, M.A.; SOLIMAN, K.M.; JORGENSEN, R.A.; ALLARD, R.W. Ribosomal DNA spacer length polymorphism in barley: Mendelian inheritance, chromosome location and population dynamics. Proceedings of the National Academy of Sciences of the U.S.A., Washington, v.89, n.2, p.1477-1481, 1984. SINGH, D. The relative importance of characters affecting genetic divergence. The Indian Journal of Genetics & Plant Breeding, NewDelhi, v. 41, n. 2, p.237-245, 1981.
SCHUT, J.W.; QI, X.; STAM, P. Association between relationship measures based on AFLP markers, pedigree data and morphological traits in barley. Theoretical and Applied Genetics, Berlin, v.95, p.1161-1168, 1997.
SOKAL, R.R.; ROHLF, F.J. The comparison of dendrograms by objective methods. Taxon, Berlin, v.11, n.1, p.30-40, 1962. SOUZA, E.; SORRELLS, M.E. Prediction of progeny variation in oat from parental genetic relationships. Theoretical and Applied Genetics,Berlin, v.82, p.233-241, 1991.
VIEIRA, E.A.; CARVALHO, F.I.F.; OLIVEIRA, A.C.; BENIN, G.; ZIMMER, P.D.; SILVA, J.A.G.; MARTINS, A.F.; BERTAN, I.; SILVA, G.O.; SCHMIDT, D.A.M. Comparação entre medidas de distância genealógica, morfológica e molecular em aveia em experimentos com e sem a aplicação de fungicida.
Bragantia, Campinas, v. 64, no. 1, p.51-60, 2005.