WOOD DENSITY OF TREES IN BLACK WATER FLOODPLAINS OF RIO JAÚ NATIONAL PARK, AMAZONIA, BRAZIL
Pia PAROLIN1, Martin WORBES1
ABSTRACTzyxwvutsrqponmlkjihgfedcbaZYXWVUTSRQPONMLKJIHGFEDCBA — The Jaú National Park is the largest protected forested area in the world. The Vitória
Amazônica Foundation is working towards understanding its ecosystem, to which this paper contributes. Wood density was analysed in 27 common tree species growing in the blackwater flood plains of the Rio Jaú, an affluent of the Rio Negro (Amazonia, Brazil). Wood was sampled with an
increment borer. Mean wood density of the analysed species ranged from 0.35 to 0.87 g cm3 . The mean of all sampled species was 0.67 g cm3
(st. dev. 0.13). Lowest density was found forzyxwvutsrqponmlkjihgfedcbaZYXWVUTSRQPONMLKJIHGFEDCBA Hevea spruceana with 0.32 g cm3
and highest for Crudia amazonica with 0.9 g cm 3 .
Key-words: Wood specific gravity, wood density, increment rings, blackwater floodplain forest, igapó, Rio Jaú, Central Amazonia.
Densidade de Madeira de Árvores nas Áreas Inundáveis do Parque Nacional do Jaú, Amazônia, Brasil
RESUMO — O Parque Nacional do Jaú é a maior área protegida do mundo completamente coberta por floresta. Este trabalho contribui para o conhecimento deste ecossistema, em colaboração com a Fundação Vitória Amazônica. A densidade da madeira de 27 espécies de árvores comuns nas áreas inundáveis do Rio Jaú, um afluente do Rio Negro, foi determinada com o método não destrutivo do trado. A densidade média das espécies analisadas variou entre 0.35 e 0.87 g cm 3
. A média de todas as espécies foi de 0.67 g cm3
(st. dev. 0.13). A menor densidade medida foi em Hevea spruceana com 0.32 g cm3
e a maior em Crudia amazonica com 0.9 g cm 3 .
Palavras-chave: Densidade de madeira, anéis de incremento, floresta inundável, igapó, Rio Jaú, Amazônia central.
1
MaxPlanck Institute for Limnology, Tropical Ecology, P. O. Box 165, 24302 Plön, Germany INTRODUCTION
The Jaú National Park is the largest protected forested area in the world. The Rio Jaú is an affluent of the Rio Negro (Amazonia, Brazil). The whole Jaú River basin was declared a National Park. In cooperation with the
Vitória A m a z ô n i c a F o u n d a t i o nzyxwvutsrqponmlkjihgfedcbaZYXWVUTSRQPONMLKJIHGFEDCBA I
Manaus, inventories of nonflooded terra firme forest and flooded igapó forest w e r e p e r f o r m e d in 1994 (Ferreira, 1997) as first steps towards an understanding of the ecosystem. This paper contributes with a study on wood density of common tree species of the blackwater inundation forests (igapó).
Trees have characteristic wood densities. In tropical terra firme for ests, density ranges from 0.05 to 1.08 g em"3
(Rueda & Williamson, 1992). For trees of Central Amazonian inun dation forests, which are subjected to periodical flooding lasting up to 7 months a year (Junk, 1989), the range of wood density lies between 0.26 and 0.94 g c m3
(Worbes, 1989). When looking at white and black water sys tems separately, the density range in w h i t e water forests (Ilha da Marchantaria, Central Amazonia) lies b e t w e e n 0.24 and 0.72 g c m '3
(Martius, 1992), or between 0.20 and 0.80 g cm"3
Parolin & Ferreira, 1998). To date not many species have been examined and few data have been published on black water forests specifically. Wood density is one of the most important quality fea tures. The study gives a first orientation
of the potential for timber use. zyxwvutsrqponmlkjihgfedcbaZYXWVUTSRQPONMLKJIHGFEDCBA
MATERIAL AND METHODS
For wood density determination, samples were taken from some of the most common tree species in the Jaú National Park. Species were chosen based on floristic inventories made by Leandro V. Ferreira (unpublished data, and Ferreira & Stohlgren, 1999). The species were determined in the field by L e a n d r o V. Ferreira and José Ramos at the Amazon Research Insti tute in Manaus (INPA).
Only adult, healthy individuals were chosen. Twenty seven species were sampled with a total of 114 in dividuals. One to twelve trees of each chosen species were sampled at 1.30 m above the ground. In a few cases in which the trees were still standing in
the waterzyxwvutsrqponmlkjihgfedcbaZYXWVUTSRQPONMLKJIHGFEDCBA (Eschweilera tenuifolia), the
sample had to be taken higher on the stem. Trees with b u t t r e s s e s were sampled above the buttress. In the case of Swartzia polyphylla, which has high buttresses instead of a compact stem, samples were taken at 130 cm from the buttresses. Since most trees grow on slopes, samples were always taken on the part of the stem not facing the water. In all cases, diameter at breast height (dbh) and position in the flood gradient (determined by the mark of the year's high water level on the tree
stem) were recorded.
Instead of using the usual destruc tive method of wood density determina tion, in which the tree has to be cut to take wood samples, the method of Howe (1974) and Whitmore (1973) was used, taking wood samples with an in crement borer at breast height. This method is very fast and hardly affects the tree. Density of the samples was determined by calculating the relation of fresh volume to dry weight. The volume of the core was calculated by measur ing the fresh sample with a vernier cali per: πΓ 2
η , where r is the radius of the core = 0.25 cm, and h the length of the sample. Each core was cut into pieces of 1.5 cm length after removing the bark, so that h was 1.5 cm. Dry weight was measured after oven drying for four days at 105°C.
Wood increment was measured exclusively in 9 individuals of 6 species which grew on a particular azonal, very rocky site on Praia das Inscrições, close to the confluence of Rio Jaú and Rio Negro. This site was chosen because extreme low annual increments were expected. For the determination of an nual increments, whole stem sections were analysed and tree rings were counted.
RESULTS AND DISCUSSION
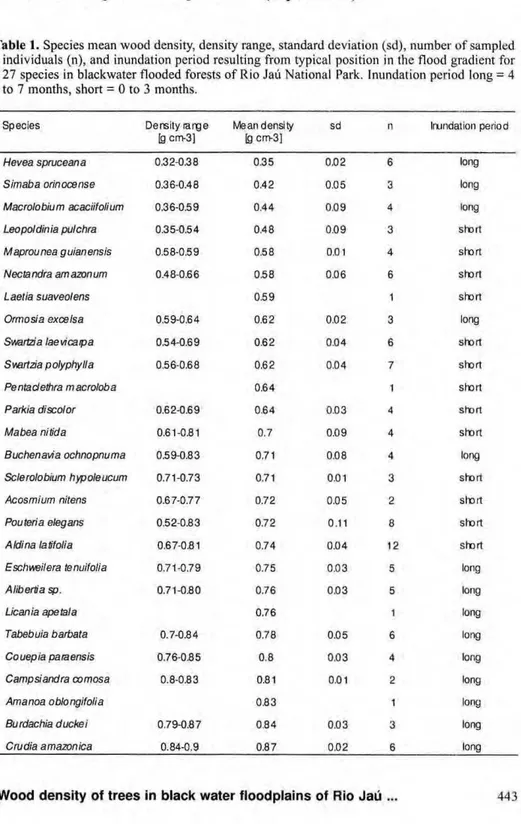
Among the species analysed in this study, mean density ranged from 0.35 to 0.87 g c m3
(Table 1). Absolute lowest density was found for Hevea
spruceana with 0.32 g c m3
(mean 0.35 g cm 3
) and highest for Crudia
amazônica with 0.9 g cm 3
g cm"3
). The mean of all sampled spe g cm"3
inzyxwvutsrqponmlkjihgfedcbaZYXWVUTSRQPONMLKJIHGFEDCBA Tabebuia barbata and 0.90
cies was 0.67 g cm'3
(st. dev. 0.13). g c m3
in Licania heteromorpha Worbes found higher values up to 0.92 (unpubl. data).
Table 1. Species mean wood density, density range, standard deviation (sd), number of sampled individuals (n), and inundation period resulting from typical position in the flood gradient for 27 species in blackwater flooded forests of Rio Jaú National Park. Inundation period long = 4
to 7 months, short = 0 to 3 months. zyxwvutsrqponmlkjihgfedcbaZYXWVUTSRQPONMLKJIHGFEDCBA
Speci es Density range [g cm-3]
Mean density [g cm-3]
s d η Inundation period zyxwvutsrqponmlkjihgfedcbaZYXWVUTSRQPONMLKJIHGFEDCBA
Hevea spruceana 0.32-0.38 0.35 0.02 6 long
Simaba orinocense 0.36-0.48 0.42 0.05 3 long
Macrolobium acaciifolium 0.36-0.59 0.44 0.09 4 long
Leopoldinia pulchra 0.35-0.54 0.48 0.09 3 short
Maprounea guianensis 0.58-0.59 0.58 0.01 4 short
Necta ndra am azon urn 0.48-0.66 0.58 0.06 6 s r o r t
Laetia suaveolens 0.59 zyxwvutsrqponmlkjihgfedcbaZYXWVUTSRQPONMLKJIHGFEDCBAI short
Ormosia excelsa 0.59-0.64 0.62 0.02 3 long
Swartzia laevicaipa 0.54-0.69 0.62 0.04 6 short
Smrtzia polyphylla 0.56-0.68 0.62 0.04 7 short
Pentaclethra macroloba 0.64 1 short
Parkia discolor 0.62-0.69 0.64 0.03 4 short
Mabea nítida 0.61-0.81 0.7 0.09 4 short
Buchenavia ochnopnuma 0.59-0.83 0.71 0.08 4 long
Sclerolobium hypoleucum 0.71-0.73 0.71 0.01 3 short
Acosmium nitens 0.67-0.77 0.72 0.05 2 short
Pou teria elegans 0.52-0.83 0.72 0.11 8 short
Aldina latifolia 0.67-0.81 0.74 0.04 12 s r o r t
Eschweilera tenuifolia 0.71-0.79 0.75 0.03 5 long
Alibertia sp. 0.71-0.80 0.76 0.03 5 long
Licania ape tal a 0.76 I long
Tabebuia barbata 0.7-0.84 0.78 0.05 6 long
Couepia paraensis 0.76-0.85 0.8 0.03 4 long
Campsiandra comosa 0.8-0.83 0.81 0.01 2 long
Amanoa oblongifolia 0.83 1 long
Burdachia duckei 0.79-0.87 0.84 0.03 3 long
Density determination with
increment borer zyxwvutsrqponmlkjihgfedcbaZYXWVUTSRQPONMLKJIHGFEDCBA
The determination of mean den sity with an increment borer is not usual but has been proven to show no significant differences to the conven tional method of determination from w h o l e stem s a m p l e s ( W h i t m o r e , 1973). In this study (Tab. 3), compari son with other authors who analysed the same species (common in black and/or white water) shows that differ ences between the methods are in cluded in the typical density range.
Comparison of wood density in black and white water forests
In an earlier study (Parolin & Ferreira, 1998), mean wood density of common species of white water forests of Central Amazonia was determined
with the same method as described above. Density range in white water forests was found to be higher than in black water forests, ranging from 0.24 to 0.80 g c m3
, with a mean of 0.48 (st. dev. 0.16). A similar mean density of 0.495 g c m 3
was found by Martius (1992) for these forests.
The fact that density is lower in white water forests is due to the occur rence of species with low density, which typically are pioneers, such as
the generazyxwvutsrqponmlkjihgfedcbaZYXWVUTSRQPONMLKJIHGFEDCBA Solarium, Pseudobombax, Cecropia. In black water systems these
genera are absent, and the distinction of pioneers and nonpioneers is not as clear as in white water systems. There is evidence (Ferreira, pers. comm.) that the usual categories do not apply to this system. In fact, in clearings in the black water forests of the Rio Jaú
Table 3. Comparison of wood densities (g c m3
) in different studies determined with different
methods: Parolin = increment borer, other studies = whole stem section. zyxwvutsrqponmlkjihgfedcbaZYXWVUTSRQPONMLKJIHGFEDCBA
P a rolin & W o t b e s ( pre se nt study) W o r b e s 1 )8 9 W o r b e s e t a l 1 9 9 2 M a rtius 1 9 9 2
S p e c i e s m e a n ± s d ra nge Ν m e a n ra nge Ν m e a n ± s d Ν m e a n ± s d Ν lloodpla in
syste m zyxwvutsrqponmlkjihgfedcbaZYXWVUTSRQPONMLKJIHGFEDCBA
Cecropia latiloba 0 . 3 6 ± 0 . 0 1 0 . 3 6 - 0 . 3 7 2 0 . 4 8 1 0 . 3 7 ± 0 . 0 6 7 white
Crateva benthami 0 . 5 ± 0 . 0 5 0 . 4 4 - 0 . 5 7 6 0 . 4 2 0 . 3 9 - 0 . 4 5 2 0 . 4 2 ± 0 . 0 3 ? 0 . 4 3 ± 0 . 0 3 4 white
Eschweilera tenuiiolia 0 . 7 5 ± 0 . 0 3 0 . 7 1 - 0 . 7 9 5 0 . 7 1 1 0 . 7 5 1 bla ck
LaeSa suaveolens 0 . 5 9 1 0 . 7 4 bla ck
Maciolobium acaiilolium 0 .4 ± 0 .0 4 0 . 3 7 - 0 . 4 4 2 0 . 4 3 0 . 4 8 1 w hite
Nectandra amazonum 0 . 4 9 ± 0 . 0 3 0 . 4 7 - 0 . 5 4 7 .,0.47 0 . 4 7 1 w hite
Pseudobombax munguba 0 . 2 7 ± 0 . 0 3 0 . 2 4 - 0 . 3 2 4 0 . 2 6 1 0 . 2 5 ± 0 . 0 2 ? 0 . 2 3 ± 0 . 0 7 5 white
Salix humboldtiana 0 . 3 9 ± 0 . 0 1 0 . 3 7 - 0 . 4 1 7 0 . 4 2 1 white
Swartzia taevicarpa 0 . 6 2 ± 0 . 0 4 0 . 5 4 - 0 . 6 9 6 0 . 5 9 0 . 5 6 - 0 . 6 4 3 bla ck
Svertzia polyphylla 0 . 6 2 ± 0 .0 4 0 . 5 6 - 0 . 6 8 7 0 . 5 6 1 b la c k
Tabebuia barbata 0 . 6 7 ± 0 . 0 2 0 . 6 4 - 0 . 6 8 3 0 . 7 2 0 . 5 3 - 0 . 9 2 15 0 . 7 1 ± 0 . 1 ? white
it appears that the seedlings, saplings and young trees are of the same spe cies which dominate the old growth, and no particular colonizers could be found. Further studies about this would be interesting.
It is particularly interesting to look at the few species which occur in
tion of climatic variations (inundation) affect growth (Howe, 1974).
Wood density shows variations depending on environmental factors. Dry season in the tropics, cold season in temperate regions, or inundation in periodically inundated forests such as the Central Amazonian floodplains
Table 4. Comparison of mean wood density and density range between individuals occurring in white water (Ilha da Marchantaria) and black water (Rio Jaú) floodplains.
Species
Mean wood density Density range
Ilha da March. Rio Jaú Ilha da March. Rio Jaú
Crudia amazônica 0.80 0.87 0.790.80 0.840.90
Macrolobium acaciifolium 0.40 0.44 0.370.44 0.360.59
Nectandra amazonum 0.49 0.58 0.470.54 0.480.66
Tabebuia barbata 0.67 0.78 0.640.68 0.700.84
both systems (Tab. 4). Correlations have not been tested statistically, but a trend can be seen which shows that individuals growing in white water have a lower mean density and density range than individuals of the same species growing in black water.
Explanations for the differences in wood density in the two systems are probably complex but poorly investi g a t e d . Little is known a b o u t the sampled tree species, and tree growth in flooded forests is still poorly under
stood (KlingezyxwvutsrqponmlkjihgfedcbaZYXWVUTSRQPONMLKJIHGFEDCBA et al., 1983; Furch,
1984; Worbes, 1983, 1986; Junk, 1989). Nutrient supply is higher in white water floodplains: these rivers carry a high sediment load and thus enrich the soils (Irion et al., 1983). Soil quality, water supply, light inci dence, and the occurrence and dura
cause a strong impact on growth and thus on wood density. W h i t m o r e (1973) compared wood density of Costa Rican balsa (Ochroma lagopus) from a variety of ecologically distinct areas and found characteristic differ ences between individuals depending on the climatic and hydrological con
ditions of the site. zyxwvutsrqponmlkjihgfedcbaZYXWVUTSRQPONMLKJIHGFEDCBA
Position in the flood gradient
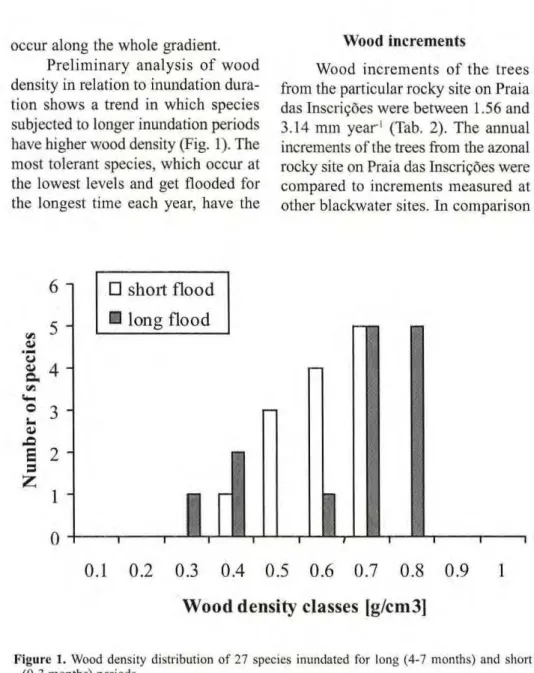
occur along the whole gradient. Preliminary analysis of wood density in relation to inundation dura tion shows a trend in which species subjected to longer inundation periods have higher wood density (Fig. 1). The most tolerant species, which occur at the lowest levels and get flooded for
the longest time each year, have the zyxwvutsrqponmlkjihgfedcbaZYXWVUTSRQPONMLKJIHGFEDCBA
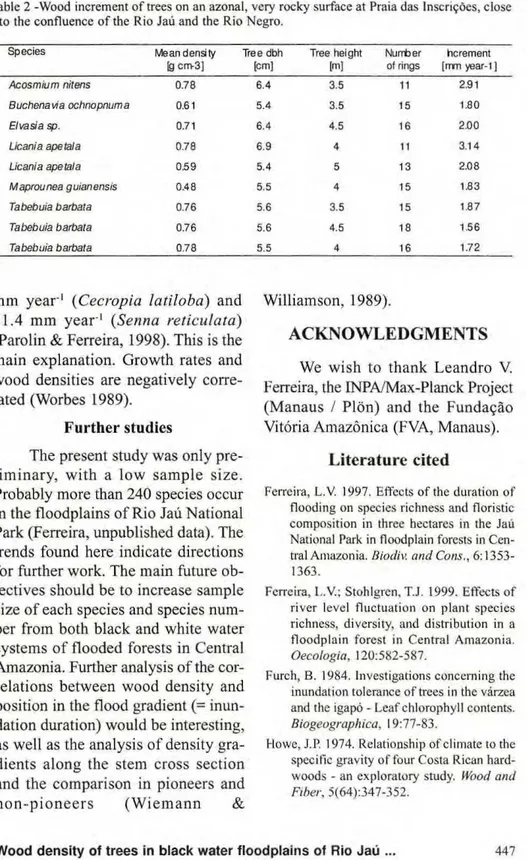
Wood increments
Wood increments of the trees from the particular rocky site on Praia das Inscrições were between 1.56 and 3.14 mm year1
(Tab. 2). The annual increments of the trees from the azonal rocky site on Praia das Inscrições were compared to increments measured at other blackwater sites. In comparison
• short flood
0.1 0.2 0.3 0.4 0.5 0.6 0.7 0.8 0.9 1
Wood density classes [g/cm3]
Figure 1. Wood density distribution of 27 species inundated for long (47 months) and short (03 months) periods.
h i g h e s t d e n s i t y v a l u e szyxwvutsrqponmlkjihgfedcbaZYXWVUTSRQPONMLKJIHGFEDCBA {Crudia amazônica, Burdachia duckei,
Amanoa oblongifolia). On the other
hand, at the lowest levels the species with t h e l o w e s t v a l u e s {Hevea
spruceana, Sim aba orinocense, Macrolobium acaciifolium) occur also.
Table 2 Wood increment of trees on an azonal, very rocky surface at Praia das Inscrições, close
to the confluence of the Rio Jaú and the Rio Negro. zyxwvutsrqponmlkjihgfedcbaZYXWVUTSRQPONMLKJIHGFEDCBA
Species Mean density zyxwvutsrqponmlkjihgfedcbaZYXWVUTSRQPONMLKJIHGFEDCBA
]Q cm-3]
Tree dbh [cm]
Tree height [m]
Number of rings
hcrement [mm year-1]
Acosmium nitens 0.78 6.4 3.5 11 2.91
Buchenavia ochnopnuma 0.61 5.4 3.5 15 1.80
Elvasia sp. 0.71 6.4 4.5 16 2.00
Licania ape tal a 0.78 6.9 4 11 3.14
Licania ape tal a 0.59 5.4 5 13 2.08
Maprounea guianensis 0.48 5.5 4 1 5 1.83
Tabebuia barbata 0.76 5.6 3.5 1 5 1.87
Tabebuia barbata 0.76 5.6 4.5 zyxwvutsrqponmlkjihgfedcbaZYXWVUTSRQPONMLKJIHGFEDCBA18 1.56
Tabebuia barbata 0.78 5.5 4 16 1.72
mm y e a r1zyxwvutsrqponmlkjihgfedcbaZYXWVUTSRQPONMLKJIHGFEDCBA
(Cecropia latiloba) and
21.4 mm y e a r1
(Senna reticulata)
(Parolin & Ferreira, 1998). This is the main explanation. Growth rates and wood densities are negatively corre
lated (Worbes 1989). zyxwvutsrqponmlkjihgfedcbaZYXWVUTSRQPONMLKJIHGFEDCBA
Further studies
The present study was only pre liminary, with a low sample size. Probably more than 240 species occur in the floodplains of Rio Jaú National Park (Ferreira, unpublished data). The trends found here indicate directions for further work. The main future ob jectives should be to increase sample
size of each species and species num ber from both black and white water systems of flooded forests in Central Amazonia. Further analysis of the cor relations between wood density and position in the flood gradient (= inun dation duration) would be interesting, as well as the analysis of density gra dients along the stem cross section and the comparison in pioneers and n o n p i o n e e r s ( W i e m a n n &
Williamson, 1989).
ACKNOWLEDGMENTS
We wish to thank Leandro V. Ferreira, the INPA/MaxPlanck Project
(ManauszyxwvutsrqponmlkjihgfedcbaZYXWVUTSRQPONMLKJIHGFEDCBA I Plõn) and the Fundação Vitória Amazônica (FVA, Manaus).
Literature cited
Ferreira, L.V. 1997. Effects of the duration of flooding on species richness and floristic composition in three hectares in the Jaú National Park in floodplain forests in Cen tral Amazonia. Biodiv. and Cons., 6:1353 1363.
Ferreira, 1..V.; Stohlgren, T.J. 1999. Effects of river level fluctuation on plant species richness, diversity, and distribution in a floodplain forest in Central Amazonia.
Oecologia, 120:582587.
Furch, B. 1984. Investigations concerning the inundation tolerance of trees in the várzea and the igapó Leaf chlorophyll contents.
Biogeographica, 19:7783.
Howe, J.P. 1974. Relationship of climate to the specific gravity of four Costa Rican hard woods an exploratory study. Wood and
Irion, G.; Adis, J.; Junk, W.J.; Wunderlich, F. 1983. Sedimentological studies of the Ilha
de Marchantaria in the SolimòeszyxwvutsrqponmlkjihgfedcbaZYXWVUTSRQPONMLKJIHGFEDCBA I Ama zon River near Manaus.zyxwvutsrqponmlkjihgfedcbaZYXWVUTSRQPONMLKJIHGFEDCBA Amazoniana,
8:118.
Junk, W.J. 1989. Flood tolerance and tree distribution in Central Amazonian flood plains. In: Nielsen, L.B.; Nielsen, I.C.; Balslev, H. (Eds.) Tropical forests:
botani-cal dynamics, speciation and diversity.
Academic Press, London, pp. 4764. Klinge, H.; Furch, K.; Harms, E.; Revilla, J.
1983. Foliar nutrient levels of native tree s p e c i e s from C e n t r a l A m a z o n i a .
Amazoniana, 8:1946.
Martius, C. 1992. Density, humidity, and nitro gen content of dominant wood species of floodplain forests (várzea) in Amazonia.
Holz als Roh- und Werkstoff, 50:300303.
Farolin P., Ferreira L.V. & Junk W.J. (1998): Central Amazonian floodplains: effect of two water types on the wood density of trees. Verh. Internat. Verein. Limnol. 26(3):11061112.
Parolin, P.; Ferreira, L.V. 1998. Are there dif ferences in specific wood gravities be tween trees in várzea and igapó (Central Amazonia)? Ecotropica, 4:2532.
Rueda, R.; Williamson, G.B. 1992. Radial and vertical wood specific gravity in Ochroma
pyramidale ( C a v . ex L a m . ) U r b .
(Bombacaceae). Biotropica, 24:512518.
Whitmore, J.L. 1973. Wood density variation in Costa Rican balsa. Wood Science, 5:223229.
Wiemann, M.C.; Williamson, G.B. 1989. Wood specific gradients in tropical dry and mon tane rain forest trees. Amer. J. Bot., 76(6):924928.
W o r b e s , M. 1 9 8 3 . V e g e t a t i o n s k u n d l i c h e
U n t e r s u c h u n g e n z w e i e r Ü b e r s c h w e m m u n g s w â l d e r in Zentralamazonien vorlaufige Ergebnisse.
Amazoniana, 8:4766.
Worbes, M. 1986. Lebensbedingungen und Holzwachstum in zentralamazonischen Ü b e r s c h w e m m u n g s w ã l d e r n . Scripta
Geobotanica, 17:112.
Worbes, M. 1989. Growth rings, increment and age of trees in inundation forests, savan n a s and a m o u n t a i n forest in t h e
Neotropics. IAWA Bulletin 10(2):109122. zyxwvutsrqponmlkjihgfedcbaZYXWVUTSRQPONMLKJIHGFEDCBA