25 The European Journal of Management
Studies is a publication of ISEG, Universidade de Lisboa. The mission of EJMS is to significantly influence the domain of management studies by publishing innovative research articles. EJMS aspires to provide a platform for thought leadership and outreach.
Editors-in-Chief: Luís M. de Castro, PhD
ISEG - Lisbon School of Economics and Management, Universidade de Lisboa, Portugal
Gurpreet Dhillon, PhD
Virginia Commonwealth University, USA Tiago Cardão-Pito, PhD
ISEG - Lisbon School of Economics and Management, Universidade de Lisboa, Portugal
Managing Editor: Mark Crathorne, MA
ISEG - Lisbon School of Economics and Management, Universidade de Lisboa, Portugal
ISSN: 2183-4172 Volume 22, Issue 1
www.european-jms.com
CAPITAL STRUCTURE OF EXPORTER
SMEs DURING THE FINANCIAL CRISIS:
EVIDENCE FROM PORTUGAL
Inês Lisboa
ESTG - School of Technology and Management, Management for Sustainability Research Centre, Polytechnic Institute of Leiria, Portugal
Abstract
This study aims to identify the most important determinants to explain the capital structure of exporter SMEs during the financial crisis. Capital structure is measured using three alternative ratios: total debt, long-term debt, and short-term debt, as the impact of the determinants can depend on debt maturity. Analysing an unbalanced sample of 277 Portuguese exporter SMEs, from 2008 until 2014, and using a panel data methodology, estimating the models with fixed effects for firms, the results suggest that size, profitability, asset structure, non-debt tax shields, growth, liquidity, and age are important determinants for explaining firms’ capital structure. Furthermore, exports intensity and crisis effect do not impact a firm’s indebtedness. Findings are consistent with the hierarchy of funds proposed by the Pecking Order Theory. The Trade-off Theory is also important, as fixed asset can be used as collateral in the case of a firm’s bankruptcy. Additionally, results suggest that exporter SMEs hold more short-term than long-term debt, especially small-sized firms. Finally, companies’ debt ratio presents a constant tendency during the period analysed.
26
Introduction
The study of the topic of capital structure goes all the way back to the seminal work of Modigliani & Miller, in 1958, and their proposition of the irrelevance of capital structure. Unrealistic assumptions were used for the basis of that work, and, in 1963 the same authors introduced taxes to the model, and found a different conclusion. Since then, several studies have focussed on capital structure choices. Diverse theories have appeared to explain firm’s indebtedness. The main theories are the: Trade-off; Agency Costs; Pecking-Order, and; Market Timing theories. According to Myers (2001:81) however, “There is no universal theory of the debt-equity choice, and no reason to expect one”.
The Trade-off Theory presented by Modigliani & Miller (1963) argues that there is an optimal capital structure, which takes into account the benefits of tax savings and the costs of bankruptcy expected due to debt increases. Based on this theory, Jensen & Meckling (1976) presented the Agency Cost Theory. Debt is a way of monitoring managers and of avoiding divergence between the principal and the agent. For another viewpoint, the Pecking Order Theory proposed by Myers (1984) and Myers & Majluf (1984) argues that, due to information asymmetries, the optimal capital structure does not exist. Additionally, Fama & French (2002) argue that investors have a hierarchical order of capital preferences: firstly internal funds; secondly debt, and; thirdly new issue of equity, in order to not lose control of the firm. Finally, the Market Timing theory, suggested by Baker & Wurgler (2002), suggests that firms switch between equity and debt depending on their market value. When a firm’s market value is high, the firm issue equity, otherwise they tend to repurchase equity. This theory can only be validated for listed firms.
Based on these theories, a growing body of research has analysed firms’ capital structure (e.g., Psillaki & Daskalaskis, 2009, Mateev & Ivanov, 2010, Chen & Yu, 2011, Mateev et al., 2013, Palacín-Sánchez et al., 2013, Proença et al., 2014, Vergas et al., 2015). The aim is to identify what is taken into account by managers with regards to capital structure decisions
27 represented 43% of the Gross Domestic Product in 2014 (Statistics of Portugal Portal – INE). Thus, it is important to analyse whether intensity of exports causes an impact on firms’ capital structure, in order to help managers with their decisions regarding internationalisation. Chen & Yu (2011) confirm the impact of exports’ intensity on debt, by analysing Taiwanese listed firms. Albaity & Chuan (2013) also confirm that internationalisation causes a negative impact on the debt ratio, by analysing listed firms in Malaysia.
Firms’ capital structure is measured using three proxies: total debt; long-term debt, and; short-term debt ratios, in order to ascertain the impact of debt maturity on results. This study also covers a large period from 2008 until 2014. Thus, the impact of crisis is also taken into account. Following Dessender (2010), I have identified four crisis periods: the year of 2008, the year of the bankruptcy of Lehman Brothers Bank in the USA, followed by the collapse of Banco Português de Negócios and Banco Privado Português in Portugal; the year of 2010, on account of the level of the Portuguese public deficit; the year of 2011, on account of the measures applied by the Troika, and; the year of 2014, which was when the Portuguese deficit was not solved and many companies went bankrupt. Finally, I also consider the heterogeneities of the group analysed. I split the sample into two sub-groups: small and large-size firms, taking into account the firms’ size (smaller or higher than the mean size of all the firms in the sample).
The results show that size (+), profitability (-), non-debt tax shields (+), growth (+), liquidity (-), and age (-) are all important determinants for explaining the total debt of Portuguese exporter SMEs. Furthermore, debt maturity has an impact on results. Size is only relevant for explaining long term debt, while profitability, non-debt tax shields, growth, and age are all significant for only explaining short-term debt. Asset structure and liquidity positively impact long-term debt, but present the opposite relation in the case of short-term debt. Findings prove that Portuguese exporter SMEs prefer to use short-term debt, especially small-sized firms, as was argued by the Bank of Portugal. The main results are consistent with the Pecking Order Theory, highlighting the hierarchy of financing sources. Firms which can use self-finance, adopt lower debt levels to avoid intrusion in the business, whereas firms with limited internal finance need to resort to debt. Furthermore, the Trade-off Theory is also important for explaining exporter SMEs’ capital structure. Fixed assets can be used as collateral in the case of a firm’s bankruptcy.
The rest of the paper is organized follows. Section 2 provides the theoretical background and the hypotheses of this study. Section 3 describes the definition of variables, the data used, and the methodology employed. Section 4 discusses the empirical results and Section 5 concludes the paper.
Theoretical Background and Empirical Hypotheses Framework
28
that maximises a firm’s value. The optimal debt level is reached when there is a balance between tax savings and bankruptcy costs (Modigliani & Miller, 1963, De Angelo & Masulis, 1980).
Using debt allows a firm to access tax benefits due to interest payment (Modigliani & Miller, 1963). Although this benefit only occurs in the case of profitable firms, as only these firms can make use of a tax reduction due to financial charges (Vergas et al., 2015). Relying on the same theory, debt increases a firm’s probability of bankruptcy (Myers, 1977). Debt leads to an increase in costs, and a reduction of net profit. In turn, a firm’s distress risk also increases. Thus, a firm increases debt when benefitting from tax savings, and increases equity when the firm’s risk of failure increases, thus reaching an equilibrium (Myers, 1984).
From another perspective, debt can decrease the agency costs between the principal and managers (Jensen & Meckling, 1976). By using debt, a firm’s cash flow decreases and thus the firm’s agent has less free cash flows to invest in non-productive investments. Therefore leverage is seen as a disciplining effect of managers. However it may lead to other agency conflict between financial creditors and principals (Jensen & Meckling, 1976). Creditors may restrict a firm’s investments, leading to under-investment. This problem may be enhanced in the case of the international involvement of a firm, as creditors may have more difficulty in controlling and monitoring managers (Chen & Yu, 2011).
Agency costs are caused by information asymmetries. Not all shareholders have the same level of information and they can use it to their own interest (Vergas et al., 2015). This leads to the Pecking Order Theory. Myers (1984) and Myers & Majluf (1984) argue that there is no optimal capital structure, due to lack of information. Firms have a hierarchical preference of financing sources. Firstly, firms, especially SMEs, prefer internal capital to finance their activity to avoid uncertainties and intrusion in the business (Proença et al., 2014). When firms need to look for external capital, they prefer debt rather than equity (Jordan et al., 1998). Fama & French (2002) argue that issuing shares has costs, as shareholders can lose control of the firm. Furthermore, a company can be undervalued by the market, allowing “new investors to appropriate a higher value than the fair one” (Vergas et al., 2015:7). Debt is seen as a sign of a firm’s quality, as companies with financial problems present low debt ratios, on account of having difficulty in accessing debt (Vieira & Novo, 2010). In fact, European SMEs find that their access to debt is limited (EU Commission, 2003). This may be because SMEs’ accounting information is normally not audited, and therefore banks may not perceive the firm’s real value, due to lack of information.
29 According to current research, the choice of capital structure is affected by a combination of factors related with firms’ characteristics and environment (Vieira, 2013). Based on previous research (e.g., Psillaki & Daskalaskis, 2009, Bhaird & Lucey, 2010, Palacín-Sánchez et al., 2013, Mateev et al., 2013, Proença et al., 2014, Vergas et al., 2015), this study focusses on such factors as size, profitability, asset structure, non-debt tax shields, growth, liquidity, and age. Furthermore, I include two new determinants, namely: exports’ intensity and a dummy variable to detect the impact of crisis period, both of which are relevant factors, bearing in mind the sample structure and the period analysed.
Firms’ size is traditionally considered for capital structure choices. Its effect is ambiguous (Rajah & Zingales, 1995). From one side, size can have a positive impact on debt, as it is usually taken as an inverse proxy of the probability of bankruptcy (Palacín-Sánchez et al., 2013). Larger firms have higher sales volume and can benefit from economies of scale which can be translated into higher EBIT. The Trade-off Theory suggests that these firms have advantages from applying more leverage on their capital structure, due to tax savings (Albaity & Chuan, 2013). The Pecking Order Theory also proposes that information from these firms is more transparent, and is of greater quality and reliability. As a result, their access to debt is easier when compared with small firms, and the cost of debt is usually smaller. From the other side, larger firms may prefer equity rather than debt, due to the hierarchy of financing sources proposed by Myers & Majluf (1984). Therefore, size can lead to a negative impact on debt ratio (Chen & Yu, 2011, Cortez & Susanto, 2012). For small-size firms, internal equity is restricted, as retained earnings are not normally sufficient. This problem, combined with information asymmetries and larger bankruptcy costs and financial distress all restrict smaller firms’ access to debt and increase their transaction costs for financing externally (Rajan & Zingales, 1995). Previous studies in the area of SMEs found a positive relationship between debt intensity and firm size (see e.g. Fama & French, 2002, Psillaki & Daskalaskis, 2009, Bhaird & Lucey, 2010, Fauzi et al., 2013, Mateev et al., 2013, Palacín-Sánchez et al., 2013, Proença et al., 2014). These arguments suggest the first hypothesis:
Hypothesis 1: Firm size is positively related to debt intensity.
The impact of firm size can depend on debt maturity. As explained above, smaller firms tend to have asymmetric information problems and thus experience difficulty in accessing long-term debt. Therefore these companies usually use short-term debt. As a result, it is expected that size positively affects long-term debt, but is negatively related to short-term debt. Palacín-Sánchez et al. (2013), and Proença et al. (2014) found similar results in their studies of SMEs. Hypothesis 1 is divided into two:
Hypothesis 1a: Firm size is positively related to long-term debt.
30
Another feature that influences firms’ capital structure is profitability. On the one hand, as a consequence of the Pecking Other Theory, higher profitability leads to an increase in internal funds, and thus a firm needs less debt (Myers, 1984). Retained earnings, which are the first option of financing, are sufficient to sustain such a firm’s activity. Therefore, these firms may use less debt, which is the second preferential source of financing, and having even less new equity is the last option of funds. This suggests a negative relationship between profitability and debt. On the other hand, the Trade-off Theory argues that profitable firms benefit from tax savings, due to the payment of interest (Modigliani & Miller, 1958). As a result, firms with a high level of profitability should increase debt level, to take advantage of financial benefits. Furthermore, in the Agency Costs Theory, debt is used as a mechanism to monitor managers and to reduce information asymmetry (Jensen, 1986). Previous studies studying SMEs are consistent and support the Pecking Order Theory (e.g., see Psillaki & Daskalaskis, 2009, Cortez & Susanto, 2012, Fauzi et al., 2013, Mateev et al., 2013, Palacín-Sánchez et al., 2013, Proença et al., 2014, Vergas et al., 2015). As a result, I expect a negative relationship between profitability and debt intensity. Furthermore, signs between long and short term debt have not being observed (Palacín-Sánchez et al., 2013).
Hypothesis 2: Profitability is negatively related to debt intensity.
Asset structure is another determinant of debt intensity. To make new investments either to substitute machinery, or to increase production, firms need to look to external capital, as internal funds are usually insufficient. Fixed assets are considered to offer more security than current assets, as they can be used as collateral in the case of a firm’s bankruptcy (Psillaki & Daskalaskis, 2009). Framed by the Trade-Off Theory, a positive relationship between asset structure and debt is expected (Rajan & Zingales, 1995). Under the Pecking-Order Theory, this positive relationship is also confirmed. Tangible assets can reduce asymmetric information, as it results in having a higher liquidation value (Rajan & Zingales, 1995). Therefore, creditors are exposed to less risk by lending money to firms with a greater value of tangible assets, which makes their access to debt easier (Proença et al., 2014). Furthermore, according to the Agency Costs Theory, tangible assets reduce a firm’s cash flow, and thus the agency costs between the principal and managers. A positive relationship between asset structure and debt is expected. Previous studies, such as those of Psillaki & Daskalaskis (2009), Bhaird & Lucey (2010), Cortez & Susanto (2012), Mateev et al. (2013), Palacín-Sánchez et al. (2013), Proença et al. (2014), and Vergas et al. (2015) all found this relationship.
Hypothesis 3: Asset structure is positively related to debt intensity.
31 Hypothesis 3a: Asset structure is positively related to long-term debt.
Hypothesis 3b: Asset structure is negatively related to short-term debt.
Non-debt tax shields measures such as depreciation and amortization over total assets. It is usually a substitute for debt’s financial benefits. Based on the Trade-Off Theory, this ratio should negatively impact debt intensity, as firms can benefit from tax savings by using depreciation (De Angelo & Masulis, 1980, Cortez & Susanto, 2012). De Miguel & Pindado (2001) found a negative relationship between depreciation and amortization and debt intensity, even though previous literature has found the opposite relationship (e.g. Vergas et al., 2015). Fixed assets can be used as collateral and thus make access to debt easier (Proença et al., 2014). As depreciation result from the amount of fixed assets, a non-debt tax shield can be positively related to debt intensity. Titman & Wessels (1988) did not find any relationship between the effect of depreciation and amortization on debt level. The effect of non-debt shield on debt maturity has not been previously analysed by researchers. This leads to the following hypothesis:
Hypothesis 4: Non-debt tax shields is positively related to debt intensity.
Growth is another determinant that influences firms’ debt level, although, it may have an ambiguous effect on debt. On the one hand, firms with high growth usually need more funding. According to the Pecking Order Theory, as internal resources may be insufficient, managers tend to look for debt to fulfill their financial needs (Vergas et. al, 2015). Furthermore, high growth sends a signal to creditors that the company is not going bankrupt (Proença et al., 2014). On the other hand, the Trade-off Theory suggests that firms with growth usually resort less to debt to reduce their uncertainties and the probability of default (Rajan & Zingales, 1995). Furthermore, such firms are subject to under-investment, which in turn leads to agency costs between the principal and the agent (Palacín-Sánchez et al., 2013). Generally, the empirical evidence found a positive relationship between growth and debt intensity (Palacín-Sánchez et al., 2013, Proença et al., 2014, Vergas et al., 2015). The effect of growth on debt maturity is inconclusive. Therefore, Hypothesis 5 which follows will not be divided after all.
Hypothesis 5: Growth is positively related to debt intensity.
Liquidity is a firm’s ability to convert assets into cash, which is one ratio of a firm’s short-term solvency. Higher liquidity has a negative impact on debt intensity, as is that case when a firm has more funds to finance its investments. The Pecking Order Theory suggests that firms prefer to use self-finance, rather than debt (Myers, 1984). Proença et al. (2014) found this relation, which leads to the following hypothesis:
Hypothesis 6: Liquidity is negatively related to debt intensity.
32
these firms present a lower probability of failure. Thus, such firms may have easier access to long-term debt, with a smaller cost of debt (Proença et al., 2014). Hypothesis 6 is divided into two, as follows:
Hypothesis 6a: Liquidity is positively related to long-term debt.
Hypothesis 6b: Liquidity is negatively related to short-term debt.
A firm’s life cycle also explains the supply of capital. Older firms present a greater ability for self-finance, while young firms have insufficient internal funds, and thus need to look for external capital to finance their sustainability. Under the Pecking-Order Theory, older firms use less debt to finance their activity (Palacín-Sánchez et al., 2013). Furthermore, young firms usually have difficulties in accessing public markets, and thus debt is the only way to finance the firm (Vieira, 2013). This negative relationship between debt and age was found in previous studies, such as those of Jordan et al. (1998), Bhaird & Lucey (2010), and Palacín-Sánchez et al. (2013).
Hypothesis 7: Age is negatively related to debt intensity.
Following Chen & Yu (2011), who studied Taiwanese listed firms, I also add a new factor: exports’ intensity. SMEs are not a homogeneous group. Therefore, exporters may experience a different impact on their capital structure than other SMEs. According to Proença et al. (2014), SMEs usually use short-term debt to pay their suppliers, as they receive the latter from customers. For exporter SMEs, this problem is solved, as credit conditions of sales’ exports is different to that of sales to the domestic market. Due to the distance and differences between the legal system of countries, firms usually ask for cash-in-advance in the case of exports. Therefore, their average receipt deadline is smaller (Bank of Portugal). This suggests a negative relationship between exports’ intensity and debt. Furthermore, international activities reduce firms’ earnings variability, and lower bankruptcy costs (Chen & Yu, 2011). Under the Pecking-Order Theory, although exporters are usually larger firms with more transparent information, these firms prefer to use self-finance, rather than use debt. Chen & Yu (2011) and Albaity & Chuan (2013) found that international diversification has a negative impact on debt levels. As a result, the following hypothesis naturally follows:
Hypothesis 8: Export’s intensity is negatively related to debt intensity.
Finally, as the period analysed includes years of recession and of expansion, analysing the crisis effect is relevant. Proença et al. (2014) confirm that crisis has a significant impact on debt intensity, especially on short-term debt. After 2008, Portuguese SMEs had difficulty in accessing loans. Spreads have increased, leading to some financial problems for SMEs (Bank of Portugal). Vergas et al. (2015) also found that for Portuguese listed firms, the relevance of those determinants that explain debt intensity depend on the periods analysed, namely: before or during a financial crisis. Therefore, the following hypothesis is established:
33 Data and Empirical Model
Data
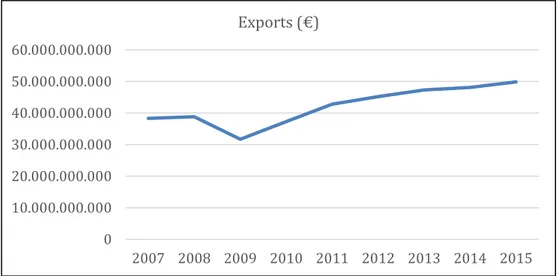
This study covered Portuguese exporter SMEs from 2008 until 2014. Around 99% of Portuguese firms are SMEs (Proença et al., 2014). Furthermore, the predominant type of financing in Portugal is through debt. Around 72% of firms’ assets are financed with debt (Statistics of Portugal Portal – INE). These facts give relevance to the analysis of the capital structure of Portuguese SMEs. As the size of the domestic market in Portugal, is small, companies need to develop international activities to sustain their growth. I focus only on export manufacturing firms, as exporter SMEs present unique characteristics when compared to firms that only sell to the domestic market. Furthermore, exporters make an important contribution to the overall health of the overall economy, representing around 43% of the Portuguese gross domestic product in 2014 (Statistics of Portugal Portal – INE). During the current financial crisis, which started in 2008/2009, exportations have increased (see Figure 1), and have made a vital contribution to the Portuguese economy’s health. Finally, by analysing a single country – Portugal, I assure the country-specific laws and characteristics, thus avoiding biased results due to country differences (Joh, 2003).
Source: Statistics of Portugal Portal – INE (https://www.ine.pt/)
Figure 1 - Evolution of Portuguese Exports
The sample used for this study was obtained from the SABI database of Bureau Van Dijk. I have selected SMEs companies that exported part, or all their production during the period analysed. Service firms and primary industries were excluded, as they have different characteristics with regards to international expansion. Inactive firms, or those that went bankrupt were deleted to avoid misspecifications, as were those that were acquired by another firm, or that no longer export, as were financial firms. Observations that present questionable values were also deleted, for
0 10.000.000.000 20.000.000.000 30.000.000.000 40.000.000.000 50.000.000.000 60.000.000.000
34
instance, a debt ratio higher than 150%, as this means technical bankruptcy. Only firms with relevant information available for the period of 2008-2014 were used for the sample.
The final sample is an unbalanced sample of 277 SMEs, with a total of 1,863 observations over a period of 7 years (2008-2014). Vieira & Novo (2010) studied 51 companies over a period of 6 years, as they used the classification criteria of SMEs with available information in the SABI database, and thus the total number of companies is limited. Furthermore, the start date chosen is 2008, as before this year sales data was not separated into domestic and exports sales.
Most of the companies in the sample belong to the metal and non-metal products industries, such as clothing, textiles, rubber & tyres, machinery, and furniture/home furnishings, and are located in Aveiro, Porto, Braga and Leiria. When the sample is split into two sub-samples, taking into account the mean value of the firms’ size, 50.67% are small firms, and 49.33% are large-sized companies.
Definition of Variables
All the dependent and explanatory variables used in this study are based on book value, as those companies included in the sample are all non-listed firms. The definition of variables followed previous studies, such as, among others, Psillaki & Daskalaskis (2009), Bhaird & Lucey (2010), Palacín-Sánchez et al. (2013), Mateev et al. (2013), Proença et al. (2014), and Vergas et al. (2015).
The dependent variable of the study is debt intensity. I use three alternative measures, as did Haan (2012), Psillaki & Daskalaskis (2009), Palacín-Sánchez et al. (2013), and Handoo & Sharma (2014): 1) Total debt ratio (TDebt) is measured as the quotient between total liabilities over total assets; 2) Long term debt ratio (LDebt) is the ratio of long-term liabilities over total assets, and; 3) Short term debt ratio (SDebt) presents the portion of the firm’s total assets that is financed from current liabilities. Many studies use only a single variable and focus on the level of total debt.
The independent variables are the firms’ determinants of their capital structure. This study focusses on the effects of nine determinants: exports intensity; size; profitability; asset structure; non-debt tax shields; growth; liquidity; age, and; financial crisis.
Following Chen & Yu (2011), I measure exports intensity (Exports) as the ratio of export sales to total sales. This is a proxy of the degree of a firm’s international activity. Export sales include sales to both European and Non-European markets.
35 Asset structure (AS) can be measured using net fixed assets divided by total assets (Palacín-Sánchez et al., 2013, Handoo & Sharma, 2014), or by adding inventories to fixed assets, as inventories can have significant value at the time of the liquidation of a company (Vergas et al., 2015). In this study, I studied both variables, and realised that the first one is more relevant to explain a firm’s capital structure (see Table 1: Panel B). Some researchers also include a ratio of non-debt tax shields (NDTS), measured as the quotient between depreciations and total assets (Proença et al., 2014, Vergas et al., 2015). I also have included it.
Following Handoo & Sharma (2014), growth is the annual change of total assets. Some researchers use the market-to-book value (Haan, 2012), although this variable is not available for non-listed firms, such as SMEs. Liquidity (Liq) can be measured by dividing total current assets by total current liabilities (Handoo & Sharma, 2014), or by dividing total current assets by total assets (Haan, 2012). When analysing the Correlation Matrix (Table 1: Panel B), the second variable is highly correlate with asset structure measured by fixed assets divided by total assets. I therefore chose the first measure as a proxy of liquidity.
Age is defined as being the number of years that the firm has been operating (Palacín-Sánchez et al., 2013). Finally, Dcrisis is a dummy variable, which equals one when there is a recession year, and zero otherwise. I have followed Dessender (2010) to identify a crisis period. Periods with a negative market return (the difference between PSI 20 return and free-risk rate return) were considered to be recession periods, while the others were considered to be periods of expansion. Information to calculate the Portuguese market index return (PSI 20) came from Bank of Portugal.
Source: Statistics of Portugal Portal – INE (https://www.ine.pt/)
Figure 2 - Portuguese Market Index Return
-80,00% -60,00% -40,00% -20,00% 0,00% 20,00% 40,00%
R
O
PE
AN
J
O
U
RN
AL O
F
M
A
N
AG
E
M
E
N
T
S
T
U
D
IE
S,
V
O
L
22
, ISSU
E
1
. 2
0
1
7
. 2
5
-49
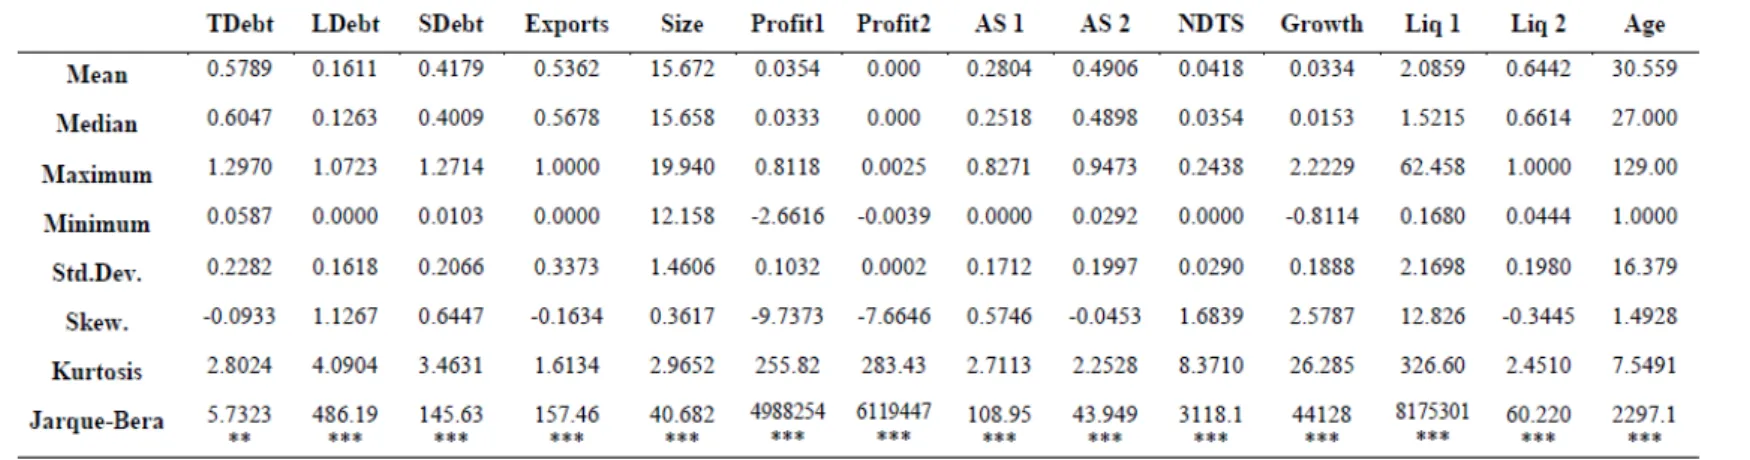
Panel A presents descriptive statistics, namely mean, maximum, minimum, standard deviation, skewness and kurtosis, for the variables include in the model: Tdebt (total liabilities over total assets), LDetb (total long term liabilities over total assets), SDebt (total current liabilities over total assets) on exports (export sales over total
sales), size (natural logarithm of the firm’s assets), profit 1 (return on assets ratio), profit 2 (return on sales), AS 1 (net fixed assets over total assets) AS 2 (net fixed assets plus inventories over total assets), NDTS (depreciation over total assets), growth (annual change in total assets), Liq 1 (total current assets over total current liabilities) Liq 2 (total current assets over total assets), age (natural logarithm of the number of years since the firmfoundation until the year of analysis).
*, **, *** Significant at the 10%, 5% and 1% levels, respectively.
Table 1 – Summary Statistics
T
H
E
E
U
RO
PE
AN
J
O
U
RN
AL O
F
M
A
NA
G
E
M
E
N
T
S
T
U
D
IE
S,
V
O
L 2
2
, ISSU
E
1
. 2
01
7.
25
-49
37
Panel B reflects the correlation matrix for all the following variables: Tdebt (total liabilities over total assets), LDetb (total long term liabilities over total assets), SDebt (total current liabilities over total assets) on exports (export sales over total sales), size (natural logarithm of the firm’s assets), profit 1 (return on assets ratio), profit 2
(return on sales), AS 1 (net fixed assets over total assets) AS 2 (net fixed assets plus inventories over total assets), NDTS (depreciation over total assets), growth (annual change in total assets), Liq 1 (total current assets over total current liabilities) Liq 2 (total current assets over total assets), age (natural logarithm of the number of years since the firmfoundation until the year of analysis).
*, **, *** Significant at the 10%, 5% and 1% levels, respectively.
Table 1 – Summary Statistics
38
During the period under analysis, I have identified four crisis periods, as it is presented in Figure 2. The year of 2008, the year of the bankruptcy of Lehman Brothers Bank in USA, was followed by the collapse of Banco Português de Negócios and Banco Privado Português in Portugal, and the PSI 20 return dropped 66.3%. Then in 2010, the PSI 20 again fell by 8.9%, on account of the Portuguese public deficit, and in 2011 it dropped 31.2%, due to measures applied by the Troika to the Portuguese market. In 2014 PSI 20 return dropped again 28.8%, as the Portuguese deficit was not solved, and diverse companies went bankrupt, and the unemployment rate increased.
Table 1 above presents the summary statistics of the variables presented above. Panel A shows descriptive statistics: mean, maximum, minimum, standard deviation, skewness and kurtosis. Panel B shows the correlation coefficients. Analyzing this table the following facts emerge:
1) On average, 58% of the firm’s assets are financed through external capital, namely debt. This is an interesting fact, as in 2008 the Statistics of Portugal Portal (INE) found that Portuguese firms use around 72% of debt to finance their activity. Furthermore, Vieira (2013) found that the debt level of Portuguese listed firms was 69%, and Proença et al. (2014) found that Portuguese SMEs used around 67% of debt to finance their activity. Therefore, exporter SMEs use less debt to finance their activity than domestic SMEs, and, after 2008 Portuguese SMEs have resorted less for debt, especially after 2010 (Proença et al., 2014 analysed Portuguese SMEs during the period of 2007-2010).
2) On average, short-term debt is more used than long-term debt. This fact is also found in the study of Proença et al. (2014: 186) “Portuguese SMEs are characterised by using more STD than LTD, in order to face their working capital needs”. Some companies do not present long-term debt, at least during one year of the period analysed.
3) The percentage of export sales is 54% on average, meaning that the majority of firms in the sample export more than half their productivity. Some companies in the sample export 100% of their sales, while others did not export during one year of the period analysed.
4) Portuguese exporter SMEs present, in average, positive profitability, growth, and liquidity.
5) Fixed assets represent, on average, 28% of total assets. This value increases to 49% if inventories are included, suggesting that inventories have a significant impact on total assets.
6) The impact of depreciations over total sales is positive, suggesting that these companies make new investments.
7) The correlation between total debt and short-term debt, and between profitability 1 and 2, and also between asset structure 1 and 2 is high, but as these ratios are alternative ratios, this correlation is not relevant.
39 9) The correlation between total debt and the others variables present the expected signs, except for size (although the expected sign of debt to short and long-term debt are confirmed). Exports intensity is not statistically correlated with debt intensity, except for short-term debt, contrary to my expectations.
10) None of the variables included in the models are highly correlated, at least not to a significant extent.
Figure 3 provides the evolution of the average debt ratio (total, long-term and short-term debt over total assets), and also of exports intensity over the period under analysis.
Figure 3 - Evolution of debt and exports intensity
Total debt ratio shows a constant tendency over the period under analysis, with a small decrease after 2010. Long-term and short-term ratios also present, on average, similar values throughout the period analysed. When analyzing exports intensity, I can concluded that it has not followed debt ratio. For during the period studied, exports have increased, which suggests that firms have found the possibility to growth and sustain their activity in other markets, which was more difficult in the Portuguese market, especially during the financial crisis. The years in red are classified as being years of recession.
0,00% 10,00% 20,00% 30,00% 40,00% 50,00% 60,00% 70,00%
2008 2009 2010 2011 2012 2013 2014
40
The model
In Section 2, numerous empirical hypotheses were formulated to explain the capital structure of exporter SMEs in Portugal. Therefore, the following model will be regressed:
𝐷𝑒𝑏𝑡𝑖,𝑡
= 𝛼 + 𝛽1× 𝐸𝑥𝑝𝑜𝑟𝑡𝑠𝑖,𝑡+ 𝛽2× 𝑆𝑖𝑧𝑒𝑖,𝑡+ 𝛽3× 𝑃𝑟𝑜𝑓𝑖𝑡𝑖,𝑡+ 𝛽4× 𝐴𝑆𝑖,𝑡+ 𝛽5× 𝑁𝐷𝑇𝑆𝑖,𝑡+ 𝛽6
× 𝐺𝑟𝑜𝑤𝑡ℎ𝑖,𝑡+ 𝛽7× 𝐿𝑖𝑞𝑖,𝑡+ 𝛽8× 𝐴𝑔𝑒𝑖,𝑡+ 𝛽9× 𝐷𝑐𝑟𝑖𝑠𝑖𝑠𝑖,𝑡+ 𝑈𝑖+ 𝜀𝑖,𝑡
Debt intensity is regressed against exports intensity, size, profitability, asset structure, non-debt tax shields, growth, liquidity, age, and crisis. “i” represents the individual firms, and “t” the year analyzed; “U” is also added to incorporate the fixed effects of firms (cross-section), and 𝜀 represents the error of the model.
The model was estimated using the ordinary least square methodology (OLS), with fixed effects for firms. I have also tested the model using random effects and then used the Hausman test to choose which model to use in the regression. The results are present in the next table.
TDebt LDebt SDebt
Hausman(𝝌𝟐) 192.574 *** 34.520 *** 163.612 ***
*, **, *** Significant at the 10%, 5% and 1% levels, respectively.
Table 2 -The Hausman Test
As it can be seen in Table 2, the most accurate model for estimating the impact of the determinants on the firm’s capital structure is the model with fixed effect, with a 1% significant level.
Finally, as size can cause an impact on results, I decided to split the sample into two sub-samples to have more homogeneous groups. The first group – small firms, includes companies with a size less than the mean of the firm size of the total sample, and the second one – large-sized firms, includes the others.
41
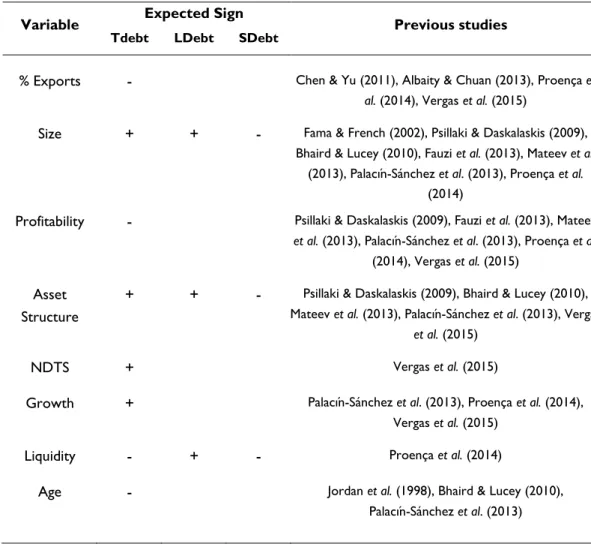
Variable Expected Sign Previous studies
Tdebt LDebt SDebt
% Exports - Chen & Yu (2011), Albaity & Chuan (2013), Proença et
al. (2014), Vergas et al. (2015)
Size + + - Fama & French (2002), Psillaki & Daskalaskis (2009),
Bhaird & Lucey (2010), Fauzi et al. (2013), Mateev et al. (2013), Palacín-Sánchez et al. (2013), Proença et al.
(2014)
Profitability - Psillaki & Daskalaskis (2009), Fauzi et al. (2013), Mateev
et al. (2013), Palacín-Sánchez et al. (2013), Proença et al.
(2014), Vergas et al. (2015)
Asset Structure
+ + - Psillaki & Daskalaskis (2009), Bhaird & Lucey (2010), Mateev et al. (2013), Palacín-Sánchez et al. (2013), Vergas
et al. (2015)
NDTS + Vergas et al. (2015)
Growth + Palacín-Sánchez et al. (2013), Proença et al. (2014),
Vergas et al. (2015)
Liquidity - + - Proença et al. (2014)
Age - Jordan et al. (1998), Bhaird & Lucey (2010), Palacín-Sánchez et al. (2013)
Expected relationship (+ positive or – negative) between the debt ratio (total, long term and short term debt over total assets) and the determinants included in the sample, and previous studies that suggest that relationship.
Table 3 – Expected signs
Empirical Results
42
TDebt LDebt SDebt
C 0.3232 * -0.3980 ** 0.7174 ***
Exports -0.0127 -0.0161 0.0031
Size 0.0234 ** 0.0310 *** -0.0074
Profitability -0.2097 *** -0.0190 -0.1903 ***
Asset Structure -0.0050 0.1408 *** -0.1454 ***
NDTS 0.50567 *** 0.1410 0.3528 **
Growth 0.0613 *** 0.0213 0.0396 ***
Liquidity -0.0085 *** 0.0132 *** -0.0217 ***
Age -0.0033 *** 0.0004 -0.0036 ***
DCrisis -0.0025 -0.0041 0.0017
Observations 1863 1863 1863
Adj. R squared 86.92% 71.01% 79.63%
F-statistic 44.408 *** 17.001 *** 26.544 ***
This table presents the estimates of debt: column 1 - Tdebt (total liabilities over total assets), column 2- LDetb (total long term liabilities over total assets), column 3 - SDebt (total current liabilities over total assets) on exports (export sales over total sales), size (natural logarithm of the firm’s assets), profitability (return on assets ratio), asset structure (net fixed assets over total assets), NDTS (depreciation over total assets), growth (annual change in total assets), liquidity (total current assets over total current liabilities), age (natural logarithm of the number of years since the firm foundation until the year of analysis), DCrisis (dummy variable which equals to one when is a recession year and zero otherwise).
*, **, *** Significant at the 10%, 5% and 1% levels, respectively.
Table 4 –Determinants of Exporters SMEs’ Capital Structure
Analyzing the adjusted R squared (R2), the estimated model explain 87% of the total debt ratio,
71% of the long-term debt, and 80% of the short-term debt. These results are in line with those obtained by Proença et al. (2014), and Vergas et al. (2015) for the Portuguese market. Furthermore, the F-statistic presents 1% significance, confirming the relevance of the model tested.
43 informational opacity problems. With regards to short-term, debt size looks irrelevant. The Bank of Portugal argues that SMEs usually use more short-term debt. The results suggest that banks do not take into account a firm’s size in their decision to give short-term credit to firms. Profitability negatively influences total and short-term debt ratios, but is irrelevant for long-term ratio. Hypothesis 2 is validated. This relationship is consistent with the view of the Pecking Order Theory proposed by Myers (1984), which argues that firms prefer internal capital rather than use external capital due to a higher risk of failure. The majority of the studies also find the same results, such as, for example: Psillaki & Daskalaskis (2009), Fauzi et al. (2013), Mateev et al. (2013), Palacín-Sánchez et al. (2013), Proença et al. (2014), and Vergas et al. (2015). Furthermore, the results also show the preference for profitability for firms with short-term debt, as the effect of profitability in the case of long-term debt is not statistically significant, as found by Proença et al. (2014).
The proxy of asset structure is statistically insignificant for explaining total debt ratio, but presents a 1% significance level for explaining long and short-term debt. Hypotheses 3a and 3b are validated. Creditors borrow long term funds more easily when a firm invests in fixed assets, as these can be used as collateral in the case of a firm’s bankruptcy. Furthermore, firms with high levels of fixed assets opt for short-term debt less. This conclusion is supported by the Trade-off and Pecking Order Theories, and are in line with results found by Vieira & Novo (2010), Palacín-Sánchez et al. (2013), and Proença et al. (2014). With regards to non-debt tax shields, Hypothesis 4 is validated, as non-debt tax shields positively impact total debt ratio and short-term ratio. Amortization and depreciation are connected with fixed assets, as firms look for external capital to modernise their fixed assets. Similar results were found by Vergas et al. (2015).
The findings show a positive impact of growth on debt intensity. To sustain their growth, firms need opt for debt, as internal funds are usually insufficient. This result is in line with the Pecking Order Theory. It was also verified by Palacín-Sánchez et al. (2013), Proença et al. (2014), and Vergas et al. (2015). Hypothesis 5 is validated. With regards to debt maturity, growth positively impacts short-term debt at a 1% significance level. This result confirms the Bank of Portugal, which argues that Portuguese SMEs usually use more short-term debt. The variable liquidity shows a negative sign in relation to total debt ratio and short-term debt ratio, and a positive relation with long-term debt ratio, validating Hypotheses 6, 6a and 6b. Similar results were found by Proença et al. (2014). Exporter SMEs with high liquidity usually hold less debt and present higher cash levels. In the Pecking Order Theory, firms prefer to use internal funds rather than debt, or issue more equity. The Trade-off Theory states that more liquid firms present less distress problems and have easier access to long-term debt, explaining the positive relation between long-term debt and liquidity.
44
of life, and personal funds are also limited. This result is also confirmed by Jordan et al. (1998), Bhaird & Lucey (2010), Palacín-Sánchez et al. (2013).
Finally, the sales exports and crisis variables are not significantly relevant in the model proposed. Hypotheses 8 and 9 are not confirmed. It was expected that sales exports were easily transformed into cash, and thus would negatively impact debt intensity. However, Table 1 (Panel B: Correlation Matrix) shows that exports intensity and liquidity are not correlated, and that neither are exports intensity and debt intensity, which explains this finding. Different results were found by Chen & Yu (2011) and Albaity & Chuan (2013). Regarding crisis, Proença et al. (2014) confirm that crisis impacts debt intensity. Although they consider the years of 2007-2008 as years without crisis, and 2009-2010 as years with crisis, I use a different methodology to consider crisis periods, and this variable is statistically insignificant for explaining debt. This can be explained as some researchers consider all the period analysed (2008-2014) to be crisis periods, and thus the results are insignificant during the period covered.
In synthesis, the results show the preference of firms to opt for funds: first firms use internal capital and thus debt, which is in line with the Pecking Order Theory. Furthermore, the Trade-off Theory also plays an important role for the capital structure of Portuguese exporter SMEs. Companies with higher levels of fixed assets issue more debt, which can be used as collateral in the case of bankruptcy.
To detect if heterogeneities such as the effect of size influence results, the sample was split into two: small firms (firms with a size less than the average of the size of all the sample), and large firms (the remainder). In a univariate analysis (Table 5) used to see the differences in debt intensity of both firms, results show that small firms hold more debt, especially short-term debt than large firms. These results are consistence with the Pecking Order Theory, as small firms present less retained earnings, and therefore need to opt for debt to sustain their activity and growth.
TDebt LDebt SDebt
Small Firms 0,596498 *** 0,144793 *** 0,451834 ***
Large Firms 0,560866 0,178505 0,382361
This table presents the mean values of Tdebt (total liabilities over total assets), LDetb (total long term liabilities over total assets), SDebt (total current liabilities over total assets) of small and large firms included in the sample. Small firms are firms with a size less than the average of the total sample size.
*, **, *** indicate a difference in means between family and non-family firms at the 1%, 5% and 10% significance levels, respectively.
45 Table 6 show results from regression of the model proposed for small and large firms, using the ordinary least squares method, with fixed effects of firms.
Splitting the sample into small and large firms, taking into account firms’ size, previous results are validated for total debt ratio. For long-term debt ratio, some determinants, which were irrelevant to explain the long-term debt to total sample ratio, are now statistically significant, such as non-debt tax shields and growth that positively impact capital structure. Furthermore, the results suggest that small firms have more difficulty in accessing long-term debt, due to information asymmetries, as expected in the Pecking Order Theory. Regarding adjusted R2, the results are in
line with the previous analysis presented in Table 4, and with previous studies on this topic.
Small Firms Large Firms
TDebt LDebt SDebt TDebt LDebt SDebt
C 0.6811 *** 0.0094 0.6708 *** 0.8050 *** 0.1327 ** 0.6724 ***
Exports -0.0109 -0.0068 -0.0045 -0.0035 -0.0415 0.0380
Profitability -0.1520 *** 0.0348 -0.1862 *** -0.4596 *** -0.2924 *** -0.1672 ***
Asset Structure 0.0321 0.2119 *** -0.1789 *** -0.0781 0.1398 *** -0.2179 ***
NDTS 0.7392 *** 0.4181 ** 0.3003 -0.2036 -0.6496 *** 0.4459 **
Growth 0.0725 *** 0.0537 *** 0.0181 0.0558 *** 0.0278 * 0.0280 **
Liquidity -0.0051 *** 0.0085 *** -0.0135 *** -0.0256 *** 0.0357 *** -0.0613 ***
Age -0.0036 ** 0.0017 -0.0053 *** -0.0043 *** -0.0002 -0.0041 ***
DCrisis -0.0029 -0.0044 0.0019 0.0024 0.0014 0.0010
Observations 944 944 944 919 919 919
Adj. R squared 89.66% 70.06% 77.97% 85.01% 76.31% 85.88%
F-statistic 49.685 *** 14.133 *** 20.870 *** 33.949 *** 19.715 *** 36.330 *** This table presents the estimates of debt: Columns 1 and 4 - Tdebt (total liabilities over total assets), Columns 2 and 5 - LDetb (total long term liabilities over total assets), Columns 3 and 6 - SDebt (total current liabilities over total assets) on exports (export sales over total sales), size (natural logarithm of the firm’s assets), profitability (return on assets ratio), asset structure (net fixed assets over total assets), NDTS (depreciation over total assets), growth (annual change in total assets), liquidity (total current assets over total current liabilities), age (natural logarithm of the number of years since the firm foundation until the year of analysis), DCrisis (dummy variable which equals to one when is a recession year and zero otherwise). Small firms are firms with size less than the average of the total sample size.
*, **, *** Significant at the 10%, 5% and 1% levels, respectively.
46
Conclusion
This paper analyses the influence of a number of firm characteristic determinants on SMEs capital structure choices. Using a panel data for a set of 277 exporter SMEs in Portugal, covering a period from 2008 until 2014, the results indicate that firms’ size, profitability, asset structure, non-debt tax shields, growth, liquidity, and age are the most important determinants for explaining exporter SMEs’ capital structure. Furthermore, exports intensity and crisis effect are irrelevant for explaining how firms finance their needs. These findings are consistent with the Pecking Order Theory, namely: firms have a hierarchical preference for using funds. Firms prefer to use personal funds, or self-finance to avoid intrusion into their business. If these sources of finance are scarce, then firms need to opt for external capital, and their preference is debt, rather than a new issue of shares. Furthermore, the Trade-off Theory is also important for explaining Portuguese exporter SMEs’ capital structure. Fixed assets can be used as collateral in the case of a firm’s failure. Similar results were found for Portugal by Vieira & Novo (2010), Proença et al. (2014), and Vergas et al. (2015).
The results also show different signs for the relation of the determinants included in the model and debt maturity. Size is only relevant for explaining long-term debt, while profitability, non-debt tax shields, growth, and age are only significant for explaining short-term debt. Asset structure and liquidity positively impact long-term debt, but present the opposite relation for short-term debt. The findings prove that Portuguese exporter SMEs prefer to use short-term debt, as was argued by the Bank of Portugal. Additionally, the sample data was subdivided into two to capture size effect and the results suggest that small firms hold more debt, especially short-term debt, and have difficulty in looking for long-term debt, due to information asymmetries.
47 It would be interesting for future research to compare exporter with non-exporter firms, to analyse the difference in results. It would also be interesting to extend this study to other countries to examine the robustness of the results.
References
Albaity, M., and Chuan, A., 2013. Internationalization and capital structure: Evidence from Malaysian manufacturing firms. Asian Journal of Finance and Accounting, 5(2), 329-342.
Arellano, M., and Bond, S., 1991. Some tests of Specification for panel data: Monte Carlo evidence and an application to employment equations. The Review of Economic Studies, 58(2), 277-297.
Baker, M., and Wurgler, J., 2002. Market timing and capital structure. Journal of Finance, 57(1), 1-32.
Bhaird, C., and Lucey, B., 2010. Determinants of capital structure in Irish SMEs. Small Business Economics. 35, 357-375.
Booth, L. Aivazian, V. Demirgüç-Kunt, L., and Maksimovic, V., 2001. Capital structures in developing countries. Journal of Finance, 56, 87–130.
Campenhout, G., and Caneghem, T., 2013. How did the notional interest deduction affect Belgian SMEs’ capital structure? Small Business Economics, 40, 351-373.
CCP, 2012 and 2015. Barómetro PME. Comércio e Serviços. Confederação do Comércio e Serviços.
Chen, C., and Yu, C., 2011. FDI, Export, and Capital Structure. Management International Review, 51 (3), 295-320.
Cortez, M., and Susanto, S., 2012. The Determinants of Corporate Capital Structure: Evidence from Japanese Manufacturing Companies. Journal of International Business Research, 11, 121-134.
De Angelo, H., and Masulis, R., 1980. Optimal capital structure under corporate and personal taxation. Journal of Financial Economics, 8(1), 3-29.
De Jong, A,. Kabir, R., and Nguyen, T., 2008. Capital structure around the world: The roles of firm- and country-specific determinants. Journal of Banking and Finance, 32, 1954–1969.
De Miguel, A., and Pindado, J., 2001. Determinants of capital structure: new evidence from Spanish panel data. Journal of Corporate Finance, 7, 77-99.
48
Desender, K. (2010) Ownership Structure and Stock Price Performance During Turbulent Financial Markets. AAA 2009 Financial Accounting & Reporting Section (FARS) Meeting.
EU Commission, 2003. Observatory of European SMEs, Enterprise Publications.
Fama, E., and French, K., 2002. Testing trade-off and pecking order predictions about dividends and debt. The Review of Financial Studies, 15(1), 1-33.
Fauzi, F., Basyith, A., and Idris, M., 2013. The determinants of capital structure: An empirical study of New Zealand-listed firms. Asian Journal of Finance & Accounting, 5(2), 1-21.
Haan, D., 2012. Firm internationalization and capital structure in developing countries: The role of home country financial development. Master thesis presented in Universitair Medish Centrum Groningen (http://scripties.umcg.eldoc.ub.rug.nl/root/anderestudie/2012/HaanD.J.de/)
Handoo, A., and Sharma, K., 2014. A study on determinants of capital structure in India. IIMB Management Review, 26, 170-182.
Jensen, M., 1986. Agency costs of free cash flow corporate finance and takeovers. American Economic Review, 76 (2), 323–329.
Jensen, M., and Meckling, W., 1976. Theory of the firm: Managerial behaviour, agency cost and ownership structure. Journal of Financial Economics, 3, 305–360.
Joh, S., 2003. Corporate governance and firm profitability: Evidence from Korea before the economic crisis. Journal of Financial Economics, 68, 287-322.
Jordan, J., Lowe, J., and Taylor, P., 1998. Strategy and financial policy in UK small firms. Journal of Business Finance and Accounting, 25, 1-27.
La Porta, R., López de Silanes, F., Shleifer, A., and Vishny, R., 1998. Law and finance. The Journal of Political Economy, 106, 1113–1155.
Lisboa, I. (2015) Family impact on capital structure: Does financial crisis matter? Journal of Business and Economics, 6(2), 306-316.
Mackinlay, A., and Richardson, M., 1991. Using generalized method of moments to test mean-variance efficiency. Journal of Finance, 46, 511-527.
Mateev, M., and Ivanov, K., 2010. How SME uniqueness affects capital structure: Evidence from Central and Eastern Europe panel data. Quarterly Journal of Finance and Accounting, 50(1), 115-143.
49 Modigliani, F., and Miller, M., 1958. The cost of capital, corporation finance and the theory of investment. American Economic Review, 48 (3), 261–297.
Modigliani, F., and Miller, M., 1963. Corporate income taxes and the cost of capital: A correction. American Economic Review, 53, 433-33.
Myers, S., 1977. Determinants of corporate borrowing. Journal of Financial Economics, 5, 147–175.
Myers, S., 1984. The capital structure puzzle. Journal of Finance, 39 (3), 575–592.
Myers, S., 2001. Capital structure. Journal of Economic Perspectives, 15(2), 81-102.
Myers, S., and Majluf, N., 1984. Corporate financing and investment decision when firms have information that investors do not have. Journal of Financial Economics, 13 (2), 187–221.
Palacín-Sánchez, M., Ramírez-Herrera, L., and Pietro, F., 2013. Capital structure of SMEs in Spanish regions. Small Business Economics, 41, 503-519.
Proença, P., Laureano, R., and Laureano, L., 2014. Determinants of capital structure and the 2008 financial crisis: Evidence from Portuguese SMEs. Social Behavioral Sciences, 150, 182-191.
Psillaki, M., and Daskalaskis, N., 2009. Are the determinants of capital structure country or firm specific? Small Business Economics, 33, 319-333.
Rajan, R., and Zingales, L., 1995. What do we know about capital structure? Some evidence from international data. Journal of Finance, 50, 1421-1460.
Titman, S., and Wessells, R., 1988. The determinants of capital structure choice” The Journal of Finance, 43, 1-19.
Vergas, N., Cerqueira, A., and Brandão, E., 2015. The determinants of the capital structure of listed on stock market nonfinancial firms: Evidence for Portugal. FEP working papers, n. 555 (ISSN: 0870-8541)
Vieira, E., 2013. Determinantes da estrutura de capital das empresas portuguesas cotadas. Revista Portuguesa e Brasileira de Gestão, 12(1), 38-47.