Universidade do Minho
Escola de Engenharia
Pedro Miguel Pimentel Guimarães
Monitoring and analysis of queries in
distributed databases
Universidade do Minho
Dissertação de Mestrado
Escola de Engenharia
Departamento de Informática
Pedro Miguel Pimentel Guimarães
Monitoring and analysis of queries in
distributed databases
Mestrado em Engenharia Informática
Trabalho realizado sob orientação de
Agradecimentos
Antes de mais queria agradecer ao meu orientador, Prof. Doutor Jos´e Orlando Pereira por toda a aten¸c˜ao, preocupa¸c˜ao e tempo despendido bem como o grande aux´ılio prestado e que possibilitou o sucesso desta disserta¸c˜ao.
Queria dar os meus agradecimentos a todos do laborat´orio, em particular ao Jo˜ao Paulo por me ajudar a instalar e disponibilizar os recursos necess´arios, ao Miguel Matos pela ajuda com o Derby e com o resto da plataforma CoherentPaaS e ao Ricardo Vila¸ca, pela ajuda na optimiza¸c˜ao das escritas no HBase.
Agrade¸co a todos aqueles com quem tive conversas um pouco aleat´orias, por vezes in-spiradoras, filos´oficas ou simplesmente tolas nos tempos mais livres e a todos os outros meus companheiros de luta, que me foram motivando.
Finalmente, obrigado `a minha fam´ılia, especialmente ao meu Pai, M˜ae e Irm˜a, por todo o apoio, amor e carinho que sempre me deram.
Abstract
“ Monitoring and analysis of queries in distributed databases ”
Scalable database services combining multiple technologies, including SQL and NoSQL, are increasingly in vogue. In this context, the CoherentPaaS research project aims at providing an integrated platform with multiple data management technologies, united by a common query language and global transactional coherence.
For this integration to succeed, it must provide the same monitoring capabilities of tra-ditional relational databases, namely, for database administrators to optimise its operation. However, achieving this in a distributed and heterogeneous system is in itself a challenge.
This work proposes a solution to this problem with X-Ray, that allows monitoring code to be added to a Java-based distributed system by manipulating its bytecode at runtime. The resulting information is collected in a NoSQL database and then processed and visualised graphically. This system is evaluated experimentally by adding monitoring to Apache Derby and tested with the standard TPC-C benchmark workload.
Resumo
“ Monitoriza¸c˜ao e an´alise de interroga¸c˜oes em bases de dados distribu´ıdas ” Os servi¸cos escal´aveis de base de dados combinando diversas tecnologias, incluindo SQL e NoSQL, est˜ao cada vez mais em voga. Neste contexto, o projeto de investiga¸c˜ao Coherent-PaaS tem como objetivo oferecer uma plataforma integradora de m´ultiplas tecnologias de gest˜ao de dados, unidas por uma linguagem de interroga¸c˜ao comum e por mecanismos de coerˆencia transacional global.
Para que esta integra¸c˜ao seja utiliz´avel na pr´atica, ´e necess´ario que ofere¸ca as capacidades de monitoriza¸c˜ao que s˜ao comuns em bases de dados relacionais, por exemplo, para que o administrador de bases de dados seja capaz de otimizar a sua opera¸c˜ao. No entanto, a concretiza¸c˜ao desta funcionalidade num sistema distribu´ıdo e heterog´eneo ´e em si um desafio. Este trabalho prop˜oe uma solu¸c˜ao para este problema com o sistema X-Ray, que permite adicionar a capacidade de monitoriza¸c˜ao a um sistema distribu´ıdo em Java atrav´es da
nipula¸c˜ao do c´odigo-objeto em tempo de execu¸c˜ao. A informa¸c˜ao resultante ´e recolhida numa base de dados NoSQL e depois processada e visualizada graficamente. Este sistema ´e avaliado experimentalmente aplicando-o ao Apache Derby e utilizando o padr˜ao de testes TPC-C.
Contents
Glossary vii List of Figures ix Code Listings xi 1 Introduction 1 1.1 Context . . . 1 1.2 Challenges . . . 31.3 Goal & Contributions . . . 4
1.4 Document Structure . . . 4
2 State of the Art 7 2.1 Distributed Databases . . . 7
2.2 Distributed Monitoring . . . 8
2.3 Debugging Applications . . . 9
2.3.1 Metrics . . . 9
2.3.2 Call context and tracing . . . 10
2.3.3 Data collection . . . 12 Instrumentation . . . 12 Hardware counters . . . 13 2.3.4 Tracing tools . . . 14 2.4 Event Logging . . . 15 2.5 Discussion . . . 16 iii
Contents Contents 3 Architecture 19 3.1 Overview . . . 19 3.2 Main features . . . 20 3.2.1 Probes . . . 20 3.2.2 Tags . . . 21 3.2.3 Resources . . . 23 3.2.4 HBase storage . . . 24 3.2.5 Visualisation . . . 24 3.3 Usage Methods . . . 26
3.3.1 Custom Class Loader . . . 26
3.3.2 JAR Recompiler . . . 29 3.3.3 Java Agent . . . 29 3.4 Configuration . . . 30 3.4.1 Annotations . . . 32 3.4.2 Configuration Files . . . 33 4 Implementation 37 4.1 Overview . . . 37 4.2 Understanding the JVM . . . 39 4.3 Technologies used . . . 42 4.4 Selection of targets . . . 42 4.5 Modifications to targets . . . 46
4.5.1 Eager loading and callbacks . . . 47
4.5.2 Event Information . . . 47 5 Evaluation 49 5.1 Qualitative analysis . . . 49 5.2 Measurements . . . 53 6 Conclusions 55 6.1 Future Work . . . 56
Contents Contents
References 59
Glossary
bytecode
or Java bytecode, it’s a portable low-level instruction set, resulting from compilation of Java programs and designed to run in the JVM.
CCT
Context Calling Tree. CEP
Complex Event Processing. CQE
Common Query Engine.
DBMS
Database Management System.
JMX
Java Management Extensions. JRE
Java Runtime Environment. JVM
Java Virtual Machine.
Glossary Glossary
logback
a flexible and extensible logging framework that implements the Simple Logging Facade for Java (slf4j) API.
MDC
Mapped Diagnostic Context.
NoSQL
used to refer to databases that don’t typically fit in the traditional relational paradigm. These generally favour availability, speed and efficient storage above consistency and ACID guaranties.
opcode
operation code; the part of the instruction that specifies the operation to perform. It’s normally followed by its parameters if required.
slf4j
Simple Logging Facade for Java. SQL
Structured Query Language.
type
a particular kind of data. Normally it denotes a reference (non-primitive) type, like interfaces or classes.
List of Figures
1.1 CoherentPaaS architecture . . . 2
2.1 Representation of an execution plan . . . 8
2.2 Representations of calling relationships . . . 11
3.1 X-Ray sub-module architecture . . . 19
3.2 Example Graphviz’s representation . . . 25
3.3 Example flowgraph . . . 27
3.4 Execution when using the X-Ray class loader . . . 28
3.5 JAR instrumentation procedure . . . 30
3.6 Agent instrumentation process . . . 31
4.1 Normal JRE classloading procedure . . . 40
5.1 Flowgraph produced when sending a query to Derby . . . 50
5.2 Graphviz’s representation of a Derby query . . . 51
5.3 Flowgraph produced when sending a query to a Derby cluster . . . 52
Listings
3.1 Example code benefiting of the use of tags . . . 22
3.2 Using the Log annotation . . . 32
3.3 Using the tag annotations . . . 32
3.4 Details about remote tag annotations . . . 33
3.5 General syntax of an identifier . . . 33
3.6 Identifier examples . . . 34
3.7 Some configuration keys . . . 34
3.8 A few tag configuration keys . . . 34
3.9 Some remote tag configuration keys . . . 35
4.1 Instrumentation decision algorithm . . . 43
1 Introduction
1.1 Context
The use of multiple database management technologies, such as scalable SQL databases and key-value or document-oriented data stores, is increasingly in vogue. This is due to the increase of the amount of managed data that demands more efficient storage with high-availability. Other solutions were developed to satisfy requirements from recently growing domains as Machine Learning and Data Mining. NoSQL solutions are diverse and generally try to provide availability and partition tolerance guarantees at the cost of a reduced level of data consistency. Each of them is adequate to different situations and product requirements. One size does not fit all.
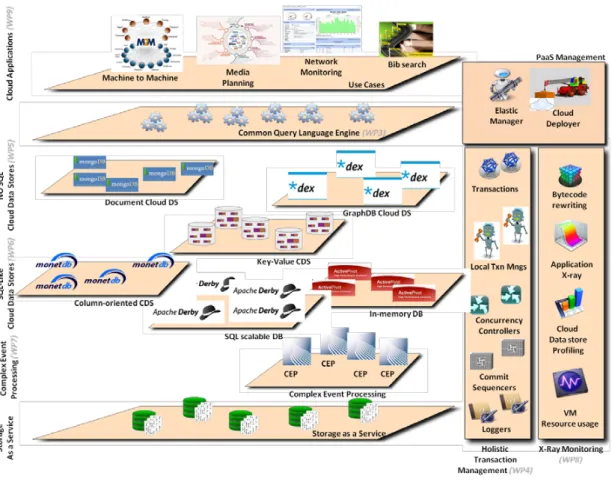
CoherentPaaS or “A Coherent and Rich PaaS with a Common Programming Model” is an European Union project [2] aiming to design and implement a PaaS (Platform as a Service) that allows access to a wide range of services and data storage technologies in the cloud. These include NoSQL-data stores (key-value data stores, graphDB data stores, document-oriented data stores), SQL-like scalable data stores (column-oriented data stores, in-memory databases, SQL databases) as well as Complex Event Processing (CEP) systems. Data will be available in a unified way through a common query language supporting global transactional coherence.
Figure 1.1 presents CoherentPaaS’s general structure and main components. At the higher abstraction layer, the CoherentPaaS system includes the Common Query Engine, supporting the various datastores mentioned (on the bottom left of the figure). Cloud ap-plications (on the top left) can be deployed and use those Database Management Systems (DBMSs) through the Query Engine. Other components necessary for the function of the
1.1. CONTEXT CHAPTER 1. INTRODUCTION
Figure 1.1: CoherentPaaS architecture.
PaaS are represented on the right side of the figure. They include transaction management and X-Ray monitoring, responsible for the monitoring, debugging and profiling of the cloud applications and databases (Figure 1.1, on the right). These facilities are used by PaaS man-agement, responsible for deploying applications. Work developed for this thesis corresponds to the X-Ray monitoring module.
There are many scalable enterprise DBMSs solutions implemented in the Java language and among them are the most popular and used NoSQL ones. Examples of datastores in Java include HBase, Accumulo, Cassandra, Voldemort, Neo4j, Hazelcast, Apache Derby, Terrastore, InfiniteGraph, and OrientDB. The reasons for this are: a mixture of historical market share in commercial applications and middleware, the execution model in a virtual machine that enables its easy deployment independently of machine architecture or operating system1 with increased security and a sizable ecosystem of open source, permissive licensed2
1This idea was codified in the slogan “Write once, run everywhere”. 2See
http://www.softwarelicenses.org/p1_open_source_glossary_permissive_licenses.php for a
CHAPTER 1. INTRODUCTION 1.2. CHALLENGES
frameworks and libraries used in conjunction or replacing various parts of the JavaEE plat-form. It is thus reasonable to choose Java to implement X-Ray. For other datastore systems not implemented in Java, a bridge or converter can easily be coded.
1.2 Challenges
Detailed execution plans, similar to the PostgreSQL’s EXPLAIN and EXPLAIN ANALYZE commands – do not normally exist or are hard to gather in cloud platforms. This difficulty is due to:
• Obtaining the data requires the integration of several components; • Some of these components do not offer the necessary features;
• Components are heterogeneous and distributed, so it is necessary to cross software and hardware frontiers to obtain global information.
These problems can be solved by monitoring each component in a distributed system. Then we can directly obtain information from the components and coordinate them, even if they were not designed with integration in mind. But this is not enough because when some component lacks a certain feature it is necessary to add it, and it may be onerous or even impossible to add it in the monitoring layer; maybe a more direct interaction with the component is necessary. Likewise, to support advanced debugging techniques, changes in the component can be necessary.
Another concern is how to change the components. Source code of some elements might be unavailable, as it can happen when using commercial software. Even if accessible, it can be infeasible to change it for some reason or being just plain burdensome to do so.
It also must be powerful. Consider a typical use case to epitomise this. Suppose one wants to alter a datastore to monitor some parts of its operation, typically how queries are processed. X-Ray must follow the execution flow of important events from start to end and filter irrelevant information. What matters here is to follow the execution when crossing
1.3. GOAL & CONTRIBUTIONS CHAPTER 1. INTRODUCTION
from one task to another and be able to detect communication with other resources in the same or in a different computer. Task is used on this context in a generic sense, as a quantum of related work that corresponds to a singular operation in the optic of the system examiner. After collecting the data, it must process and present it in a useful format.
1.3 Goal and Contributions
The aim of this work is to equip CoherentPaaS with mechanisms to debug and optimise queries, comparable to those of traditional databases. These mechanisms are sufficiently powerful and generic to work in the several types of SQL and NoSQL supported by the project. They are designed to capture as well as possible the behaviour and inner workings of components. They are easy to use and expressive, allowing an user to only alter some parameters and obtain the expected results. Finally, these mechanisms are easily extensible, configurable, and customisable.
This work provides the design and implementation of a tool that:
• Adds the ability to report information to each component in a heterogeneous distrib-uted database while:
– Allowing users to choose what information to collect;
– Working seamlessly across component and distribution boundaries. • Enriches each event with additional information, as needed [24];
• Does not require source code to be available;
• Is applicable in the context of distributed databases.
1.4 Document Structure
The rest of this dissertation is organised as follows: Chapter 2 summarises the state of the art and background concepts; Chapter 3 presents the architecture of the developed solution, starting by a high-level overview, followed by a explanation of each feature and usage method,
CHAPTER 1. INTRODUCTION 1.4. DOCUMENT STRUCTURE
and finally the configuration options available; Chapter 4 details how that architecture was implemented, referencing used technologies and important information about components or instrumentation aspects; in Chapter 5 the solution is evaluated experimentally with a case study. Finally, Chapter 6 discusses the conclusions and presents a brief description of the directions this work can evolve in the future.
2 State of the Art
There are numerous debugging and logging techniques, in multiple platforms, and for multiple purposes. In particular, it is possible to make a distinction between debugging technologies that work and are designed for distributed databases and general solutions for debugging, monitoring, and event logging. The topics of instrumentation and program analysis are analysed as well as core concepts necessary to better understand challenges and questions associated with each solution.
2.1 Monitoring and Distributed Databases
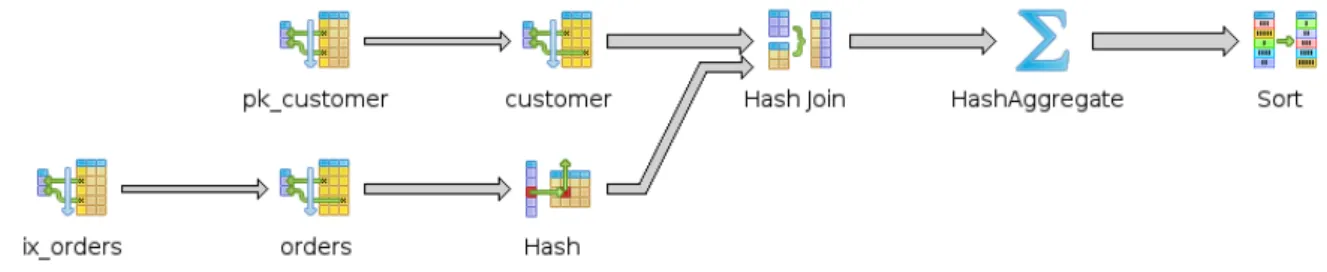
Suppose a Structured Query Language (SQL) query is executed in a database server. Tools like pgAdmin1 easily allow the generation of a graphical representation of the query’s execution plan, detailing each computation step, the elements involved, and the operations applied. Figure 2.1 is an example of such graphical output.
Adequate debugging tools must allow the generation of similar visual representations for queries running on CoherentPaaS. The difficulties arise with both the heterogeneous nature of the databases and the distributed execution context.
Data storage monitoring solutions are for the most part database-specific, for example, SQL, key-value store, or document-store specific. Moreover those solutions do not work for all data stores of that kind, but only on specific engines. For example, we could have a solution available to MySQL but incompatible with PostegreSQL databases.
Other tools have some limitations that would hinder their use in X-Ray, as they are implemented as an extension to some datastores or were conceived to solve very specific
1See
2.2. DISTRIBUTED MONITORING CHAPTER 2. STATE OF THE ART
Figure 2.1: Representation of an execution plan generated by pgAdmin.
use-cases.
For example, the system described in [20] to extend PostegreSQL adds a message-passing system to a normal distributed database; the resulting system can send and receive messages besides upholding the normal database operations. Although interesting, the system only works on PostegreSQL databases and the message-passing model offers some drawbacks.
2.2 Distributed Application Monitoring
Another approach is to use existing general monitoring frameworks already capable of operating in a distributed context. This path, by its very nature, avoids the problem with the different datastore types by being agnostic to them.
An attractive system that follows this model is presented in [31]: considering that in-formation about the components or middleware of a distributed service may be minimal and the source code unavailable, the proposed solution is a request tracing tool that worked despite this fact. To that end, each component is considered a black box, a device that receives input, processes it in an unknown fashion and returns an output. As the processing is opaque to the rest of the system, the tracing tool is used to follow requests, as they are passed between components until the computation associated to the request is produced (and optionally sent to the entity that made the request, if it required some kind of response). A per-request data structure capable of representing this information is defined, the compon-ent activity graph (CAG). This is a graph that represcompon-ents causal paths between activities of
CHAPTER 2. STATE OF THE ART 2.3. DEBUGGING APPLICATIONS
the components [31]. A means to recognise the most frequent paths is also provided.
This analysis is made on-line as the system and the logger nodes are running, without the need to stop them. Information can be collected on demand, meaning that it can enabled or disabled, or done intermittently, using sampling. The detection of communication from one component to the others is made within the kernel when a send or receive system call is used. SystemTap [6] is used to enable this detection and transmit this information to the appropriate nodes. So this solution cannot be used for CoherentPaaS as it is not OS independent and has no JVM support implemented. Besides, although the principle that no information exists about the components is a valid one and the results obtained are useful, this project makes different assumptions. Even if the source code of a component cannot be altered and deployed, it is still available or its general API is, and so more information can be extracted, if it is of interest to the user.
2.3 Debugging Applications
An alternative is to consider debug methods used for normal applications – i.e. those running in sequential or concurrent systems. They are not necessarily applicable to a dis-tributed system, but while those techniques may be insufficient by themselves, they can be used to introduce some important concepts. Besides, analysis methods for distributed programs are inspired or built on top of these.
2.3.1 Metrics
The first approach is to make use of performance statistics and collect machine/ar-chitecture-specific metrics. If the same setup is used under different conditions and a sufficient number of times, statistically derived-data is found and validated. By running tests on other machines or simply considering the similarities between most modern com-puter architectures, it is possible to obtain global valid conclusions about an algorithm or program. Execution times, cache miss rate, percentage of failed predicted branch jumps are platform-dependent metrics, as they directly depend on the underlying platform (and so very different results for the same benchmarks can be obtained on different machines).
2.3. DEBUGGING APPLICATIONS CHAPTER 2. STATE OF THE ART
Other possibility is focusing in capturing platform and/or architecture-agnostic metrics, valid in any execution environment. Leaving out details that depend on the running platform reduces some utility of the metrics, as information is lost. In contrast, the analysis of the data or at least its validity to all systems is facilitated. For some cases, the missing information is not relevant nor needed; in a sense, collecting platform-agnostic data can be equivalent to filtering the noise. Examples of platform-independent metrics include the calls made in the execution of a program – number and relation. In the Section 2.3.2, this is expanded upon.
One example where platform-independent metrics can be very important is when devel-oping applications for deploying in the Java virtual machine, where analysis should target the developed application, not the underlying system nor the JVM implementation (or even Java processor [33]) used. This does not mean platform-specific information cannot be meas-ured and information general enough cannot be derived from there, through analysis or by mere empirical observation. It also does not mean that these metrics are in any way incom-patible with each other or redundant. They are distinct only in the formal sense and can be freely combined to obtain a better understanding of applications. And sometimes, the base platform or JVM is indeed part of what is being investigated.
2.3.2 Call context and tracing
The relation between methods or actions is very important when examining data man-agement applications. It should be possible to visualise how an action is composed and what sub-actions compose it. Actions could be methods or something more abstract. This is important because it allows the visualisation of a produced query execution plan, similarly to how some database management tools support it (cf. Section 2.1).
Visualisations might be obtained by a direct use of the same algorithm used in those solutions or maybe by applying the same concepts in a slightly different way [8]. This is related to the concept of software tracing: the act of obtaining data about an execution and its logical ordering, for an intra-program view, normally associated with a lower level analysis than event-logging.
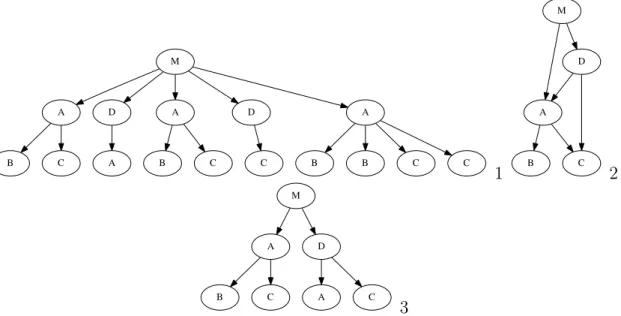
The representation of the methods called when executing a program is named a call tree.
CHAPTER 2. STATE OF THE ART 2.3. DEBUGGING APPLICATIONS M A D A D A B C A B C C B B C C 1 M A D B C 2 M A D B C A C 3
Figure 2.2: Different representations of calling relationships: 1) call tree, 2) call graph and 3) context calling tree.
Each node, besides the information of how a method relates to other method, can also store information such as execution times [9]. The call tree format allows the representation of all the original run information and includes as separated nodes different calls to the same function. Because of this, its size in memory can grown quickly, especially if one considers cases of call recursion. The detailed context present can also be unnecessary if the distinction of call sites can be inferred or is not important.
In the other extreme is the (dynamic) call graph. This structure uses only one node to represent a function, independently of the number of times or different contexts it was called. So although compact, it is difficult to extract meaningful information from the nodes, as context is lost and metrics associated with each function call are lumped in a node [8].
The Context Calling Tree (CCT) is a compromise between these two formats. It groups together several method invocations in the same node if and only if they share the same context – meaning that the invoked method is the same, and their parent trees are equivalent. These trees can also be called dynamic context calling trees when they are constructed from a run, as it normally happens, due to the fact that static calculation of all possible call relations is a computationally intensive problem.
con-2.3. DEBUGGING APPLICATIONS CHAPTER 2. STATE OF THE ART
tain information about all calls and are generally built using complete code tracing, whereas partial CCTs are built with incomplete call and context information, normally because peri-odic sampling was used to obtain the call stacks. This technique fetches information and updates the CCT in intervals defined in some way and has less overhead than constant tra-cing. The consequent loss of accuracy can be reduced by using a shorter time-span between measurements or a more advanced sampling algorithm, such as adaptive bursting [37].
2.3.3 Data collection
Independently of the data being collected, there is the question of how to obtain that data. Some forms of collection may be more suitable for obtaining some metrics while inefficient for others. Besides the ease of use and the quantity and quality of the obtained information, we should consider the inconvenience and overhead caused by data collection. Here we can distinguish between application runtime overhead, application modification overhead, and cognitive overhead (if the changes to implement are not straightforward or require us to change how we rationalise the problem).
Generally speaking, three approaches to data collection can be employed: using hard-ware aid; using existing softhard-ware to assist the debugging (usually leveraging on the existing functionality of the host JVM or OS, at other times by using an external program) or altering the program to collect them, that is, using instrumentation.
Instrumentation
Instrumentation is the act of adding to programs behaviour that allows the ability to measure or know some information when they are run. Though source code can be manually altered, this approach often involves repetitive work and mixes business logic and debugging logic, which should be separated. Normally, it is done automatically and what is changed is the program low-level representation, if dealing with a compiled language. When using a language that compiles to native code, the generated assembly is modified but when using languages that target the JVM or any virtual machine then the created bytecode is altered. This alteration can be made statically, in one occasion, or dynamically, every time the program is loaded and instrumentation is required.
CHAPTER 2. STATE OF THE ART 2.3. DEBUGGING APPLICATIONS
Generally, the source code is not necessary, but it can be needed to aid the instrument-ation effort, depending on the complexity of the applicinstrument-ation and the intended analysis. The overhead, while acceptable, is not negligible and should be considered [37]. Altering a pro-gram’s representation is a means for instrumenting a program, but not a method and in fact one can use instruction rewriting to monitor various things in very different manners. Or we can apply it for completely different uses, such as generating boilerplate code [5], processing server annotations [7], and aspect-oriented programming [1].
The architecture of the instrumenter can also be very diverse. It can be a single, simple program that alters an application or it can be part of a modular system capable of being extensible with a wide range of plug-ins or similar tools. Examples of monitoring or tracing software that use instrumentation include the venerable gprof, valgrind [26] and its tools (memcache, callgrind, Google’s Flayer [18], etc.), Intel’s Pin [4] and tools. We can find vari-ous solutions specific to the JVM (Java Virtual Machine), maybe because the JVM abstracts away many platform and hardware details and provides some features that enable it, like Java Agents, instrumentation interfaces, custom classloaders and JVM TI. Bytecode, the instrumentation target, is also a relatively simple and high level target when compared to as-sembly. Examples of application debuggers include jp2 [32], JBInsTrace [12], and iPath [10].
Hardware counters
Hardware performance counters, or simply hardware counters, are special-purpose re-gisters built into modern microprocessors to store the counts of hardware-related activities, such as cache misses, branch mispredictions or number of cycles executed. These counters can be used to conduct low-level performance analysis or tuning with very low overhead, especially compared to software instrumentation [8, 34]. The number of available hardware counters in a processor is limited and not every useful information can be kept. So it is necessary to conduct multiple measurements to collect the desired metrics or to continu-ously process or save this data. The types and meanings of hardware counters vary from one kind of architecture to another due to the variation in hardware organisations so they cannot be relied upon as an universal solution. Lastly, it can be difficult to correlate low
2.3. DEBUGGING APPLICATIONS CHAPTER 2. STATE OF THE ART
level performance metrics to the source code or application level [8].
2.3.4 Tracing tools
Native tracing solutions, that address programs compiled to native code, are not useful for Java programs, as they would end up tracing the JVM itself and not only the target program. This is because a Java program is not a self-contained executable but rather a piece of bytecode that is run by a JVM. So debugging a given program in that execution environment would be difficult. Some sort of support to explicitly separate the program from the virtual machine could be made but it would not be trivial.
Even frameworks that might offer some kind of support to programs in JVM still they go against the Java philosophy of compile once, run everywhere. Normally these solutions are only available in certain operating systems and as most use instrumentation of machine code or depend on some kernel or OS functionality, adding support to a new architecture may not be trivial. Native solutions neither can easily access JAVA code, which could be a valuable ability nor are they generally enough high-level. So in general a specialised tool will be a better fit.
General debugging frameworks like valgrind (and its tools like callgrind, Flayer, etc.) or Pin are powerful and extensible with the goal to easily allow building new tools by taking advantage of the provided features and the plugin architecture model. But they are native solutions and so are not compatible with CoherentPaaS.
iPath [10] is a dynamic instrumentation tool with some interesting properties for a dis-tributed setting. It allows a more focused analysis as the methods to analyse can be chosen and this selection can be altered at run-time. Best of all is that it works on distributed sys-tems. Yet it is a native solution and although one can choose what methods to instrument, when the call stack is walked to update the calling context information, all methods includ-ing those that were not declared for observation will be recorded in the calls information structure.
Solutions involving bursting or sampling are not generally interesting, as they seek to solve almost the opposite problem of this work’s: they need to analyse the whole program and to compensate for this computational weight a lighter collecting process is used. This
CHAPTER 2. STATE OF THE ART 2.4. EVENT LOGGING
contrasts with the need to analyse some parts of the program in a way that does not lose a invocation, which is lighter than instrumenting the whole code and is executed less times, so it can be heavier.
So it can be concluded that those solutions, by the intention they were designed, are not adequate in this instance. Still, it should be noted that some advanced algorithms can have a decent accuracy, matching about 84 % of the full context tree [37] [35].
Next are the JVM-specific tools, more viable candidates for possible solutions. Most of these tools focus on complete knowledge of the whole execution instead of finding when something interesting is happening. They normally run as an agent specified at run-time with a parameter at the command line or programmatically. That way any standard production JVM, is capable of executing the instrumenting code. They instrument a program’s methods and some also can instrument native (JNI) and JRE classes’ methods. Some allow for fine tracing, at the block level. Examples of JVM tracers include JBInsTrace and jp2, among others.
jp2 [32] is an interesting example, as it allows one to query the trace results, previously saved to an XML file, using the xQuery language. But the focus is still the gathering of excessive, and lower-level information than what matters to CoherentPaaS: it is done logging on all the methods (it is possible to disable tracing only per thread) and there is the ability to distinguish different calls to the same target method, even if from different positions in the same source method. These are excessive details. None of the presented technologies is a distributed and capable tracing solution for the JVM capable of fulfilling the project requirements.
2.4 Event Logging
Event logging is an action to obtain high-level information from a running program. According to Chandy, an event is a significant change in the state of the universe[13]. It follows that only changes interesting to an application are significant changes, and so, are considered events. Events must be observed to be reported and processed. They can be processed where they were first reported or transported to an event consumer. Normally
2.5. DISCUSSION CHAPTER 2. STATE OF THE ART
an event includes a timestamp and other descriptive parameters. The distinction between logging and tracing is that tracing is more of a low level method. Events logged normally have a specific structure/format that eases their processing and are normally more important to a developer or administrator, not to a developer. Events are normally used to change the behaviour of a system depending on some conditions, to monitor performance or to detect distributed/concurrency problems or security breaches [24].
Event logging is related to message-passing systems, as a possible mean to distribute the events to consumers and to continuous queries.
An example of a logging structure is EV-Path [19], a middleware infrastructure that extends a publish-subscribe system. It offers the flexibility needed to support the varied data flow and control needs of alternative higher-level streaming models. Others include Netlogger [22], WebLogic Event Server [36], and PreciseTracer [31].
These tools emphasise the logging infrastructure, the log producers and consumers, and how events move between nodes, but do not focus on how they are produced or assume access to the applications’ original source code. But it might not be available or be feasibly to change it and re-deploy the application. Besides, the structure of a event’s log still has to be decided having in consideration the domain-specific peculiarities of distributed databases and user requests.
2.5 Discussion
Succinctly, many of those solutions are not available in a distributed context or are not usable in a way that addresses the target problem. Data store monitoring solutions are for the most part database-specific. General debugging and monitoring solutions have got some problems. As the name implies, these solutions are general, thus they do not take in account the particularities of databases or distributed systems. This is a surpassable limitation; another problem is that the majority of the existing solutions do not allow users to explicitly choose what to log. Thus excessive information that amounts to noise is produced and collected. Some solutions allow that choice, but not in a simple way.
Based on the analysis of previous work, a complete and adequate solution should:
CHAPTER 2. STATE OF THE ART 2.5. DISCUSSION
Be based in JVM/Java: Even if it was possible to use native solutions instead, they would still have disadvantages when compared with a solution in Java;
Be dynamic: As long as performance does not take a significant hit, instrumentation should be dynamic, done each time it is needed. One time instrumentation adds a new step in the compilation process and is not that useful because between runs it is likely that the original program or the configuration options will be altered;
Be automatic: It should do as much as it can automatically, including everything that must be done to alter and get the analysed program running. After that, it should let users specify what can not be guessed and allow them to change the default configurations if they want;2
Focus on important details: When reviewing existing applications under the prism of query monitoring and debugging, it becomes evident how excessive detail can hurt more than help;
Be extensible: Examples of good tools are Pin, valgrind, etc. These tools are popular because they can be extended to satisfy particular needs and requisites, because they allow different people to use its code base as a foundation to build upon and avoid dealing with (some) low level details and needing to reinvent the wheel.
We also can infer technological dependencies and required components. For example, based in the first two conclusions we know that we need something capable of altering a Java program at runtime to use for instrumenting programs.
2An example of this is valgrind. Users can run it without any options and it produces useful information, but using some options it can do more operations; it might surprise some people that it can do more than check for memory leaks!
3 Architecture
3.1 Overview
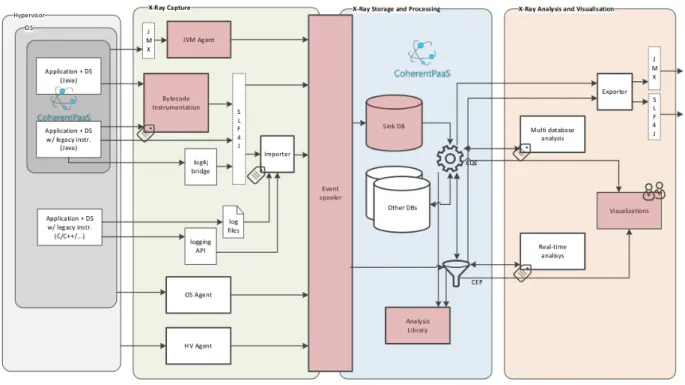
Figure 3.1 presents the X-Ray architecture as conceived for CoherentPaaS, with the components designed and implemented in this thesis, completely or partially, coloured in red.
Figure 3.1: X-Ray sub-module architecture.
There is the assumption of the existence of distributed applications with software com-ponents in multiple servers, virtual hosts, and Java virtual machines. These applications generate monitoring events through the X-Ray Capture layer to the X-Ray Storage and Pro-cessing layer, to be used in the X-Ray Analysis and Visualisation layer. Label icons identify
3.2. MAIN FEATURES CHAPTER 3. ARCHITECTURE
the main configuration points for the system.
For Java applications, the X-Ray Capture module includes bytecode instrumenta-tion, a mechanism for modifying compiled programs, by inserting into them code to gen-erate logging events, maintain context, and allowing software probes. This is the main configuration point for Java programs. Generated events pass through slf4j1 to an event spooler.
This event spooler enriches them with additional information and delivers them to the X-Ray Storage and Processing module. Bridges or file processing can be used to obtain information about non X-Ray-ready programs. Several agents responsible for monitoring and collecting metrics at different abstraction levels also supply the event spooler, namely, from Java Management Extensions (JMX) [15].
In the Storage and Processing module, events can be stored in a NoSQL database with high-throughput capacity (the sink database) or be fed to the Complex Event Pro-cessing (CEP) engine for real-time proPro-cessing. A simple prototype of this database was implemented in HBase.2
The Common Query Engine (CQE) is CoherentPaaS’s own database engine, capable of executing queries on several heterogeneous databases.
The Analysis Library contains analysis procedures applicable to the monitoring data, specially concerned with request tracking across software modules and components.
The data can leave for the analysis and visualisation module in a couple of ways: it can be exported to enable interaction with external systems, be processed (potentially in real-time) or be used to construct visual representations available to the end-user.
3.2 Main features
3.2.1 Probes
Probes implemented in X-Ray allow code execution on entry and exit(s) of selected methods. The target data – name and reference of executing class, name and signature
1See
http://www.slf4j.orgfor more information.
2An Apache NoSQL database inspired by Google’s Bigtable [14]. For more information about HBase, see https://hbase.apache.org.
CHAPTER 3. ARCHITECTURE 3.2. MAIN FEATURES
of the method, the current thread and the parameters/return value – are accessible to all defined probes. Probes can execute any custom code, as long as it implements the required interface. That makes probes powerful and in fact, some of the provided functionality in X-Ray is implemented using them. For instance, they can be use to save information in a datastore or to do a simple local analysis.
Besides analysis, another use case for a probe, is to alter some parameters before passing them to the original method, or alter return values before the function end. Conditional actions can be implemented using probes: for instance, only do something if the return value is > 4 or if an exception was thrown.
Internally collected data is routed to probes through slf4j and logback, but this is only an implementation detail.
3.2.2 Tags
Instrumentation also provides the ability to tag entities being observed. A tag is an identifier that increases the data that can be collected by X-Ray, motivated by the recognition that certain computations happen in distinct contexts (even if the executed code is the same). A tag can be associated with an object or thread and through configuration instructions it is possible to generate a new one, remove it, move it, or copy it to a thread or object. Adding the choice between doing these operations on method entry or exit points, the result is a flexible mechanism enabling one to follow a request execution even when threads or objects are reused (e.g., the case when thread or object pools are involved). This also works in other similar situations in which long-lived applications need a low latency and the ability to answer a great number of clients, frequently recycling resources.
Unlike other configuration options such as the log level, tag indications are only ap-plicable to methods, being optionally inherited. Indeed, as a fine-tuning option used to differentiate similar contexts, they would become meaningless and less useful if they were mass-assigned.
A tag is used as an identifier, so each tag value is a unique in a given JVM run, being unspecified how the values are formed or the relation between tags except equality. In practice values correspond to numbers obtained from an incrementing counter.
3.2. MAIN FEATURES CHAPTER 3. ARCHITECTURE
As a way to better illustrate how tags work in practice consider the following example of a simple producer/consumer application.
Assume a queue of objects, instances of the class SomeObject. Several producers create objects of this type, initialise them, and push them into the queue. In another thread a consumer obtains objects from the queue and executes a series of methods after inspecting the object. As the queue is being shared, elements are being inserted by several threads and each element is processed in one of several consumer threads. Without tagging the elements, it would be difficult to follow program execution.
Using tags it is easy to follow the object as it goes from the producer to the consumer and it is likewise easy to distinguish objects with different origins. See Section 3.4 for a reference of how the shown code could use them.
c l a s s Consumer{ void consume ( ) { SomeObject s o = queue . t a k e ( ) ; SomeValue s v = s . g e t V a l u e ( ) ; doSomething ( s v ) ; i n t i = doAnotherThing ( s v ) ; d o I t ( ) ; // ( . . . ) } } c l a s s P r o d u c e r { void p r o d u c e ( ) {
SomeObject s o = new SomeValue ( ) ; queue . put ( s o ) ; } } c l a s s SomeObject { SomeValue g e t V a l u e ( ) { . . . } } 22
CHAPTER 3. ARCHITECTURE 3.2. MAIN FEATURES
With tags it is possible to follow a logical work unit, starting from the consumer and going to the producer, passing by the queue. A simple advantage of employing them is that, when logging X-Ray information to the standard output or to a log file, searching through the generated text for any tag value will return all methods and events associated with that tag – for example, a grep command using some tag value might return information representing an work unit or associated with a single response to an external client.
3.2.3 Resources
Information about the usage of physical resources (CPU, RAM, etc.) and Java Virtual Machine (JVM) resources (garbage collection, loaded classes, etc.) is is also recorded, such that it can later be correlated with information from other events.
To accomplish this, it is not be possible to reuse other existing mechanisms from X-Ray. Method entry, exit, and communication events are only triggered in well defined but often not entirely predictable times. The collected data, although extensible with probes, is limited. But what is needed for metrics to be updated at regular intervals is a constant flux of data.
The JVM statistics module is responsible for monitoring the running system and col-lecting several important data about its operation. Measurements are collected periodically until the module execution is halted. The measurements are not only possible but easy to do, thanks to the JMX and JRE platform beans. Those MXBeans represent information about some parts of the runtime: the garbage collector, threads’ state, or the used memory [15] and can be accessed with standard, well-defined methods.
The obtained information is dispersed using the Mapped Diagnostic Context (MDC) [30,
23], a per-thread3 key-value map, available at runtime in several code locations. To avoid
polluting the keyspace, all statistic keys share a prefix; that allows a simple handling of entries (either reading or deleting) according to its type so writing a balancer or other JVM-statistics interacting entity is easy and unconstrained by hard design choices.
3.2. MAIN FEATURES CHAPTER 3. ARCHITECTURE
3.2.4 HBase storage and retrieval
It is possible to save structured event information to a sink database, implemented as an HBase cluster – materialising information to a non-volatile context adequate to processing of large amounts of information present in distributed applications. This process takes advantage of the high scalability and throughput of HBase and can be used to feed real time systems as well as CEP systems.
This prototype hbase-appender is based on logback’s DBAppender.4 In detail, each event is inserted as a line on an HTable with its key being the event unique identifier. Each event has a type (like call logging, remote communication or performance metric) and a timestamp. Depending on the event type, relevant attributes are saved using column families (CFs) as a way to group similar ones. The time-stamp, event type, and other attributes common to all events are saved in a CF called common. The other column families are call (related to methods entries and exits), remote (communications made between different hosts), jvm (to store statistics about JVMs) and finally prop is used to store all other miscellaneous information. This is possible because HBase is a NoSQL database that deals well with variable data, including the addition of new columns.
The provided xray-merger regenerates logs saved in HBase and exports them to various formats, including graphical ones. It can also join logs originated from different machines and produces a global coherent representation, interpreting remote communication events and pseudo-nodes labelled with the socket address used for the communication and connecting them in the right place on the graphs.
3.2.5 Visualisation
The proposed X-Ray framework includes components for visualising the collected in-formation. Such visualisation is useful in itself, as a program analysis tool, as well as a demonstration of what X-Ray enables in the context of the CoherentPaaS framework. The first and simplest way the framework can be used is as a specialised logging tool and so it is possible to export information to files, console, a remote socket address or a database.
4See
http://logback.qos.ch/manual/appenders.html#DBAppenderfor more information.
CHAPTER 3. ARCHITECTURE 3.2. MAIN FEATURES
The exported data can be manipulated and visualised using the tools appropriated for the chosen export medium.
For more advanced visualisations, there is the graph-appender, one of the features built upon the core X-Ray functionality. This is a driver that enables the construction of graphics representing a program run. It has a two-fold purpose: on one hand it enables the construc-tion of structures like the CCTs described in Secconstruc-tion 2.3.2 and other useful data, and on the other hand, it aims to present this data in a visually attractive fashion which is in itself as big or even bigger challenge than knowing what information to collect and how.
A useful feature when analysing a program is obtaining its calls’ graphic representation. Comprehending how code relates to each other, where some method is called, or discovering execution patterns, are all useful when trying to understand an application.
Data is collected normally by the framework, including method entries and exits. From the saved information it is possible to produce a representation of the invocation relationships between (specific or selected ) methods. Internally the graph is maintained in memory using JGraphT [3]. <Entry> 20 test.WorkerPool@697dc141.process(I)V test.Worker@6672ca8f.process(I)V 4 test.Worker@70d30ef6.process(I)V 3 test.Worker@380f27d9.process(I)V 3 test.Worker@5357f509.process(I)V 1 test.Worker@46db13d3.process(I)V 3 test.Worker@3107e198.process(I)V 3 test.Worker@4c2a38be.process(I)V 3 test.WorkerPool@697dc141.createWorker()V 1 test.Worker@3107e198.delegate(I)V 2 test.Worker@4c2a38be.delegate(I)V 1 test.Worker@5357f509.delegate(I)V 1 test.Worker@380f27d9.delegate(I)V 1 1 1 test.Worker@70d30ef6.delegate(I)V 1 1 1 1 test.Worker@46db13d3.delegate(I)V 1 1 1
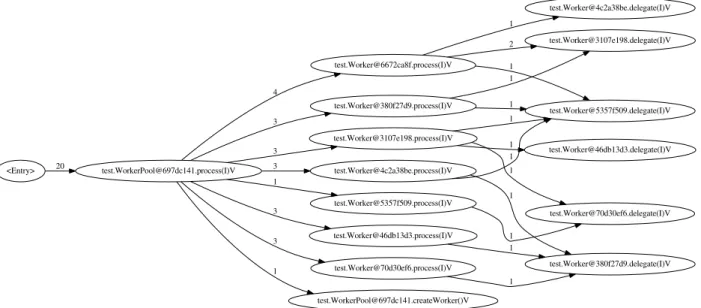
Figure 3.2: Example Graphviz’s representation of the call relationships, resulting of calling dot on the X-Ray generated .dot file.
As for output formats, it is possible to export to graphviz’s5 .dot format to generate
5The project website is located at
3.3. USAGE METHODS CHAPTER 3. ARCHITECTURE
afterwards a graphic with graphviz or feed it to other tools that can read that format. Another available way to see this information is with a browser through the use of an embedded server. This works with Jetty6 + d3js7 to obtain a browser accessible, graphical
representation. Figure 3.2 show an example of a graph produced by X-Ray + graphviz and Figure 3.3 was produced by X-Ray using d3js.
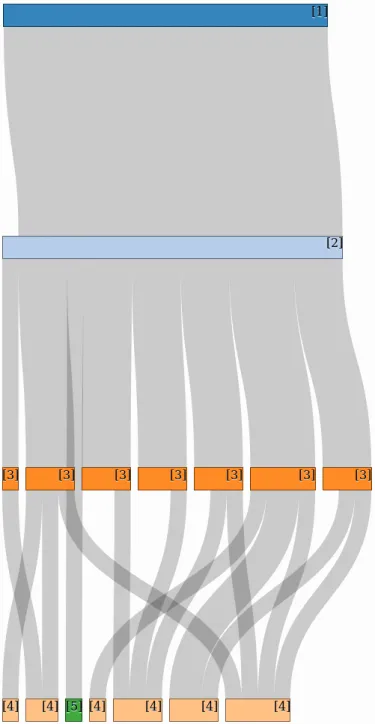
In Figure 3.2, it is possible to see that the exporter generated an entry node, corres-ponding to the program’s entry point. The graph also displays the length of each edge as a label; it corresponds to the number of times each pair object+method was invoked. Note that different objects from the same class are kept distinct in the picture. Figure 3.3 is a screen-shot of the web-page served with Jetty, with the same information represented using d3js. Each class+method pair uses a different colour. The width of each bar represents how many times the method was called. Finally, it should be noted that both graphics are generated and updated on-line, i.e., in real-time as the program runs.
3.3 Usage Methods
These usage methods were developed having in consideration situations where it might be interesting to instrument code, drawing experience from concrete use cases. For each of them the following factors were considered: the instrumentation cost, ease of use, number of times the solution would be used generally, its power, and expressiveness.
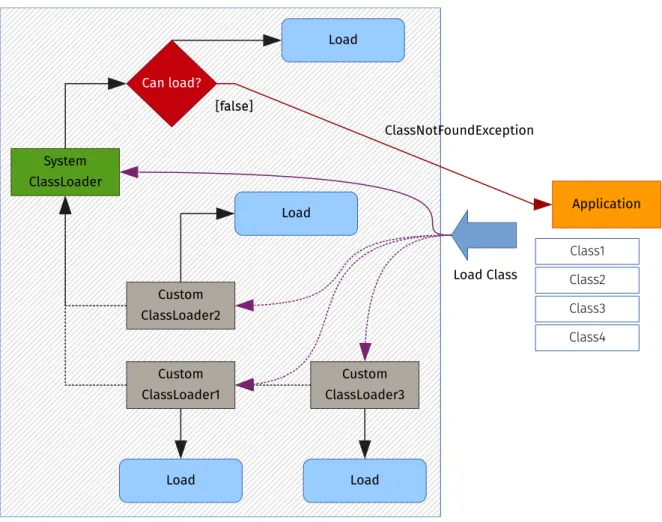
3.3.1 Custom Class Loader
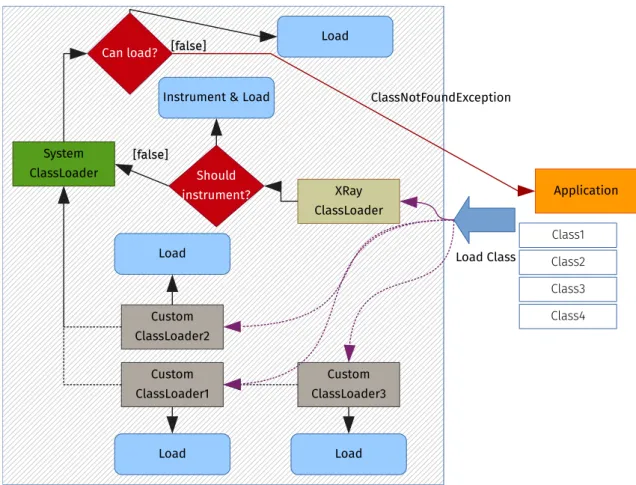
The first alternative is to use a custom class loader. It is configured to read configuration files and react accordingly to classes to be loaded, selectively altering them or returning the original class unchanged, as appropriate. Figure 3.4 illustrates how execution is affected. For a better understanding, contrast it with the default, uninstrumented environment presented on Figure 4.1.
For those who already used this mechanism, it might seem somewhat onerous, as all
in-6See
http://www.eclipse.org/jetty/for more details. 7
http://d3js.org/has got more information about what d3js is and how it can be used.
CHAPTER 3. ARCHITECTURE 3.3. USAGE METHODS
Figure 3.3: Example flowgraph representing the call relationships, produced by X-Ray and d3js: 1) Entry, 2) test.WorkerPool.process(I)V, 3) test.Worker.process(I)V, 4) test.Worker.delegate(I)V and 5) test.WorkerPool.createWorker()V.
teraction with the affected classes must be made through the class loader, returned Class<?> instances and using methods from the package java.reflect. This is more verbose and the compiler cannot provide much assistance (give type information, check the number of parameters, etc.). The altered methods have to be invoked differently and the types of their
3.3. USAGE METHODS CHAPTER 3. ARCHITECTURE
Figure 3.4: Program execution when using the X-Ray class loader.
parameters and return values also change – because we are using different class loaders, the system’s and X-Ray’s – a returned object sometimes cannot be casted to the normal, uninstrumented class and used normally.8
Yet this does not pose a problem when using X-Ray. First, the need to use different invocation strategies and reflection methods exists only where uninstrumented code interacts directly with instrumented code. But when using X-Ray the whole program is instrumented. The framework provides tools to specify or filter the classes or methods to instrument, avoiding a greater instrumentation boilerplate and the same control as if this choice was made at the source code level. Therefore a simple solution to ease the use of this modification strategy is to wrap the program to be executed in a single class and only worry about handling that class.
Because of security restrictions preventing deep and potential unsafe changes, it is not
8Classes defined by different class loader are considered different by the JVM, even if they have the same name or code [21, § 4.3.4], [25,§ 5.3].
CHAPTER 3. ARCHITECTURE 3.3. USAGE METHODS
possible to alter methods in the java.* packages or native methods.
Also if X-Ray attempted to further alter the program representation, by changing mul-tiple times the same class, the Java Runtime Environment (JRE) would give an error (a java.lang.LinkageError) about an attempted duplicated class definition, which is disal-lowed.
This makes it impossible to change instrumentation properties during the application run and seeing these changes take effect. The solution is to use the Java Agent (presented in Section 3.3.3) or modify the desired configurations and restart the program through the X-Ray class loader.
3.3.2 JAR Recompiler
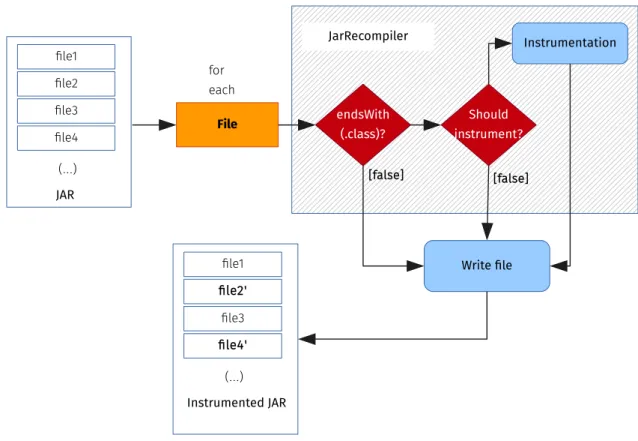
Another solution is to statically modify the bytecode. Instead of modifying the program each time it is executed, it can be done just once. This is how JarRecompiler works: it alters all the necessary files from a JAR and saves them to a new file. This new JAR can then be normally used. Figure 3.5 details how this is done.
With this solution it is possible to develop code without the need to alter it to accom-modate modified code. As the bytecode alteration is done just once, clients of the altered code do not need the asm library to run it. A disadvantage of this method is that it is less flexible - it is necessary to do a JAR recompilation every time a configuration is changed and one wants to see the effects of those changes. To mitigate it, a Maven plugin was developed for generating the altered JAR in the package phase.
It is also not possible to alter native methods. Methods in the java.* packages can be instrumented if the input JAR corresponds to the JRE classes, but this is not recommended.
3.3.3 Java Agent
The last option is a Java Agent [27, java.lang.instrument documentation], an aux-iliary program distributed as a JAR and with special information in its MANIFEST.MF file. Depending on the support provided by the JVM, that might be different for each imple-mentation, it can be initiated along the program by passing an argument to the command line or it can be attached to a running JVM instance after it has started. Similar to static
3.4. CONFIGURATION CHAPTER 3. ARCHITECTURE
Figure 3.5: JAR instrumentation procedure.
recompilation, it is transparent for all normal code interactions and, as the class loader solution, to test some change, a simple program re-run is enough. Depending on how agents are configured, they have the ability to alter JRE classes and native methods and redefine classes already instrumented. A disadvantage of the use of agents is that not all JVMs sup-port it. Among those who do, it does not exist a simple, universal way to do some things, specially initiating an agent after the virtual machine start-up [21, § 8.4.3.4].
Figure 3.6 shows how this method transforms the normal program execution. Compared to other runtime schemes (figure 4.1 and 3.4) this approach also funnels requests from custom class loaders.
3.4 Configuration
X-Ray can be configured in two ways: using annotations or configuration files. Both have the same expressive power, but the second approach is more flexible. If these two configurations strategies are used in parallel and conflict in some parameters, the value from
CHAPTER 3. ARCHITECTURE 3.4. CONFIGURATION
Figure 3.6: Agent instrumentation process.
the configuration file will override the annotations in the source file(s).
A typical configuration, using log levels, is as follows: uninteresting methods are not observed (are not specified to X-Ray), interesting but very common methods can have a low level (such as TRACE or DEBUG) and very important methods can have a higher level (e.g. WARN). This allows one to selectively choose what information to see and assign the adequate importance. When more details are needed, X-Ray or an exporter can have a low log level, displaying information about all the monitored methods. Otherwise, if the results have too much information or we want to see just the most important data, the global log level can be set to a higher level, displaying the methods assigned an equal or greater level than the one in use.
It is also possible to apply indications to a class or package and have all the methods contained be instrumented or apply these indications to a method and having them take effect in all the methods that override it.
3.4. CONFIGURATION CHAPTER 3. ARCHITECTURE
But this framework is only useful in a distributed context if it can monitor or infer rela-tions between simultaneous execurela-tions. So it is also possible to monitor executing threads and inter-method interactions, plus to gather other information about concurrency and communication events, using mechanisms such as tagging and monitoring of socket commu-nication between different virtual machines. When and how to monitor these interactions is also configurable.
3.4.1 Annotations
The main annotation is @Log, applicable to methods, classes, and packages. It indicates that entries and exits of the affected methods should be logged. It possesses two optional elements: “inherited” controls inheritance and “level” specifies the messages log level. When not defined, default values are used for these elements.
@Log
@Log ( i n h e r i t e d=true )
@Log ( i n h e r i t e d=true , l e v e l=L e v e l .WARN)
More annotations exist to deal with tag operations: @SetTag, @CopyTag, @MoveTag, @Remove Tag for local manipulations and @SendTag and ReceiveTag for remote manipulations in-volving sockets. They can only be applied to methods. All of them admit two optional elements: “target” and “time”, indicating the target of the operation and when it should be executed. When values for these elements are not defined, the default value will be used and it is different according to the concrete operation.
@CopyTag
@RemoveTag ( t a r g e t=TagTarget . Thread ) @MoveTag ( t i m e=TagTime . AfterMethod )
@SetTag ( t a r g e t=TagTarget . Object , t i m e=TagTime . BeforeMethod ) The annotations for remote operations are different because they need additional parameters that cannot be automatically inferred. The required parameters are the hostname and port, for the local and the remote sites. Because this information might be unknown at compile time or change throughout a run, a string starting with “?” indicates that the information
CHAPTER 3. ARCHITECTURE 3.4. CONFIGURATION
should be read from the field with given name. A string starting with “:”, followed by a number n, signals information to be read from the nth function parameter (counting from
0). An important note: some compiling options can erase metadata and optimise out other unused data that might in rare cases interfere with this process.
@ReceiveTag ( hostname = ” some . hostname ” , h o s t p o r t = ” ? p o r t ” , remotename = ” a n o t h e r . hostname ” , r e m o t e p o r t = ” : 0 ” ) void r e c e i v e ( i n t r p o r t , InputStream i s ) throws I OE x ce p ti o n ;
@SendTag ( hostname = ” a n o t h e r . hostname ” , h o s t p o r t = ” : 0 ” ,
remotename = ” some . hostname ” , r e m o t e p o r t = ” ? p o r t ” ) void send ( i n t l p o r t , OutputStream o s ) throws I OE x ce p ti o n ;
@SendTag ( hostname = ” a n o t h e r . hostname ” , h o s t p o r t = ” 8080 ” , t a r g e t=TagTarget . Thread , t i m e=TagTime . AfterMethod , remotename = ” ? someHostname ” , r e m o t e p o r t = ” 8080 ” ) void s p e c i a l S e n d ( OutputStream o s ) throws I OE x ce p ti o n ;
Annotation use implies access to source code of the program to alter, a compile-time dependency on X-Ray and each change in the configuration requires a program recompilation to take effect. It also results in a spread of annotations to several files instead of a centralised place to read or alter everything. But this solution has certain advantages: it is simple and comes bundled with the code. Also, because it is applied directly on the entity to examine, it is not affected by refactoring, such as changing class names, method arguments, or package structure.
3.4.2 Configuration Files
The configurations presented here should be written in a specific .properties file for processing. This file type was selected because it is incredibly simple to visualise and to work with, by humans and computers, unlike XML. It can also be parsed by code from the JRE so no implementation needs to be bundled and distributed. Let an identifier be a string following one of these formats:
3.4. CONFIGURATION CHAPTER 3. ARCHITECTURE
<packageName>.<className >.< m e t h o d D e s c r i p t i o n > <packageName>.<className>
<packageName >.∗
For example:
x r a y . example . SomeClass . aMetod ( )V
x r a y . example . SomeClass . aMethod ( Lj ava / l a n g / S t r i n g ; ) [ I x r a y . example . SomeClass
x r a y . example .∗
When the identifier appears in the configuration file, the instrumenter is instructed to alter the represented entity, as if it had an annotation in the source code.
<identifier>.inherited signals that the configurations for the given element should be inherited and <identifier>.level allows configuring the logger severity level of messages emitted by the element.
x r a y . example . SomeClass . method ( )V. i n h e r i t e d #e q u a l s t o
x r a y . example . SomeClass . method ( )V. i n h e r i t e d = t r u e
#i f t h e i n h e r i t e d p r o p e r t y i s not s e t , i t i s i f i t was w r i t t e n x r a y . example . SomeClass . method ( )V. i n h e r i t e d = f a l s e
#t h i s can used t o e x p l i c i t l y l i m i t t h e p r o p a g a t i o n o f #c o n f i g u r a t i o n s i n h e r i t e d from an a n c e s t o r from r e a c h i n g #d e s c e n d a n t s o f t h e d e s i g n a t e d e n t i t y
# o n l y m o n i t o r method ( ) from SomeClass i f t h e d e f i n e d l o g l e v e l #i s WARN o r h i g e r
x r a y . example . SomeClass . method ( )V. l e v e l = WARN
Finally, a local operation with tags is stated in the form <methodIdentifier>. <operation> <target> tag on <time>
x r a y . example . SomeClass . method ( )V. c o p y o b j e c t t a g o n e n t r y
CHAPTER 3. ARCHITECTURE 3.4. CONFIGURATION
x r a y . example . SomeClass . method ( )V. s e t t h r e a d t a g o n e x i t x r a y . example . SomeClass . method ( )V. r e m o v e o b j e c t t a g o n e n t r y x r a y . example . SomeClass . method ( )V. m o v e t h r e a d t a g o n e x i t
and a remote operation is formulated in the form <methodIdentifier>.on <time> <remoteOperation> and copy tag to <target> plus one or zero of the following strings, ”-local address” or ”-remote address”. As when using annotations both the remote and local addresses must be defined. This is done using two keys, each with a different location key. Their values are in the form of <hostname>|<port>.
x r a y . example . SomeClass . method ( )V. o n e x i t s e n d a n d c o p y t a g t o t h r e a d −l o c a l a d d r e s s=l o c a l h o s t | 6 0 0 0
x r a y . example . SomeClass . method ( )V. o n e x i t s e n d a n d c o p y t a g t o t h r e a d −r e m o t e a d d r e s s = 1 9 3 . 1 3 7 . 9 . 1 1 5 | ? p o r t
x r a y . example . SomeClass . aMethod ( I )V. o n e n t r y r e c e i v e a n d c o p y t a g t o o b j e c t −l o c a l a d d r e s s =? h o s t | 8 0 8 0
x r a y . example . SomeClass . aMethod ( I )V. o n e n t r y r e c e i v e a n d c o p y t a g t o o b j e c t −r e m o t e a d d r e s s =? h o s t | : 0
#t h e b e l l o w s t a t e m e n t s i g n a l s t h a t a remote o p e r a t i o n s h o u l d be #a p p l i e d t o a method . I f e a c h l o c a t i o n a d d r e s s i s not s p e c i f i e d , #i t w i l l r e s u l t i n a r u n t i m e e r r o r
x r a y . example . Another C l a s s . method ( )V. o n e x i t s e n d a n d c o p y t a g t o t h r e a d
Unlike when annotations are used, access to source code it is not necessary. Likewise, it is not necessary to recompile the program for each change in the configurations – simply restarting the program is enough. Configurations are all grouped and separated from the code, which eases its reading or alteration and is architecturally cleaner. As for disadvant-ages, it is fragile in case of refactoring. The identifier is not exactly equal to the entity it represents so a search and replace may fail to modify it, and some IDEs do not normally alter resource files when refactoring.
3.4. CONFIGURATION CHAPTER 3. ARCHITECTURE
Theoretically it is possible to update the bytecode automatically, depending on how the X-Ray software is used: the configuration file can be watched for changes and when they occur the classes bytecode can be reprocessed and swapped with the previously in use.
These two methods are available because both have advantages and disadvantages. In some occasions it is not possible to make a choice: if the source code is not available, a separate configuration file must be used. In other occasions, the choice between these strategies is not so important. When doing a static bytecode transformation of a whole program, some advantages .properties files have do not apply and the solutions are more similar to each other, in that particular case.
4 Implementation
4.1 Overview
When starting a program, the configuration file(s) to configure X-Ray, if any were given, are parsed and their commands are added to the framework’s internal state. How these files are passed is dependent on how the framework was used. After this process the original program starts running.1 In its course it needs to use classes or interfaces that are employed
in the application but are not available, because they were not previously used and so need to be loaded. The JVM starts by locating and parsing the file with the class binary representation or bytecode and afterwards loads it and makes it available to the rest of the code, as it is responsible for coordinating the execution of Java programs.
It scans the file and for each method decides if it should be instrumented using these criteria:
1. Configuration from files.
2. Configurations acquired by reading annotations in the currently analysed class and other loaded classes.
This may require visiting the bytecode of superclasses or of the implemented interfaces if they were not already visited, as the decisions made about a class depends on decisions made about those other classes.
First of all, each class is tested against a filter to allow a quick rejection of classes to instrument, which reduces the examined code.
4.1. OVERVIEW CHAPTER 4. IMPLEMENTATION
The precise algorithm to decide if instrumentation should be made or not is defined in Section 4.4.
If any method should be altered, the new code for the method body is generated. After going through all the class code one of these situations will happen:
1. The original code of the class was altered at some point, and so this new code is returned to the JVM to be used by the program.
2. No original code was instrumented by lack of indications; if so the original code is simply returned.
Either way the program will have the class and can now resume. This process happens again each time a class is needed, until the end of the program. This approach is only possible because the binary representation of Java programs corresponds to an well-specified, platform-independent format possible to understand and programmatically manipulate.
If any method was changed for analysis, it is altered in at least two sites: its entry and exit(s). The exits can be normal – from return statements – or exceptional – from throw statements. At method entry and exit the method and class names are collected, as well as a reference to the current object and executing thread. At method entry passed parameters will be saved and at method exit, the return value is stored too.
Each time the execution flow passes through the method, indications of passage through its entry and an exit are given to X-Ray and optionally from there to other systems and all the collected information made available. Remote communication events are also listened for and reported.
Other information associated with methods, classes or packages is maintained by the framework. Part of it is only used internally at runtime and the other part is passed on and made visible. Managed data includes the inheritance information that controls how configurations are passed on to other entities and the level associated with each event. As with the traditional logging systems, the developed solution uses log levels to allow one to observe only more important information.