Palavras chave: Energia alternativa
Biomassa Genótipo Corte Historic: Received 29/12/2016 Accepted 11/12/2017
Keywords: Alternative energy Biomass Genotype Cutting interaction
1 Northern Fluminense State University Darcy Ribeiro - Campos dos Goitacazes, Rio de Janeiro, Brazil +Correspondence:
DOI: 10.1590/01047760201723042292
Veronica Brito da Silva1+, Rogerio Figueiredo Daher1, Bruna Rafaela da Silva Menezes1, Maria Lorraine Fonseca Oliveira1, Maria do Socorro Bezerra Araújo1, Antonio Alonso Cecon Novo1
DIFFERENT STABILITY METHODS FOR CULTIVAR RECOMMENDATION IN ELEPHANT-GRASS FOR ENERGY PURPOSES IN BRAZIL
ABSTRACT: The elephant-grass undergoes successive cutting and periodical evaluations that it possible to identify clones with high stability for dry matter production, which can be used for energy production. The present study was carried out to evaluate stability dry matter yield for different parametric and non-parametric methods in elephant grass genotypes for biomass production undergoes successive cutting in the agroclimatic conditions of the Norte Fluminense (RJ, Brazil). The variable measured in the 40 genotypes was dry matter
yield (DMY) at 2009, 2010 and 2011 in a field study designed as randomized block design
with two replicates. Each sample was grown in different environment condition. The
stability methods tested were the Yates and Cochran’s, Plaisted and Peterson’s, Wricke’s
ecovalence, Annicchiarico’s, Lin and Binns’ and Kang and Phan’s. Results indicated that
cutting (E) and genotypes (G) influenced significantly on the performance of dry matter
yield. The non-parametric stability methods were effective for the evaluation of stability
in dry matter yield. Genotypes Mercker, Pinda-México, Mercker 86-México, Guaçu/IZ, Mercker Pinda, P-241-Piracicaba and Cubano Pinda were stable stability dry matter yield. Hence, there are genotypes may be exploited in future breeding programmes in order to
improve productivity of upland elephant grass over environment.
MÉTODOS DE ESTABILIDADE DIFERENTES PARA RECOMENDAÇÃO DE CULTIVAR EM CAPIM ELEFANTE PARA FINS DE ENERGIA NO BRASIL
RESUMO: O capim-elefante sofre sucessivos cortes em avaliações periódicas, possibilitando identificar clones com alta estabilidade para a produção de matéria seca, podendo ser utilizados para a produção de energia. O presente estudo foi realizado para avaliar a estabilidade na produção de matéria seca, considerando métodos paramétricos e não paramétricos, em genótipos de capim-elefante para produção de biomassa submetido a cortes sucessivos nas condições climáticas do Norte Fluminense (RJ, Brasil). A variável medida nos 40 genótipos foi a produção de matéria seca (DMY) em 2009, 2010 e 2011 em um experimento de campo em blocos casualizados com duas repetições. Cada amostra foi cultivada em diferentes condições ambientais. Os métodos de estabilidade testados foram de Yates e Cochran, Plaisted e Peterson, Wricke, Annicchiarico, Lin e Binns e Kang e Phan. Os resultados indicaram que o corte (E) e os genótipos (G) influenciaram significativamente no desempenho para a produção de matéria seca. Os métodos de estabilidade não-paramétrica foram eficientes para a avaliação da estabilidade no rendimento da matéria seca. Os genótipos Mercker, Pinda-México, Mercker 86-México, Guaçu/IZ, Mercker Pinda, P-241-Piracicaba e Cubano Pinda tiveram uma estabilidade estável na produção de materia seca. Por conseguinte, existem genótipos que podem ser explorados em futuros programas de melhoramento, a fim de melhorar a produtividade
ELEPHANT-GRASS FOR ENERGY PURPOSES IN BRAZIL
INTRODUCTION
Elephant grass (Pennisetum purpureum Schum.) is a tropical perennial grass with high production of biomass. Because of its broad genetic variability, this grass is able to adapt to climatic conditions prevailing in almost the entire Brazil (ANDERSON et al. 2008; OLIVEIRA et al., 2013; DAHER at al. 2014; OLIVEIRA
et al. 2014; ROSSI et al., 2014; SANTOS et al., 2014a,b;
MENEZES et al. 2015; OLIVEIRA et al., 2015). However,
it is considered a species of high photosynthetic effi ciency.
This results in a great dry-matter-accumulation capacity
and a high percentage of fi ber, which is important for
energy production (JAKOB et al., 2009; LEE et al., 2010; SOMERVILLE et al., 2010; KALT et al., 2011; AZEVEDO et al., 2012). With the ever-increasing importance of this
forage in Brazil, a trait that should be taken into account
is the production stability of genotypes, which can be used to select materials that adapt better to different environmental conditions to provide higher yields and reduce the costs with the culture (DAHER et al. 2003; CUNHA et al. 2013; ROCHA et al. 2015).
The signifi cant effect of the genotype ×
environment interaction indicates inconsistent performance of the genotypes according to the environmental variables. The evaluation of this interaction is essential for plant breeding, because the best genotype in a certain environment may not have the same response in another, so it would be necessary to evaluate the stability of the genotypes (ESCOBAR et al.; 2011, CASTILLO et al., 2012; BOSE et
al., 2014; SINGH et al., 2014). According to Cruz and Carneiro (2014) prefer to use the term stability when referring to the response of cultivars over the years in a certain location (temporal stability). When environments are made up of different locations, in a given year it is preferable to use the term adaptability (geographic
stability). In an experiment in which successive cuts and
evaluations of cultivars are performed over time, it is possible to estimate the temporal stability, which is the greatest interest of producers — an essential factor to guide genetic breeding studies (CUNHA et al., 2013; NASCIMENTO et al., 2013; ROCHA et al., 2015).
There are methods for stability analysis in several environments, and these methods differ in the stability concepts and principles. Among the proposed methods for
study and quantifi cation of the genotype × environment
interaction, procedures based on Yates and Cochran’s
, Plaisted and Peterson’s , and Wricke’s parametrics
methods and Annicchiarico’s , Lin and Binns’ and Kang and Phan’s non-parametric methods (CRUZ and CARNEIRO,
2014; ROCHA et al. 2015). Thus, the objective of the present study was carried out to evaluate stability dry matter yield and to compare different parametric and non-parametric stability methods in elephant grass genotypes for biomass production undergoes successive cuttings in Norte Fluminense region, RJ, Brazil.
MATERIALS AND METHODS
Forty elephant grass genotypes were evaluated
during 2008-2011 seasons at one location (Colégio
Estadual Agrícola Antônio Sarlo Research Farm), Campos
dos Goytacazes/RJ, Brazil (321º 45’ S, 41º 20’ W, and 11 m asl) . The randomized complete blocks design with two replications. The experimental plot consisted of one
rows 1.5 cm apart and 3 m in length. Fertilizers were
applied at 100 kg.ha–1 P
2O5 (single superphosphate) prior
to sowing and 25 kg.ha–1 of N (ammonium sulfate) and
25 kg.ha–1 of K
2O (potassium chloride) in shooting stage in four years. The crop was irrigated as needed and weeds were manually controlled.
Dry matter yield (DMY) was measured based on each plot performance. Afterwards, the plants were cut
for evaluation in four occasions: the fi rst in June 2009 (12
months after planting), the second in April 2010 (10 months
after fi rst cutting), the third in February 2011 (10 months after second cutting), and the fourth in August 2011 (six
months third cutting). The code number and origin of the studied genotypes are presented in Table 1.
Statistical analysis
The combined-analysis model [1]employed was the following, (STEEL et al., 1996), where Yijk is the observed value of the-th genotype on the j-th block within the k-th
cutting; m is the overall mean of the trial; Pi is the effect of the i-th genotype; Bj is the effect of the j-th block; εij is the error associated with the interaction between genotype i
and block j; Sk is the effect of the k-th cutingt; εjk is the error
associated with the interaction between block j and cutting k; PSik is the effect of the interaction between treatment i and cutingt k; εijk is the error associated with the interaction among treatment i, block j, and cutting k.
[1]
Stability methods were employed due to the
signifi cant genotypes and cutting interaction, Yates and Cochran’s, Plaisted and Peterson’s, Wricke’s
the successive cuts as environments of evaluation of
genotypes. Spearman’s coeffi cient (ρ) was used in order to evaluate the degree of concordance among the employed methods.
Yates and Cochran’s (traditional) method
This method consists of a combined analysis of all environments and the subsequent deployment of the squares sum of the environmental effects and of the
genotypes × environment interaction into effects of
environments within each genotype. The genotypes that show the lowest θi values are the most stable. Its stability
estimator is the following [2], where Yij is the mean of genotype i (i = 1, 2,..., g) in environment j (j = 1, 2,..., a); and r is the number of replicates associated with the genotype.
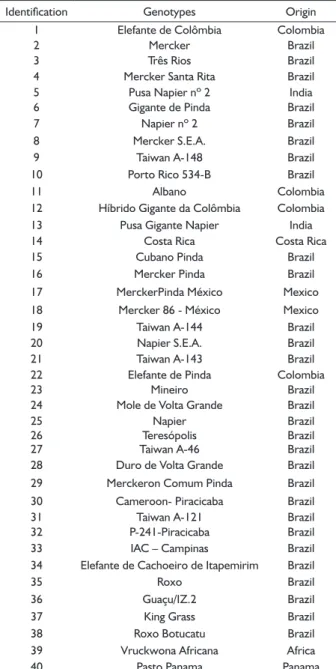
TABLE 1 Genotypes (40) of elephant grass from the Active
Germplasm Bank of elephant grass at Universidade
Estadual do Norte Fluminense.
Identifi cation Genotypes Origin
1 Elefante de Colômbia Colombia
2 Mercker Brazil
3 Três Rios Brazil
4 Mercker Santa Rita Brazil 5 Pusa Napier nº 2 India
6 Gigante de Pinda Brazil
7 Napier nº 2 Brazil 8 Mercker S.E.A. Brazil 9 Taiwan A-148 Brazil
10 Porto Rico 534-B Brazil
11 Albano Colombia
12 Híbrido Gigante da Colômbia Colombia
13 Pusa Gigante Napier India
14 Costa Rica Costa Rica
15 Cubano Pinda Brazil
16 Mercker Pinda Brazil 17 MerckerPinda México Mexico 18 Mercker 86 - México Mexico
19 Taiwan A-144 Brazil
20 Napier S.E.A. Brazil
21 Taiwan A-143 Brazil
22 Elefante de Pinda Colombia
23 Mineiro Brazil
24 Mole de Volta Grande Brazil
25 Napier Brazil
26 Teresópolis Brazil 27 Taiwan A-46 Brazil
28 Duro de Volta Grande Brazil
29 Merckeron Comum Pinda Brazil
30 Cameroon- Piracicaba Brazil
31 Taiwan A-121 Brazil
32 P-241-Piracicaba Brazil
33 IAC – Campinas Brazil
34 Elefante de Cachoeiro de Itapemirim Brazil
35 Roxo Brazil
36 Guaçu/IZ.2 Brazil
37 King Grass Brazil
38 Roxo Botucatu Brazil 39 Vruckwona Africana Africa
40 Pasto Panama Panama
[2]
Plaisted and Peterson’s method
The estimator of the stability (θi) is the arithmetic mean of the variance components of the interaction between pairs of genotypes and environments (σ2
ga) that
involves a certain specifi c genotype. Its estimate was obtained by the following [3], [4], [5] and [6].
in which i=i’ [3]
[4]
[5]
[6]
(for j = 1, 2,..., a)
The relative contribution of each genotype was calculated as presented in [7]
[7]
Wricke’s method
The ecovalence (ωi ) or stability of genotype i is given by, where: : mean of genotype i in environment j; : mean of genotype i; : mean of environment j; and : overall mean. Thus, genotypes with low ωi values have lower deviations in relation to the environments and are more stable
[8]
Annicchiarico’s method
Annicchiarico’s method [9] is based on the
genotypic confi dence index, estimated by, considering
all environments, where µi(g) is the mean percentage of clones i; σz_i(g) is the standard deviation from values Zij, associated with the i-th genotype; z(1-α) is the percentage of the standard normal distribution
function. The adopted confi dence coeffi cient was
ELEPHANT-GRASS FOR ENERGY PURPOSES IN BRAZIL
Lin and Binns’ method
In this method, the parameter Pi [10] defi nes
the stability of a genotype and is defi ned as the
mean-squared distance among the mean of a genotype and
the mean maximum response for all sites, such that
genotypes with lower values correspond to those of better performance. Thus, the estimator is given, Where: Pi = superiority index of the i-th genotype; Xij= yield of the i-th genotype in the j-th location; Mj = maximum response obtained in all clones in the j-th location; and n = number of locations. Next, the expression was decomposed to obtain the genetic deviation and the deviation due to the interaction. The genetic deviation [11] was obtained by the following expression, where: Yi is the mean of genotype I [12]; and is the mean of
clones with maximum response [13].
The values obtained in the individual analyses of variance (per cut) of dry matter yield in t.ha–1 resulted in a relationship between the highest and lowest residual mean square (RMS) of 4.53, indicating a relative homogeneity of variances, which allowed the use of these cuts in the combined analysis of variance. Daher et al. (2003) evaluated elephant-grass cultivars to estimate stability parameters and obtained the proportion of 4.94 between the highest and lowest RMS value for the studied cuts.
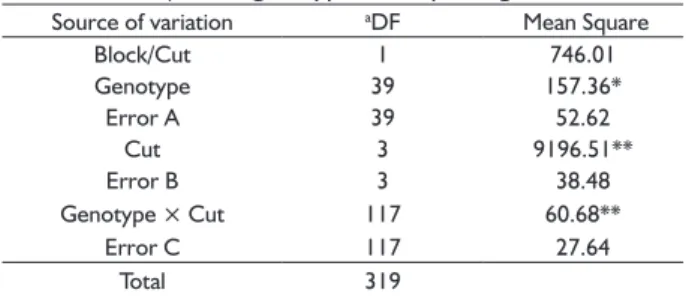
Based on the combined analysis of variance, the genotypes differed from each other, which indicates the
presence of genetic variability. They also showed signifi cant
differences by the F test (P<0.05) for the sources of
variation cut and genotypes × cuts interaction, which
proves that the genotypes’ responses were not the same in all cuts (Table 3). According, Rocha et al. (2015) evaluated elephant-grass in the biannual cuts, combined variance
analysis demonstrated signifi cant effects of cuts, genotypes, and cut × genotype interaction on dry matter yield,
indicating that the genotypes had different performances. [9]
[10]
[11]
RESULTS AND DISCUSSION
Signifi cant differences were observed by the F
test (P<0.05) and (P<0.01) for dry matter yield in all cuts. The average biomass production decreased from
36.96 t.ha–1 (3rd cut) to 11.38 t.ha–1 (4th cut) (Table 2) due to the shorter cutting interval. Daher et al., (2003), evaluated genotypes of elephant grass aiming at stability in forage production and found variation in the means per cut, which ranged from 0.755 t.ha–1 to 8.453 t.ha–1.
For dry matter yield, the lowest experimental coeffi cient of variation was 21.41% (3rd cut), and the
highest was 29.47% (2nd cut). Cunha et al. (2013) evaluated eight genotypes of Pennisetum spp. for forage
production and obtained coeffi cients of variation varying
from 40.3% to 33.7%.
TABLE 2 Analysis variances individual of dry matter yield (t/ha-1)
of 40 genotypes of elephant grass. Source of
variance
Mean Squared
aDF Cutting
1 Cutting 2 Cutting 3 Cutting 4
Block 1 121.43 298.34 7.5 39.4 Genotype 39 68.55** 58.75* 26.9** 15.62*
Residue 39 30.8 33.02 7.28 9.1
Mean 20.55 19.49 36.96 11.38
bCV(%) 27.00 29.47 21.41 26.49
**signifi cant at 1% probability; *signifi cant at 5% probability. a Degrees of
freedom. b coeffi cient of variation.
TABLE 3 Combined variance analysis of dry matter yield (t/
ha-1) of 40 genotypes of elephant grass.
Source of variation aDF Mean Square
Block/Cut 1 746.01
Genotype 39 157.36*
Error A 39 52.62
Cut 3 9196.51**
Error B 3 38.48
Genotype × Cut 117 60.68**
Error C 117 27.64
Total 319
**signifi cant at 1% probability; *signifi cant at 5% probability
a Degrees of freedom.
Once signifi cant differences were observed for the effect of genotype × cutting interaction, methods based
on parametric and non-parametric statistics were used for a more detailed analysis of the genotypes’ response. The analysis of stability by Yates and Cochran’s method,
it was found that genotypes 33, 9, 12, 25, 26, 7, 29, 2, 39,
and 13 were the most stable and the least productive,
whereas genotypes 17, 18, 36, 32, and 16 were the most
productive and unstable (Table 4). This shows that the genotypes with least variance among the cuts were, in general, the least productive and high stability, but these are not interesting for breeding, as they do not respond to improvement in the cuts (ROCHA et al., 2015).
By Plaisted and Peterson’s method, the genotype with the lowest estimator is considered the most stable (CRUZ and CARNEIRO, 2014). The genotypes 4, 37, 3, 1, 30, and 27 demonstrate greater phenotypic stability,
i.e., lower contribution to the genotype × cut interaction, having average dry matter yields of 21.26, 19.60, 23.14, 23.95, 18.96, and 24.84 t∙ha–1 (Table 4). However, Daher [12]
et al. (2003) obtained estimates by Plaisted and Peterson’s methods of forage production of elephant grass and observed that there was no concordance between stability
and productivity; in other words, the most productive
genotypes were not necessarily the most stable.
Wricke’s method considers the genotype with
the lowest ωi (%) estimator as the most stable; this and Plaisted and Peterson’s method are similars, as both use the decomposition of the sum of squares of
the genotype × cuts interaction in the derivation of
their stability parameters (Cruz and Carneiro, 2014). Therefore, the obtained conclusions were the same for both stability methods.
In the method proposed by Annicchiarico, stability is measured by the superiority of the genotype
in relation to the mean of each cuts. The method is based
upon the estimation of a confidence index of a given
genotype showing a relatively superior behavior (Table
4). Based on the confidence index, genotypes 17, 18, 32, 16, 36, 15, and 6 stood out as the most productive and showed the greatest confidence indices always superior
to 110%. This result indicates that on the average of cuts, these genotypes should present, in the worst case scenario, biomass productivities 10% higher than
the mean, i.e., there is a lower risk of adopting these
materials (DEHAAN et al., 2010).
The methodology proposed by Lin and Binns allows for quantifying how close a cultivar is to ideal performance, which is understood as a cultivar has highest production in all studied environments (CRUZ
TABLE 4 Mean and stability parameters of 40 genotypes of elephant grass.
Genotype Mean R MS R θ (%) R Ωi (%) R I (%) R Pi R
1 23.95 16 245.99 18 0.34 4 0.15 4 107.57 10 125.05 14
2 16.68 37 105.41 8 1.35 16 1.25 16 74.5 37 274.95 36
3 23.14 17 211.02 14 0.31 3 0.12 3 104.36 16 134.89 15
4 21.26 23 236.97 16 0.22 1 0.01 1 94.66 19 164.7 23
5 21.72 21 276.19 22 0.76 8 0.61 8 93.33 21 155.33 19
6 26.78 8 482.79 35 2.99 30 3.03 30 114.49 6 90.01 8 7 17.8 34 86.04 6 2.89 29 2.93 29 78.97 33 273 35
8 20.24 25 295.19 26 0.87 11 0.72 11 86.3 26 188.34 25
9 12.88 40 46.26 2 3.09 32 3.14 32 58.2 40 386.16 40 10 24.85 9 350.89 30 1.81 22 1.75 22 105.74 14 105.09 10 11 22.69 18 458.6 34 4.26 35 4.42 35 92.26 22 158.35 20
12 14.33 39 58.26 3 3.48 33 3.57 33 63.25 38 345.67 39
13 15.27 38 140.03 10 1.89 23 1.84 23 62.85 39 308.1 38
14 21.75 20 292.06 25 1.53 19 1.44 19 91.28 23 164 22
15 26.79 7 434.79 32 1.57 20 1.49 20 113.32 7 70.14 5 16 28.29 5 488.69 37 2.79 28 2.82 28 118.93 4 62.6 3 17 30.61 1 564.33 38 3.69 34 3.8 34 131.04 1 43.94 1
18 30.37 2 319.02 28 10.2 39 10.9 39 128.95 2 89.53 7
19 24.26 13 335.82 29 0.8 10 0.65 10 106.31 12 113.95 11 20 20.9 24 438.79 33 2.08 24 2.04 24 83.9 28 168.76 24 21 24.36 12 356.68 31 1.01 13 0.88 13 106.34 11 114.08 12
22 19.5 29 231.37 15 1.26 15 1.15 15 79.15 32 201.12 27
23 19.51 28 259.22 19 0.78 9 0.63 9 83.66 29 205.23 30
24 22.25 19 312.54 27 0.98 12 0.85 12 96.25 18 153.55 18
25 18.48 31 71.52 4 2.53 27 2.53 27 84.22 27 249.03 31
26 17.91 33 78.96 5 3.07 31 3.12 31 80.17 31 262.18 34
27 24.85 10 290.13 24 0.52 6 0.35 6 108.73 8 102.74 9
28 20.19 26 181.77 11 1.11 14 0.99 14 88.65 24 203.58 28
29 17.66 36 103.31 7 2.33 25 2.32 25 77 35 254.88 32 30 18.96 30 237.05 17 0.45 5 0.26 5 77.05 34 203.75 29 31 27.87 6 971.17 40 11.3 40 12.1 40 106.23 13 86.69 6 32 28.96 4 487.57 36 2.45 26 2.45 26 121.76 3 45.28 2
33 17.75 35 42.86 1 5.7 37 5.98 37 81.27 30 287.21 37
34 24.17 14 190.55 12 1.37 17 1.27 17 107.92 9 137.91 16
35 24.5 11 284.7 23 1.6 21 1.52 21 103.85 17 115.98 13
36 29.49 3 743.17 39 9.61 38 10.24 38 116.91 5 69.05 4
37 19.6 27 203.92 13 0.24 2 0.04 2 86.89 25 198.49 26
38 21.55 22 266.02 20 0.74 7 0.58 7 93.4 20 161.52 21
39 17.93 32 107.9 9 4.56 36 4.75 36 76.18 36 261.95 33
ELEPHANT-GRASS FOR ENERGY PURPOSES IN BRAZIL
and CARNEIRO, 2014). By the ranking of genotypes, it could be observed that their productivity was overall inversely related to their Pi estimate (Table 4); genotypes
that displayed high stability, such as 17, 32, 16, 36, 15, 31, and 18, with production above the means of each environment,
contributed least to the interaction as compared with the
maximum. In Cunha et al. (2013), by Lin and Binns’ method,
the genotypes of elephant grass showed low Pi values, which
ranked them as materials with extensive environmental
adaptation and as the most productive, because the
deviation in relation to the maximum productivity of each
environment is reduced as Pi is decreased.
Kang and Phan’s ranking, associated with the Yates and Cochran method, presented genotypes 34, 18,
3, 1, and 27 among the most stable (Table 5). Overall, the
most productive genotypes rose to better positions after
Kang and Phan’s weighting. Genotype 18, which has the 2nd best productivity – 30.65 t∙ha–1 – was considered the most unstable according to Yates and Cochran’s method, and after weighting, it moved into 2nd place.
Because Plaisted and Peterson’s and Wricke’s
method obtained perfect correlation, the application of
Kang and Phan’s procedure resulted in a same ranking of the genotypes. The five best genotypes, according to Plaisted and Peterson’s and Wricke’s method, before
Kang and Phan’s weighting, were 4, 37, 3, 1, and 27, which
were ranked 23rd, 27th, 17th, 16th and 30th, respectively, for productivity. After Kang and Phan’s weighting, genotypes
27, 3, 1, 19, and 4 stood out, being ranked 2nd, 3rd, 4th and 5th place, respectively. In Daher et al. (2003), the same
TABLE 5 Kang and Phan’s associated with stability method of 40 genotypes of elephant grass.
Genotype Mean R K+YC R K+PP R K+W R K+An R K+LB R
1 23.95 16 34 4 16 3 16 3 2 14 2 14
2 16.68 37 45 31 20 30 20 30 4 37 6 37
3 23.14 17 31 3 20 2 20 2 7 17 7 16
4 21.26 23 39 12 23 5 23 5 8 20 8 23
5 21.72 21 43 27 24 10 24 10 9 22 9 20
6 26.78 8 43 29 25 22 25 22 14 6 12 8
7 17.80 34 40 16 27 35 27 35 14 34 12 35
8 20.24 25 51 38 29 20 29 20 18 25 16 25
9 12.88 40 42 20 29 38 29 38 19 40 19 40
10 24.85 9 39 13 29 14 29 14 23 12 19 10
11 22.69 18 52 39 30 31 30 31 23 19 24 19
12 14.33 39 42 21 31 39 31 39 23 38 24 39
13 15.27 38 48 37 31 33 31 33 25 39 24 38
14 21.75 20 45 32 31 23 31 23 26 23 30 21
15 26.79 7 39 14 32 7 32 7 28 7 30 6
16 28.29 5 42 24 33 17 33 17 30 5 32 4
17 30.61 1 39 15 33 19 33 19 33 1 32 1
18 30.37 2 30 2 35 26 35 26 37 2 37 5
19 24.26 13 42 23 35 4 35 4 40 13 38 11
20 20.90 24 57 40 36 29 36 29 42 26 40 24
21 24.36 12 43 28 37 6 37 6 42 11 42 12
22 19.50 29 44 30 38 27 38 27 42 30 43 29
23 19.51 28 47 36 39 21 39 21 43 28 46 28
24 22.25 19 46 33 40 12 40 12 50 18 48 18
25 18.48 31 35 7 41 32 41 32 51 29 50 31
26 17.91 33 38 11 41 36 41 36 52 31 53 33
27 24.85 10 34 6 44 1 44 1 52 8 54 9
28 20.19 26 37 10 46 24 46 24 57 24 56 27
29 17.66 36 43 26 48 34 48 34 58 36 58 34
30 18.96 30 47 35 53 18 53 18 61 32 59 30
31 27.87 6 46 34 53 28 53 28 64 9 62 7
32 28.96 4 40 18 58 11 58 11 64 3 65 2
33 17.75 35 36 8 61 40 61 40 65 33 67 36
34 24.17 14 26 1 61 13 61 13 67 10 68 15
35 24.50 11 34 5 63 15 63 15 68 15 69 13
36 29.49 3 42 25 64 25 64 25 71 4 72 3
37 19.60 27 40 17 68 8 68 8 74 27 73 26
38 21.55 22 42 22 72 9 72 9 77 21 76 22
39 17.93 32 41 19 72 37 72 37 77 35 78 32
40 23.96 15 36 9 72 16 72 16 80 16 80 17
correlation was observed, wherein the results obtained
from estimates of Kang’s stability parameter ratified the
good performance of the 17 studied genotypes.
Genotypes 17, 18, 32, 36, 16, 6, and 15 stood out
as highly promising by Lin and Binns’ method. However, the genotypes indicated by Kang Phan’s associated with
Lin and Binns’ method were 17, 32, 36, 16, 18, 15, and 31, keeping the first five that showed high stability both
in favorable and unfavorable environments (Table 5). In Annicchiarico’s method, the genotypes with the
highest confidence index were those with highest stability.
Associated with Kang and Phan’s, this method indicated
genotypes 17, 18, 36, 16, 6, and 15 as the most stable
and productive. Thus, both methodologies presented good concordance in identifying the cultivars with greatest stability (DEHAAN et al., 2010; ROCHA et al., 2015).
The methods showed a positive correlation
with the mean at the significance level of 1%, indicating that one of them is sufficient for the selection of stable genotypes, except Plaisted and Peterson’s and Wricke’s, which were not significant (Table 6). Scapim et al. (2010)
selected best cultivars of popcorn based on stability
and adaptability methods and found a significant and positive correlation between Wricke’s method and the
production mean. Yates and Cochran’s method showed
a non-significant correlation with Plaisted and Peterson’s and Wricke’s, and negative and significant correlations with the others; its correlation with the mean, for instance, was –0.865 (p<0.01), indicating that individuals
with lower variation throughout the cuts have lower production means.
According to Spearman’s coefficient, the methods of Plaisted and Peterson and Wricke were perfectly
correlated with each other (ρ=1), and so they have similar correlations with the other methods. This concordance between the estimates of parameters of these two stability methods reveals that the indication of cultivars is the same irrespective of the method, and that the use of both is necessary. Lin and Binns’ method had high positive correlations with the means of the
genotypes (0.989) and with Annicchiarico’s (0.962), and
the results obtained by Annicchiarico’s method were very similar to those obtained by the model of Lin and Binns. Contrary to Cunha et al., (2013), who evaluated eight elephant-grass genotypes, Spearman’s correlation between Lin and Binns’ method and the mean was negative, and Annicchiarico’s method had a correlation
of 0.967 with the productivity mean.
With the use of Kang and Phan’s methodology associated with Yates and Cochran’s there was no
significant correlation with the mean, Plaisted and Peterson, Wricke and Lin and Binns. Positive correlation
was only found with Annicchiarico’s method (ρ = 0.338). Kang and Phan’s weighting associated with Plaisted and Peterson’s showed to be correlated with the mean productivity and with all methods (P < 0.01), except for Yates and Cochran and Kang and Phan’s associated with Yates and Cochran’s. The same can be concluded for Kang
and Phan’s method associated with Wricke’s, since both had a correlation coefficient of 1. Kang and Phan’s method
associated with Annicchiarico and Lin and Binns presented
a significant correlation with Annicchiarico, Lin and Binns,
Kang and Phan associated with Plaisted and Peterson and
Wricke. The correlation between Annicchiarico’s method
associated with Kang and Phan’s with the Plaisted and
Peterson (–0.044), Wricke (–0.044) and Kang and Phan associated with Yates and Cochran (0.606) were not significant. The results of the methodology of Lin and Binns
and Annicchiarico were similar, which is in agreement with the results obtained by Rocha et al., (2015) regarding the similarity in the recommendation of the genotypes by these methodologies.
CONCLUSIONS
The present study reported stability analysis indicated that the parametric methods to give emphasis to inferior genotypes in productivity values. On the other hand, non-parametric methods (LIN and BINNS and Annicchiarico), which recommend deviations
from the maximum means, to identified superior
TABLE 6 Spearman’s correlations among the stability parameters of the different methods utilized in 40 genotypes of elephant grass.
YC PP Wi I Pi K+YC K+PP K+ωi K+I K+Pi
Mean –0.865** –0.076 –0.076 0.967** 0.989** 0.209 0.579** 0.579** 0.988** 0.995** YC - 0.103 0.103 –0.765** –0.870** 0.285 –0.432** –0.432** –0.821** –0.869**
PP - - 1.000 –0.007 –0.017 0.030 0.736** 0.736** –0.044 –0.039
Wi - - - –0.007 –0.017 0.030 0.736** 0.736** –0.044 –0.039
I - - - - 0.962** 0.338* 0.635** 0.635** 0.991** 0.971**
Pi - - - 0.179 0.629** 0.629** 0.980** 0.997**
K+YC - - - 0.248 0.248 0.269 0.194
K+PP - - - 1.000 0.606** 0.614**
K+ωi - - - 0.606** 0.614**
K+I - - - 0.988**
K+Pi - - -
ELEPHANT-GRASS FOR ENERGY PURPOSES IN BRAZIL
genotypes. The Genotypes Mercker Pinda-México, Mercker 86-México, Guaçu/IZ, Mercker Pinda,
P-241-Piracicaba, and Cubano Pinda were stable responsive to favorable environment. Hence, there genotypes
may be exploited in future breeding programmes for
biomass production in order to improve productivity of upland elephant grass over environment.
REFERENCES
ANDERSON W.F.; DIEN B.S.; BRANDON S.K.; PETERSON
J.D. Assessment of Bermuda grass and bunch grasses
as feedstocks for conversion to ethanol. Applied
Biochemistry Biotechnology, v. 145, p.13-21,2008.
AZEVEDO, A.L.S.; COSTA, P.P.; MACHADO, J.C.; MACHADO, M.A.; PEREIRA, A.V.; LEDO, F.J. da S. Cross Species Amplification of Pennisetum glaucum Microsatellite Markers
in Pennisetum purpureum and Genetic Diversity of Napier Grass Accessions. Crop Science, v.52, p. 1776-1785,2012.
BOSE, L. K.; JAMBHULKAR, N. N.; PANDE, K.; SINGH,
O. N. Use of AMMI and other stability statistics in the simultaneous selection of rice genotypes for yield and stability under direct-seeded conditions. Chilean Journal
of Agricultural Research, v. 74,p. 3-9, 2014.
CASTILLO, D.; MATUS, I.; DEL POZO, A.; MADARIAGA ,R.; MELLADO, M. Adaptability and genotype × environment
interaction of spring wheat cultivars in Chile using regression analysis, AMMI, and SREG. Chilean Journal of
Agricultural Research ,v. 72,p.167-174, 2012.
CRUZ, C.D.GENES: a software package for analysis in experimental statistics and quantitative genetics. Acta
Scientiarum. Agronomy , v.35, p.271-276, 2013.
CRUZ, C.D.; CARNEIRO, P.C.S. Modelos Biométricos
Aplicados ao Melhoramento Genético. Viçosa, Brazil:
Viçosa University Press, 2014,564p.
CUNHA, M. V. da; LIRA, M. DE A.; SANTOS, M. V. F. dos; DUBEUX JÚNIOR, J. C. B;, DE MELLO, A. C. L.; FREITAS, E. V. Adaptabilidade e estabilidade da produção de forragem por meio de diferentes metodologias na seleção de clones
de Pennisetum spp. Revista Brasileira de Ciências
Agrárias, v. 8, p.681-686, 2013.
DAHER, R.F.; PEREIRA, M. G.; AMARAL JR, A. T. A.; PEREIRA, V.;
LÉDO, F. J. S.; DAROS, M. Estabilidade da produção forrageira em clones de capim-elefante (Pennisetum purpureum Schum.).
Ciência Agrotecnologia, v. 27 ,p. 788-797,2003.
DAHER, R. F.; SOUZA, L.B.; GRAVINA, G.A.; MACHADO, J.C.; RAMOS, H.C.C.; SILVA, V.Q.R.; MENEZES, B.R.S.; SCHNEIDER, L.S.A.; OLIVEIRA, M.L.F.; GOTTARDO, R.D.
Use of elephant grass for energy production in Campos dos Goytacazes-RJ, Brazil. Genetics and Molecular
Research, v.13, p.10898-10908, 2014.
DEHAAN, L. R.; WEISBERG, S.; TILMAN, D.; FORNARA, D.
Agricultural and biofuel implications of a species diversity
experiment with native perennial grassland plants.
Agriculture, Ecosystems and Environment,v. 137, p.33–
38, 2010.
ESCOBAR, M.; BERTI M.; MATUS I.; TAPI M; JOHNSON, B. Genotype × environment interaction in canola
(Brassica Napus l.) seed yield in Chile. Chilean Journal of
Agricultural Research,v. 71, p.175-186, 2011.
JAKOB, K.; ZHOU F.; PATERSON, A.H. Genetic improvement of C4 grasses as cellulosic biofuel feedstocks. In Vitro Cellular
e Developmental Biology-Plant, v. 45, p. 291-305, 2009.
KALT, G. ; KRANZ ,L. L. Assessing the economic efficiency of
bioenergy technologies in climate mitigation and fossil fuel replacement in Austria using a techno-economic approach.
Applied Energy, v. 88, p.3665-3684, 2011.
LEE, M.K.; TSAI, W.T.; TSAI, Y.L.; LIN S.H. Pyrolysis of napier
grass in an induction-heating reactor. Journal of Analytical
and Applied Pyrolysis. v. 88, p.110-116, 2010.
MENEZES B.R.; DAHER R.F.; GRAVINA G.D.A.; PEREIRA A.V.; SOUSA L.B.; RODRIGUES E. V.; SILVA, V.B.; GOTTARDO, R.D.;SCHNEIDER L.S.A. ; NOVO, A.A Estimates of heterosis
parameters in elephant grass (Pennisetum purpureum
Schumach.) for bioenergy production. Chilean Journal of
Agricultural Research, v.75, p. 395-401, 2015.
MONTI, A.; ZATTA, A. Root distribution and soil moisture
retrieval in perennial and annual energy crops in Northern Italy. Agriculture, Ecosystems and Environment,
v.132,p. 252, 2009.
NASCIMENTO, M.; NASCIMENTO, A. C. C.; CIRILLO, M. Â.; FERREIRA, A.; PETERNELLI, L. A.; DE PAULA, R. F.
Association between responses obtained using adaptability and stability methods in alfalfa. Semina: Ciências
Agrárias, v. 34, p. 2545-2554, 2013.
OLIVEIR, É.; DAHER, R. F.; PONCIANO, N. J.; DE AMARAL GRAVINA, G.; de ALMEIDA SANT’ANA ,J. A.;
GOTTARDO, R. D.; SILVA, V.B.; ROCHA, A.S. Variation of
Morpho-Agronomic and Biomass Quality Traits in Elephant
Grass for Energy Purposes According to Nitrogen Levels.
American Journal of Plant Sciences, v.11, p.1685, 2015.
OLIVEIRA, A. V. de; DAHER, R. F.; MENEZES, B. R. DA S.; GRAVINA, G. DE A.; SOUSA, L. B. DE ;GONÇALVES, A. C. DA S. ; OLIVEIRA, M. L. F. Avaliação do desenvolvimento de 73 genótipos de capim-elefante em Campos dos Goytacazes
- RJ. Boletim Indústria animal, v.70, p.119-131, 2013.
OLIVEIRA, M. L. F; DAHER, R. F.; GRAVINA, G. A.; SILVA, V.B.; VIANA, A.P.; RODRIGUES, E.V.; SHIMOYA A.; AMARAL JÚNIOR A.T.; MENEZES, B.R.S. ;ROCHA, A.S. Pre-breeding
of elephant grass for energy purposes and biomass analysis in Campos dos Goytacazes-RJ, Brazil. African Journal
ROCHA, A.S.; DAHER, R.F.; GRAVINA, G.A.; PEREIR,A A.V.; RODRIGUES, E.V.; VIANA, A.P.; OLIVEIRA, E.S.
Comparison of stability methods in elephant-grass genotypes for energy purposes. African Journal of
Agricultural Research, v. 10, p. 4283-4294, 2015.
ROSSI, D.A.; MENEZES, B.R.S.; DAHER, R.F.; GRAVINA, G.A.; LIMA, R.S.N.; LÉDO, F.J.S.; GOTTARDO, R.D.; CAMPOSTRINI, E. ; SOUZA, C. L.M. Canonical
correlations in elephant grass for energy purposes. African
Journal Biotechnology,v. 36, p. 3666-3671, 2014.
SANTOS M. M. P.; DAHER, R. F.; PONCIANO, N. J.; DE AMARAL GRAVINA, G.; PEREIRA, A.V.; SANT’ANA, J. A.; SANTOS, C. L. Características produtivas de capim-elefante sob doses de fósforo e nitrogênio para fins energéticos. Científica, v. 42, p.354-365,2014.
SANTO, M. M. P.; DAHER, R. F.; PONCIANO, N. J.; GRAVINA ,G. A.; PEREIRA, A. V.; SANTOS, C. L. Respostas do capim-elefante sob doses de adubação azotada de cobertura para
fins energéticos. Revista de Ciências Agrárias, v. 37,
p.100-108, 2014.
SCAPIM, C. A.; PACHECO, C. A. P.; AMARAL JÚNIOR, A. T.; VIEIRA, A.; PINTO, R. J. B.; CONRADO, T. V. Correlations
between the stability and adaptability statistics of popcorn cultivars. Euphytica, 174, 209-218, 2010.
SCHOLL, A. L.; MENEGOL, D.; PITARELO, A.P.; FONTANA, R.C.; ZANDONA FILHO, A.; RAMOS, L.P.; DILLON, A.J.P.;
CAMASSOLA M. Elephant grass (Pennisetum purpureum
Schum.) pretreated via steam explosion as a carbon source
for cellulases and xylanases in submerged cultivation.
Industrial Crops and Products ,v. 70, p. 280–291, 2015.
SINGH, S. A.; SINGH, V.V.; CHOUDHARY A. D. Genotype×
environment interaction and yield stability analysis in multienvironment. Tropical and Subtropical
Agroecosystems, v. 17, n.3, 2014.
SOMERVILLE, C.; YOUNGS H.; TAYLO C.; DAVIS S.C.; LONGS, S.P. Feedstocks for lignocellulosic biofuels.
Science,v. 329,p. 790–792, 2010.
STEEL, R.G.D.; TORRIE, J.H.; DICKEY, D.A.Principles and
procedures of statistics: A biometrical approach.