http://dx.doi.org/10.1590/S1678-9946201860062
1Universidade Federal do Maranhão,
Programa de Pós-Graduação em Saúde Coletiva São Luís, Maranhão, Brazil
2Universidade Federal do Maranhão,
Programa de Pós-Graduação em Saúde e Ambiente, São Luís, Maranhão, Brazil
3Kroton Educacional, São Luís, Maranhão,
Brazil
4Fundação Oswaldo Cruz, Escola Nacional
de Saúde Pública Sergio Arouca, Rio de Janeiro, Rio de Janeiro, Brazil
5Secretaria Municipal de Saúde, São Luís,
Maranhão, Brazil
6Universidade Federal do Maranhão, Curso
de Geografia, São Luís, Maranhão, Brazil
7Universidade CEUMA, Programa de
Pós-Graduação em Gestão de Programas e Serviços de Saúde, São Luís, Maranhão, Brazil
8Universidade Federal do Maranhão,
Programa de Pós-Graduação em Ciências Sociais, São Luís, Maranhão, Brazil
9Universidade Federal do ABC, Programa
de Pós-Graduação em Ciência e Tecnologia Ambiental, São Bernardo do Campo, São Paulo, Brazil
Correspondence to: Silmery da Silva Brito Costa
Universidade Federal do Maranhão, Programa de Pós-Graduação em Saúde Coletiva, Rua Barão de Itapary, 155, Centro, CEP 65020-070. São Luís, MA, Brazil Tel: +55 98 32729674, +55 98 984027294
E-mail: [email protected]
Received: 25 April 2018
Accepted: 17 September 2018
Spatial analysis of probable cases of dengue fever, chikungunya fever and zika virus infections in Maranhao
State, Brazil
Silmery da Silva Brito Costa1, Maria dos Remédios Freitas Carvalho Branco1, José Aquino Junior2, Zulimar Márita Ribeiro Rodrigues2, Rejane Christine de Sousa Queiroz1, Adriana Soraya Araujo2, Ana Patrícia Barros Câmara1, Polyana Sousa dos Santos3, Emile Danielly Amorim Pereira4, Maria do Socorro da Silva5, Flávia Regina Vieira da Costa2, Amanda Valéria Damasceno dos Santos6, Maria Nilza Lima Medeiros7, José Odval Alcântara Júnior8, Vitor Vieira Vasconcelos9, Alcione Miranda dos Santos1, Antônio Augusto Moura da Silva1
ABSTRACT
Dengue fever, chikungunya fever, and zika virus infections are increasing public health problems in the world, the last two diseases having recently emerged in Brazil. This ecological study employed spatial analysis of probable cases of dengue fever, chikungunya fever, and zika virus infections reported to the National Mandatory Reporting System (SINAN) in Maranhao State from 2015 to 2016. The software GeoDa version 1.10 was used for calculating global and local Moran indices. The global Moran index identified a significant autocorrelation of incidence rates of dengue (I=0.10; p=0.009) and zika (I=0.07; p=0.03). The study found a positive spatial correlation between dengue and the population density (I=0.31; p<0.001) and a negative correlation with the Performance Index of Unified Health System (PIUHS) by basic care coverage (I=-0.08; p=0.01). Regarding chikungunya fever, there were positive spatial correlations with the population density (I=0.06; p=0.03) and the Municipal Human Development Index (MHDI) (I=0.10; p=0.002), and a negative correlation with the Gini index (I=-0.01; p<0.001) and the PIUHS by basic care coverage (I=-0.18; p<0.001). Lastly, we found positive spatial correlations between Zika virus infections and the population density (I=0.13; p=0.005) and the MHDI (I=0.12; p<0.001), as well as a negative correlation with the Gini index (I=-0.11; p<0.001) and the PIUHS by basic care coverage (I=-0.05; p=0.03). Our results suggest that several socio-demographic factors influenced the occurrence of dengue fever, chikungunya fever, and zika virus infections in Maranhao State.
KEYWORDS: Dengue fever. Chikungunya fever. Zika virus infection. Spatial analysis.
Socioeconomic factors. Socio-demographic factors
INTRODUCTION
Arboviruses are associated with outbreaks and epidemics of great magnitude; these events generate significant economic and social outcomes in several countries1
and represent a growing public health problem due to their potential for dispersion and the occurrence of a high number of severe cases with neurological, joint and hemorrhagic complications2.
an increase of severe cases and death. Furthermore, the circulation of chikungunya virus with autochthonous transmission since 2014 and the confirmed circulation of zika virus infections for the first time in May 20151 represent
a new challenge for public health policies.
Until the epidemiological week 52 of 2017, the Northeast region had the highest number of probable cases of dengue fever and chikungunya fever, 86,386 and 142,131, respectively, and the second largest number of zika virus cases (5,270), the equivalent to 30% of all cases in the country. During the same period in Maranhao, a State of the Brazilian Northeast, dengue fever had a higher incidence rate (101.4 cases per 100,000 inhabitants), followed by chikungunya fever (92.3 cases per 100,000 inhabitants) and zika virus infections (7.4 cases per 100,000 inhabitants)3.
Aedes aegypti, the main vector of these arboviruses,
is found in all regions of Brazil1,4. Most of the country
has climate patterns favorable for vector reproduction and survival5. In conjunction with the climate, other factors have
also contributed to the proliferation of this vector, such as poor urban infrastructure, irregularities in water supply and solid waste collection and little effectiveness of government programs for the vector control1.
Spatial analysis has been considered a promising tool in the identification of priority areas for health interventions6.
However, there are several gaps in the knowledge about the use of this tool to understand the dispersion of dengue fever, chikungunya fever, and zika virus infections simultaneously. The study of the spatial occurrence of these diseases addresses conditioning factors such as socioeconomic and urban infrastructure variables, broadening the understanding of diseases dynamics, indicating important actions in the context of health surveillance7.
The Performance Index of Unified Health System (PIUHS) structure is based on the priorities or health guidelines to attend the objectives of improvement and development of services, as well as the population health conditions prevention programs and control of dengue epidemics, among others8. On this perspective, the analysis
of PIUHS indicators that evaluate the services practices can contribute to the study of the distribution of diseases such as dengue fever, chikungunya fever and zika virus infections. This study has the following hypotheses: the spatial distribution of the probable cases of dengue fever, chikungunya fever and zika virus infections occurs heterogeneously in Maranhao, and there is a relationship between these diseases and sociodemographic factors, economic factors, PIUHS and vector infestation. Thus, this study aims to analyze the spatial distribution of these diseases and to evaluate the relationship of these diseases with population density, Gini Index, Municipal Human
Development Index (MHDI), PIUHS and the index of infestation by A. aegypti in the municipalities of the
Maranhao State.
METHODS
This is an ecological study with spatial analysis of probable cases of dengue fever, chikungunya fever and zika virus infections that occurred in the Maranhao State and were reported to the National Mandatory Reporting System (SINAN) from January 2015 to December 2016, using the municipality as the unit of analysis.
Study location
The Maranhao State is located in the Northeast region of Brazil. It has an area of 331,983 km2, being the eighth largest State in Brazil and the second largest in the Northeast in terms of territorial extension. The estimated population in 2015 was 6,904,241 inhabitants, and the population density was 20.8 inhabitants/km2. The State has 217 municipalities divided into five mesoregions: North, West, Center, East and South Maranhao9.
Definition of probable cases and data collection
According to the Ministry of Health, probable cases of dengue fever, chikungunya fever and zika virus infections include all reported cases except for those discarded by a negative laboratory diagnosis or diagnosed with other diseases3. The probable cases of the three diseases were
obtained from the SINAN at the State Health Secretariat of Maranhao (SES/MA). Due to the increase of cases, there was a delay in data entry in the Epidemiological Surveillance of the Municipal Secretariat of Sao Luis (VE/SEMUS/SL), the State capital. Aiming at the completeness of data, members of our research team promoted data entry and performed inconsistencies corrections of SINAN information in the VE/SEMUS/SL facilities from January to June 2017. In July 2017, SINAN data was transferred to Excel spreadsheets.
Infestation byAedes aegypti
Aedes aegypti infestation was analyzed based on the
Rapid Assay of the Larval Index for A. aegypti (LIRAa),
which is a sample methodological tool that reports the Building Infestation Index (BII), the Breteau Index (BI) and the Container Type Index for A. aegypti in its larval
stage10. In this study, the BII values of three LIRAa surveys
used: the first was from the period of April to May, the second was from July to August and the last was from October to November. Data on the BII were obtained from SES/MA. Regarding the risk of transmission, a BII less than 1% is considered satisfactory, a BII from 1% to 3.9% is considered alert, and a BII greater than 3.9% is considered at risk10.
Socio-demographic variables, economic variables and the performance index of the Unified Health System
MHDI was obtained from the Human Development Atlas11. It consists of three indicators: income, longevity and education resulting in a number between zero and one. The closer the value is to one, the greater the full human development, following the United Nations Development Program (UNDP) HDI classification: very low (up to 0.499), low (0.500 to 0.599), medium (0.600 to 0.699), high (0.700 to 0.799) or very high (greater than or equal to 0.800)11. The
Gini index and the population density were obtained from the 2010 demographic census. The Gini index measures the social inequality and ranges from zero to one: zero corresponds to complete equality (in the income item), and one corresponds to complete inequality9.
PIUHS is comprised of 24 indicators that evaluate the UHS performance on the scope of the basic care, of medium and high complexity on the access axis and effectiveness in each Brazilian municipality12. Indicators are measured
from parameters and assigned using a grade ranging from 0 (zero) to 10 (ten) for each municipality evaluated13.
Two PIUHS indicators were used in this study. The first one was the population coverage, which was estimated by the basic health teams that evaluate the provision of basic health care services and the ease of access, having as a parameter 100% of coverage, considering one team to each group of 3,000 inhabitants on the evaluated year. The second indicator was the proportion of hospitalizations sensitive to basic care, considering the parameter that 28.6% is equal to the average proportion of hospitalizations sensitive to basic care to the city’s residents. It assumes that hospitalizations are necessary and that among the diseases, there is a subset of causes more sensitive to the effectiveness of basic care, in which proportions of these hospitalizations can be avoided by more qualified actions of care developed at this health care level12.
Calculation of incidence rate
The incidence rate of the three diseases was calculated based on the ratio between the number of probable cases of dengue fever, chikungunya fever and zika virus infections
(numerator), and the population unit of each municipality (denominator) multiplied by 100,000 inhabitants in the period from 2015 to 2016. To calculate the incidence rate of each disease separately, only the numerator was modified. Population estimates by municipality for the year 2015 were obtained from the Brazilian Institute of Geography and Statistics (IBGE) website9.
Spatial analysis
Every municipality was included in this spatial analysis, regardless of the existence of notified cases. To establish autocorrelation in the univariate spatial analysis, the global Moran index (I) was calculated and used to analyze the spatial distribution pattern and the intensity of a cluster according to municipalities. The local Moran index produces a normalized value (attribute values subtracted from its mean and divided by the standard deviation), specific for each area, allowing the identification of a cluster of areas with significant patterns of spatial association14.
The local Moran Scatter Graph was used to compare the value of each municipality with its neighbors and to verify spatial dependence. The generated quadrants were analyzed as follows: Q1 - High/High (positive values, positive means); Q2 - Low/Low (negative values, negative means), indicating points of positive spatial association or similar to neighbors; Q3 - High/Low (positive values, negative means); and Q4 - Low/High (negative values, positive means), indicating points of negative spatial association. Clusters are located in the quadrants Q1 and Q2 and outliers are located in the quadrants Q3 and Q415.
For both indices, the significance level for spatial autocorrelation was p <0.05. Results from the local Moran index were demonstrated by the Lisa Cluster Map. To test
the spatial correlation between the incidence rates of each disease and the population density, Gini index, MHDI and PIUHS, a bivariate spatial analysis was performed using the global and local Moran indices.
The open access software GeoDa, version 1.10 was used for the univariate and bivariate spatial analysis; the global and local Moran indices were calculated; the pseudo-significance tests were calculated for 999 permutations. Mitigated taxes were calculated using empirical Bayesian estimators to determine a weighted average rate, considering regional variances and allowing comparisons between different populations16.
RESULTS
of zika virus infections were recorded in Maranhao State. After excluding cases with no information on the patients’ municipality of residence 37,726 probable cases of dengue fever, 9,445 cases of chikungunya fever and 5,125 cases of zika virus infections were analyzed.
The highest number of cases reported was in 2016, with 27,702 cases of dengue, 9,267 cases of chikungunya fever and 5,125 cases of zika virus infections. During this period, the following 16 municipalities did not report any cases of the three diseases: Afonso Cunha, Altamira do Maranhao, Bacurituba, Benedito Leite, Boa Vista do Gurupi, Buriti, Cajapio, Fernando Falcao, Igarape Grande, Lago do Junco, Luis Domingues, Maraja do Sena, Olinda Nova do Maranhao, Paulo Ramos, Sao Felix de Balsas, and Sao Francisco do Maranhao.
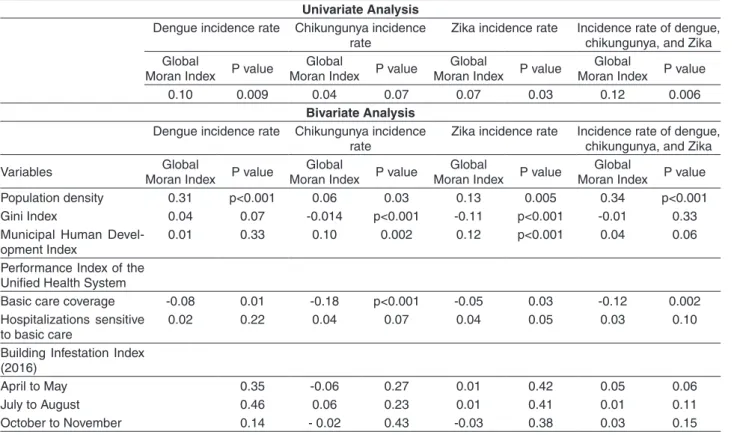
The global Moran index showed a statistically significant positive spatial autocorrelation for the incidence rates of dengue fever (I=0.10; p=0.009) and zika virus infections (I=0.07; p=0.03) and for the incidence rate of the three diseases (I=0.12; p=0.006). The global Moran index did not show a significant spatial autocorrelation for the chikungunya fever incidence rate. Positive and weak spatial correlations were found between dengue incidence rates and population density (I=0.31; p<0.001), as well as a negative spatial
correlation between dengue incidence rates and PIUHS for basic care coverage (I=-0.08; p=0.01) (Table 1).
Moreover, positive and weak spatial correlations were identified between chikungunya fever incidence rates and the population density (I=0.06; p=0.03) and the MHDI (I=0.10; p=0.002), as well as negative spatial correlations were found between chikungunya fever incidence rates and the Gini index (I=-0.014; p<0.001), and chikungunya fever incidence rates and the PIUHS for basic care coverage (I=-0.18; p<0.001). Positive and weak spatial correlations were also observed between zika virus infections incidence rates and the population density (I=0.13; p=0.005) and zika virus infections incidence rates and the MHDI (I=0.12; p<0.001) (Table 1).
Conjointly, negative spatial correlations were established between zika virus infections incidence rates and the Gini index (I=-0.11; p<0.001), and the PIUHS for basic care coverage (I=-0.05; p=0.03). The incidence rates of the three diseases showed a positive and weak correlation with the population density (I=0.34; p<0.001), and negative spatial correlations with the IPUHS for basic care coverage (I=-0.12; p=0.002). The BII did not present a significant spatial correlation with the incidence rates of any of the three arboviruses (Table 1).
Table 1 - Univariate analysis of the incidence rates of dengue fever, chikungunya fever, and zika virus infections and bivariate analysis between the incidence rates and the population density, Gini Index, Municipal Human Development Index, Performance Index of Unified Health System as well as the Building Infestation Index. Maranhao, 2015-2016.
Univariate Analysis Dengue incidence rate Chikungunya incidence
rate
Zika incidence rate Incidence rate of dengue, chikungunya, and Zika Global
Moran Index P value
Global
Moran Index P value
Global
Moran Index P value
Global
Moran Index P value
0.10 0.009 0.04 0.07 0.07 0.03 0.12 0.006
Bivariate Analysis Dengue incidence rate Chikungunya incidence
rate
Zika incidence rate Incidence rate of dengue, chikungunya, and Zika
Variables Global
Moran Index P value
Global
Moran Index P value
Global
Moran Index P value
Global
Moran Index P value
Population density 0.31 p<0.001 0.06 0.03 0.13 0.005 0.34 p<0.001
Gini Index 0.04 0.07 -0.014 p<0.001 -0.11 p<0.001 -0.01 0.33
Municipal Human Devel-opment Index
0.01 0.33 0.10 0.002 0.12 p<0.001 0.04 0.06
Performance Index of the Unified Health System
Basic care coverage -0.08 0.01 -0.18 p<0.001 -0.05 0.03 -0.12 0.002
Hospitalizations sensitive to basic care
0.02 0.22 0.04 0.07 0.04 0.05 0.03 0.10
Building Infestation Index (2016)
April to May 0.35 -0.06 0.27 0.01 0.42 0.05 0.06
July to August 0.46 0.06 0.23 0.01 0.41 0.01 0.11
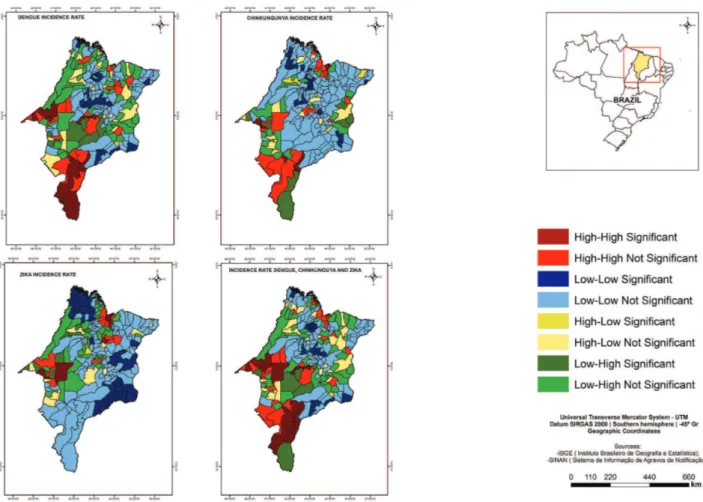
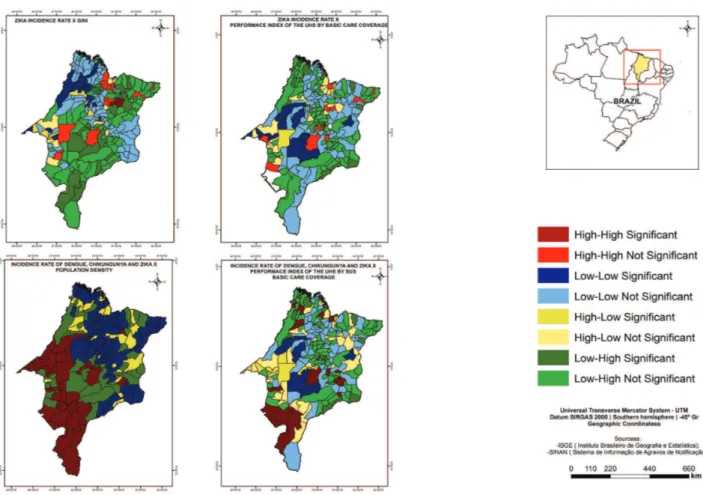
The local Moran index identified cores of clusters of municipalities with high incidence rates of dengue fever in the Western, Southern and Center regions; of chikungunya fever in the West, South and North regions; and of zika virus infections in the Western and North regions of Maranhao State (Figure 1).
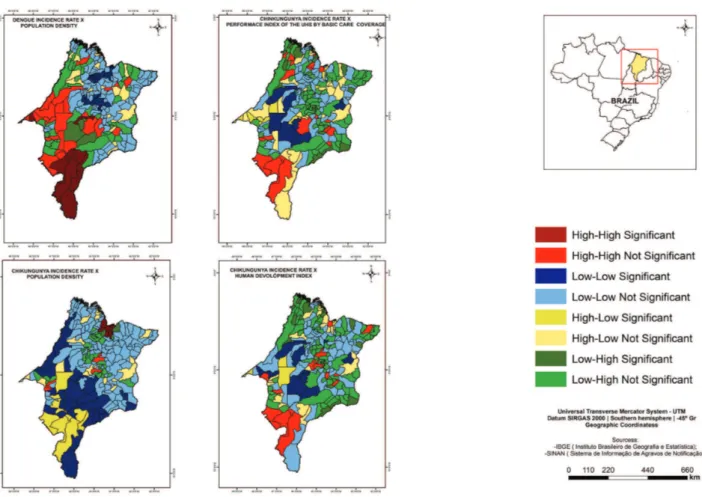
According to the local Moran index, the cores of a cluster of municipalities with both, high dengue fever incidence rates and high population density were identified in the Center and West, being the most representative in the South of the State, as well as cores of a cluster of municipalities with low dengue fever incidence rates and low PIUHS for basic care coverage, in Center-West the State (Figure 2).
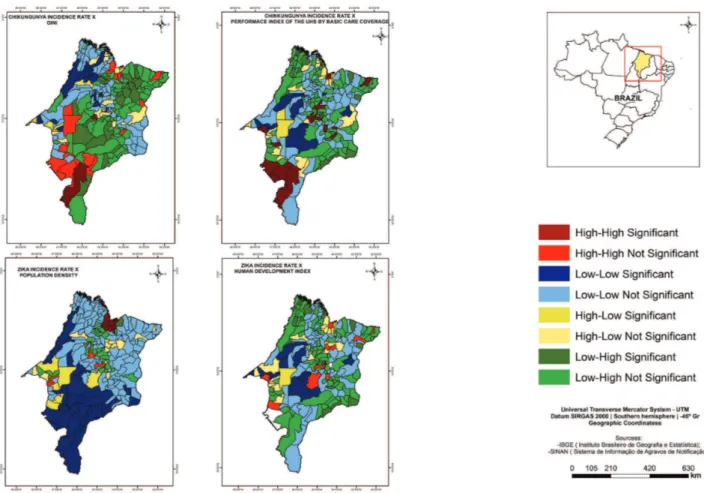
There were cores of a cluster of municipalities with high chikungunya fever incidence rates and high population density in the North; high values of MHDI in the West, Center and North (Figure 2); and high values of GINI in the Center and South (Figure 3). The study has also found the cores of a cluster of municipalities with low chikungunya fever incidence rates and low values of GINI in the Center and West and the low PIUHS for basic care coverage most representative in the Center-West of the State (Figure 3).
The study identified the cores of a cluster of municipalities of high zika virus infections incidence rates and high population density in the North; high values of MHDI in the West, Center and North (Figure 3); and high values of GINI in the North of the State (Figure 4). Furthermore, there were the cores of a cluster of municipalities with low zika virus infections incidence rates and low values of MHDI most representative in the Center (Figure 3); low values of GINI in the West and the low PIUHS for basic care coverage in the Center-West (Figure 4).
The cores of a cluster of municipalities with high incidence rates of the three arboviruses and high population density were found in the West, Center and South (Figure 4), as well as cores of a cluster of municipalities with low incidence rates of the three arboviruses and low PIUHS for basic care coverage most representative in the Center-West of the State (Figure 4).
DISCUSSION
The distribution of probable cases of dengue fever and zika virus infections in Maranhao showed a significant
spatial pattern, primarily for dengue fever, which had a predominance of high incidence clusters in the West and Center-South, and for Zika virus infections in the West and North of the State.
The clusters of chikungunya fever and zika virus infections were concentrated within similar mesoregions, especially in North Maranhao, more specifically in Maranhao’s Island. The emergence of these diseases occurred concomitantly in the country, with high incidence rates, predominantly in the Northeast region17. In the city of
Merida, in Mexico, Bisanzio et al.18 found the existence of
a spatio-temporal coherence for the distribution of dengue fever, chikungunya fever and zika virus infections.
Regarding the possible explanatory factors for the distribution of dengue fever, chikungunya fever and zika virus infections, the population density proved relevant in the spatial analysis. According to Scandar et al.19, the
population density is considered a fundamental factor for the high incidence rates of dengue fever, as more populated environments favor the vector proliferation due to ideal conditions for its reproduction, as well to the higher number of individuals susceptible to new infections.
In studies conducted in Espirito Santo20, Rio de Janeiro21
and in two cities in Mexico22, the population density
contributed positively to dengue fever’s incidence rate. However, for Teixeira and Medronho23, not necessarily all
areas of high population density are associated with higher incidence rates of dengue fever, as other factors related to socio-demographic and environmental aspects might better account for it. Barbosa and Silva7and Machado et al.24
found a low spatial correlation between population density and the incidence rate of dengue fever.
The Gini index presented a negative spatial correlation with the incidence rates of chikungunya fever and zika virus infections making it possible to observe an increase in the incidence of these diseases in areas with better Gini index values. Dengue fever did not present a significant correlation with the Gini index. Although dengue is related to low socio-economic levels25, other studies point
to disagreements between socioeconomic indicators and dengue fever incidence rates24,26.
highest IDHM values are probably more populated, present with a higher development level, better infrastructure and a greater access to health services, all of these contributing to the higher rate of reported cases of these diseases.
PIUHS to basic care coverage was significant for dengue fever, chikungunya fever and zika virus infections Clusters of cities with low incidence of these diseases and low PIUHS for basic care coverage were recognized in the same region (Midwest mesoregion of the State). This indicates a likely lower performance of basic care translated into lower report rates of these diseases.
Another point to be considered is the possibility of underreporting in municipalities with fewer reported cases and in those where there were no records during the study period. The underreporting of dengue cases was significant in many studies, contributing to the difficulty of understanding the real incidence rates in the analyzed areas27-30.
Conversely, the simultaneous circulation of the three arboviruses with similar symptoms and the low or no availability of confirmatory tests at the basic care level might have compromised the investigation of one disease
and heightened the others31. In this context, official data
on the incidence rates of arboviruses tend to present a high uncertainty, reinforcing the difficulty of control initiatives and the allocation of therapeutic resources31.
A significant spatial correlation on the incidence rates of dengue fever, chikungunya fever, and zika virus infections with BII was not observed. Notably, only BII of the 54 municipalities that performed LIRAa in 2016 was analyzed, probably contributing to the non-identification of a correlation with BII performed in other cycles regarding the incidence rates of these diseases. LIRAa has become mandatory for all municipalities in the country since 201732.
Although some studies point that LIRAa produces more agile results, the indexes cannot be used to measure the risk dengue fever occurrence33-35.
An advantage of this study is the use of spatial analysis as a tool to help the understanding of the distribution of dengue fever, chikungunya fever, and zika virus infections in Maranhao, identifying priority areas and factors that may be interfering with the incidence rates of diseases in the spatial scope.
Moreover, this analysis differs from purely statistical methods, as it captures the inequalities in geographical spaces when considering the spatial distribution of the event that is being studied7. Further studies could combine the
magnitude and the intensity of variables used in this report and group the municipalities into clusters based on Gaussian (natural breaks) and Paretian (heads and tails) procedures, as proposed by Treviño36.
ACKNOWLEDGMENTS
SSBC was the recipient of a doctorate research fellowship from the Research Scientific and Development Support Foundation of Maranhao (FAPEMA) and ASA was the recipient of a master research fellowship from the Coordination of Improvement of Higher Level Personnel
(CAPES). We thank the FAPEMA for the support program to article publication.
CONFLICT OF INTERESTS
The authors declare that there is no conflict of interest.
FINANCIAL SUPPORT
The National Council for Scientific and Technological Development funded this research.
AUTHORS’ CONTRIBUTIONS
the article and participated in all phases until the final writing of the article. ZMRR: contributed to the design and writing of the article. RCSQ: contributed to the design and writing of the article. ASA: performed data collection from the SINAN and contributed to the writing of the article. APBC: performed the data collection of the SINAN and contributed to the writing of the article. PSS: performed the data collection of SINAN and contributed to the writing of the article. EDAP: contributed to the writing of the article. MSS: contributed to the writing of the article. FRVC: contributed to the writing of the article. AVDS: contributed to data analysis. MNLM: contributed to the writing of the article. JOAJ: contributed to the writing of the article. VVV: contributed to the interpretation of the data, and the final editing of the article. AMS: contributed to the article design, the interpretation of the data, and the final editing of the article. AAMS: contributed to the article design and participated in all stages until the final writing of the article. All authors approved the final version of the manuscript.
REFERENCES
1. Coelho GE. Epidemiologia das arboviroses: avaliação dos métodos de controle realizados pelo Ministério da Saúde - visão de saúde pública. In: Sociedade Brasileira de Dengue/ Arboviroses. Arboviroses de importância para saúde humana. São Paulo: Limay; 2015. p.15-18.
2. Donalisio MR, Freitas AR, Zuben AP. Arboviroses emergentes no Brasil: desafios para a clínica e implicações para a saúde pública. Rev Saude Publica. 2017;51:30.
3. Brasil. Ministério da Saúde. Secretaria de Vigilância em Saúde. Monitoramento dos casos de dengue, febre de chikungunya e febre pelo vírus Zika até a Semana Epidemiológica 52, 2017. Bol Epidemiol. 2018;49:1-13.
4. Braga IA, Valle D. Aedes aegypti: histórico do controle no Brasil. Epidemiol Serv Saude. 2007;16:113-8.
5. Teixeira MG, Siqueira Jr JB, Ferreira GL, Bricks L, Joint G. Epidemiological trends of dengue disease in Brazil (2000– 2010): a systematic literature search and analysis. PLoS Negl Trop Dis. 2013;7:e2520.
6. Rodrigues M, Bonfim C, Portugal JL, Frias PG, Gurgel IG, Costa TR, et al. Análise espacial da mortalidade infantil e adequação das informações vitais: uma proposta para definição de áreas prioritárias. Cienc Saude Coletiva. 2014;19:2047-54. 7. Barbosa IR, Silva LP. Influência dos determinantes sociais e
ambientais na distribuição espacial da dengue no município de Natal-RN. Rev Cienc Plural. 2015;1:62-75.
8. Albuquerque C, Martins M. Indicadores de desempenho no Sistema Único de Saúde: uma avaliação dos avanços e lacunas. Saude Debate. 2017;41 N Esp:118-37.
9. Instituto Brasileiro de Geografia e Estatística. Conheça cidades e estados do Brasil. [cited 2018 Sept 18]. Available from: https:// cidades.ibge.gov.br/
10. Brasil. Ministério da Saúde. Secretaria de Vigilância em Saúde. Departamento de Vigilância das Doenças Transmissíveis. Levantamento rápido de índices para Aedes aegypti - LIRAa - para vigilância entomológica do Aedes aegypti no Brasil: metodologia para avaliação dos índices de Breteau e Predial e tipo de recipientes. Brasília: Ministério da Saúde; 2012.
11. Programa das Nações Unidas para o Desenvolvimento. Atlas
do desenvolvimento humano no Brasil. [cited 2018 Sept 18]. Available from: http://www.atlasbrasil.org.br/2013/pt/home/ 12. Uchimura LY, Felisberto E, Fusaro ER, Ferreira MP, Viana AL.
Avaliação de desempenho das regiões de saúde no Brasil. Rev Bras Saude Mater Infant. 2017;17 Supl 1:S259-70.
13. Brasil. Ministério da Saúde. Departamento de Atenção Básica.
Índice de Desempenho do Sistema Único de Saúde. [cited 2017 Oct 12]. Available from: http://idsus.saude.gov.br/
14. Druck S, Carvalho MS, Câmara G, Monteiro AM, editores. Análise espacial de dados geográficos. Brasília: EMBRAPA; 2004.
15. Medronho RA, Werneck GL. Análise de dados espaciais em saúde.
In: Medronho RA, editor-chefe. Epidemiologia. 2a ed. Rio de
Janeiro: Atheneu; 2009. p.493-511.
16. Marshall RJ. Mapping disease and mortality rates using empirical Bayes estimators. J R Stat Soc Ser C Appl Stat. 1991;40:283-94.
17. Brasil. Ministério da Saúde. Secretaria de Vigilância em Saúde.
Monitoramento dos casos de dengue, febre de chikungunya e febre pelo vírus Zika até a Semana Epidemiológica 32, 2016. Bol Epidemiol. 2016;47:1-13.
18. Bisanzio D, Dzul-Manzanilla F, Gomez-Dantés H, Pavia-Ruz
N, Hladish TJ, Lenhart A, et al. Spatio-temporal coherence of dengue, chikungunya and Zika outbreaks in Merida, Mexico. PLoS Negl Trop Dis. 2018;12:e0006298.
19. Scandar SA, Vieira P, Cardoso Junior RP, Silva RA, Papa M,
Sallum MA. Dengue em São José do Rio Preto, Estado de São Paulo, Brasil, 1990 a 2005: fatores entomológicos, ambientais e socioeconômicos. Bol Epidemiol Paulista. 2010;7:4-16.
20. Honorato T, Lapa PP, Sales CM, Reis-Santos B, Tristão-Sá R,
Bertolde AI, et al. Análise espacial do risco de dengue no Espírito Santo, Brasil, 2010: uso de modelagem completamente Bayesiana. Rev Bras Epidemiol. 2014;17 Supl 2:150-9.
21. Almeida AS, Medronho RA, Valencia LI. Spatial analysis
of dengue and the socioeconomic context of the city of Rio de Janeiro (Southeastern Brazil). Rev Saude Publica. 2009;43:666-73.
22. Reyes-Castro PA, Harris RB, Brown HE, Christopherson GL,
23. Teixeira TR, Medronho RA. Indicadores sócio-demográficos e a epidemia de dengue em 2002 no Estado do Rio de Janeiro, Brasil. Cad Saude Publica. 2008;24:2160-70.
24. Machado JP, Oliveira RM, Souza-Santos R. Análise espacial da
ocorrência de dengue e condições de vida na cidade de Nova Iguaçu, Estado do Rio de Janeiro, Brasil. Cad Saude Publica. 2009;25:1025-34.
25. Khormi HM, Kumar L, Elzahrany RA. Modeling spatio-temporal risk changes in the incidence of dengue fever in Saudi Arabia: a geographical information system case study. Geospat Health. 2011;6:77-84.
26. Mondini A, Chiaravaloti Neto F. Variáveis socioeconômicas e a
transmissão de dengue. Rev Saude Publica. 2007;41:923-30. 27. Roque AC, Santos PF, Medeiros ER. Perfil epidemiológico da
dengue no município de Natal e região metropolitana no período de 2007 a 2012. Rev Cienc Plural. 2015;1:51-61.
28. Lucena LT, Aguiar LO, Bogoevich AC, Azevedo FS, Santos AC,
Vale DB, et al. Dengue na Amazônia: aspectos epidemiológicos no Estado de Rondônia, Brasil, de 1999 a 2010. Rev Pan-Amaz Saude. 2011;2:19-25.
29. Oliveira FL, Dias MA. Situação epidemiológica da dengue,
chikungunya e Zika no estado do RN: uma abordagem necessária. Rev Humano Ser. 2016;1:64-85.
30. Böhm AW, Costa CS, Neves RG, Flores TR, Nunes BP. Tendência
da incidência de dengue no Brasil, 2002-2012. Epidemiol Serv Saude. 2016;25:725-33.
31. Avelino-Silva VI, Ramos JF. Arboviroses e políticas públicas no Brasil. Rev Cien Saude. 2017;7:1-2.
32. Bogaz C. Levantamento sobre infestação do mosquito passa a
ser obrigatório. Brasília: Ministério da Saúde; 2017. [cited 2017 Out 18]. Available from: http://combateaedes.saude.gov.br/ pt/noticias/904-levantamento-sobre-infestacao-do-mosquito passa-a-ser-obrigatorio
33. Honório NA, Codeço CT, Alves FC, Magalhães MA, Lourenço-de-Oliveira R. Temporal distribution of Aedes aegypti in different districts of Rio de Janeiro, Brazil, measured by two types of traps. J Med Entomol. 2009;46:1001-14.
34. Rizzi CB, Rizzi RL, Pramiu PV, Hoffmann E, Codeço CT.
Considerações sobre a dengue e variáveis de importância à infestação por Aedes aegypti. Hygeia. 2017;13:24-40.
35. Rivas AV, Defante R, Delai RM, Rios JA, Britto AS, Leandro
AS, et al. Building Infestation Index for Aedes aegypti and occurrence of dengue fever in the municipality of Foz do Iguaçu, Paraná, Brazil, from 2001 to 2016. Rev Soc Bras Med Trop. 2018;51:71-6.
36. Treviño JA. A. Mapa y jerarquía espacial de la pobreza en México:
Page 6, Figure 2 must be replaced by:
Page 7, Figure 3 must be replaced by: