Parametrization of Models and Use of Estimated Global Solar Radiation
Data in the Irrigated Rice Yield Simulation
João Rodrigo de Castro
1, Santiago Vianna Cuadra
2, Luciana Barros Pinto
3,
João Marcelo Hoffmann de Souza
4, Marcos Paulo dos Santos
5,
Alexandre Bryan Heinemann
61,5
Programa de Pós Graduação em Agronomia, Escola de Agronomia,
Universidade Federal de Goiás, Goiânia, GO, Brazil.
2
Empresa Brasileira de Pesquisa Agropecuária,
Centro Nacional de Tecnologia da Informação Agropecuária, Campinas, SP, Brazil.
3
Faculdade de Meteorologia, Universidade Federal de Pelotas, Pelotas, RS, Brazil.
4
Programa de Pós Graduação em Meteorologia, Universidade Federal de Pelotas,
Pelotas, RS, Brazil.
6
Empresa Brasileira de Pesquisa Agropecuária,
Centro Nacional de Pesquisa em Arroz e Feijão, Goiânia, GO, Brazil.
Received: July 10, 2017 – Accepted: October 3, 2017.
Abstract
The objective of this study was to evaluate the use of estimated global solar radiation data in the simulations of potential yield of irrigated rice. Global solar radiation was estimated by four empirical models, based on air temperature, and a meteorological satellite derivated. The empirical models were calibrated and validated for 10 sites, representative of the six rice regions of the State of Rio Grande do Sul - Brazil. To evaluate the impact of the radiation estimates on irrigated rice yield simulations, the CERES-Rice model, calibrated for four cultivars, was used. The estimates of global solar radi-ation of the empirical models based on the air temperature showed deviradi-ations, from the observed values, of 20 to 30% and the estimated by satellite deviations of more than 30%. The global solar radiation data estimated by the Hargreaves and Samani, Donatelli and Campbell and derived satellite (PowerNasa) type air temperature-based empirical models can be used as input data in simulation models of crop growth, development and productivity of irrigated rice.
Keywords:empirical models, estimated radiation,Oryza sativa, CERES-Rice.
Parametrização de Modelos e Uso de Dados Estimados de Radiação Solar
Global na Simulação de Produtividade do Arroz Irrigado
Resumo
O objetivo deste estudo foi avaliar a utilização de dados estimados de radiação solar global nas simulações de produtividade potencial de arroz irrigado. A radiação solar global foi estimada por quatro modelos empíricos, baseados na temperatura do ar, e um derivado de satélite meteorológico. Os modelos empíricos foram calibrados e validados para 10 locais, representativos das seis regiões orizícolas do Estado do Rio Grande do Sul - Brasil. Para avaliação dos impactos das estimativas da radiação nas simulações de produtividade do arroz irrigado foi utilizado o modelo CERES-Rice, calibrado para quatro cultivares. As estimativas de radiação solar global dos modelos empíricos baseados na temperatura do ar apresentaram desvios, em relação aos valores observados, de 20 a 30% e as estimados por satélite desvios superiores a 30%. Os dados de radiação solar global estimados pelos modelos empíricos baseados na temperatura do ar do tipo Hargreaves and Samani, Donatelli and Campbell e derivado de satélite (PowerNasa) podem ser utilizados como dado de entrada em modelos de simulação do crescimento, desenvolvimento e produtividade da cultura do arroz irrigado.
Palavras-chave:modelos empíricos, radiação estimada,Oryza sativa,CERES-Rice. Artigo
1. Introduction
Rio Grande do Sul (RS) is the Brazilian state which has the largest production of irrigated rice (Oryza sativa),
and it responds for 69,83% of the total production in Brazil within the crop 2015-2016 (CONAB - Compania Nacional de Abastecimento, 2016). In this crop, the production of ir-rigated rice in the state of RS exceeded 7 million of metric tons, with average yield of approximately 7 Mg ha-1
(Brese-ghello and Neves, 2016). The production of irrigated rice in RS is divided into 6 rice paddy mesoregions, named Zona Sul; Campanha; Fronteira Oeste; Depressão Central; Pla-nície Costeira Interna and PlaPla-nície Costeira Externa. The average yield for the 2015-2016 crop of these regions was 7.8; 6.9; 7.0; 6.3; 7.7 and 6.2 Mg ha-1, respectively (IRGA
-Instituto Rio Grandense do Arroz, 2016).
Simulation models of development, growth and crop yields, known as crop models, are tools that allow the anal-ysis of the climate variability effects on yield oscillation and explore options for managing or minimizing these vari-ations. Among the crop models for irrigated rice, CERES-Rice (Jones et al., 2003) and ORYZA (Bouman et al.,
2001) stand out. They allow the assessment of cultural yield under different management conditions and climate. How-ever, one of the the main limitations for crop models appli-cation is the lack of climate data (Heinemannet al., 2012).
Among climate data, it is possible to highlight global solar radiation (GSR), which directly impacts the biophysical processes of photosynthesis and evapotranspiration. There-fore, GSR is an important climate variable for several agroecological studies (Taoet al., 2013; Liet al., 2014).
Normally, the series of daily historical climate data show periods with no record of GSR, either by failure or lack of sensors. That results in the necessity of estimating this variable. To fill this gap, several empirical models based on air temperature were developed to estimate the GSR (Salima and Chavula, 2012; Silvaet al., 2012;
Jers-zurki and Souza, 2013), given that air temperature is more commonly recorded and generally can be spatialized with
higher accuracy. Alternatively, the GSR can be estimated by meteorological satellite sensors, which regularly cover the entire earth (Ceballoset al., 2004; Pintoet al., 2010,
Van Wartet al., 2013). However, for the correct use of
em-pirical estimate models of GSR based on air temperature, it is necessary to calibrate it locally, due to the presence of terms, which are implicitly through coefficients. They rep-resent the local variability of the variables responsible for changes in atmospheric transmissibility patterns, such as relative humidity and the different systems associated with the occurrence of cloudiness.
Considering the importance that irrigated rice has on the economy of RS, it is vital to apply tools, like crop simu-lation models, to support public and private sector deci-sion-making. Thus, the objective of this study is to verify the viability and impacts arising from the use of global radi-ation data series estimated through empirical models (based on air temperature and derived from satellite) in pre-diction of irrigated rice crop yield using the model CERES-Rice.
2. Materials and Methods
In this study, the GSR estimated was carried out throughout 5 rice mesoregions from the state of Rio Grande do Sul (Table 1). For that, ten municipalities were consid-ered, two for each region, depending on the availability of GSR data.
The air temperature models used in this study for esti-mating GSR were: Bristow and Campbell (1984) - BC (Eq. (1)); Donatelli and Campbell (1998) - CD (Eq. (2)); the Hargreaves and Samani equation (1985) - HG, presented by Huntet al.(1998) - HG1 (Eq. (3)), and even a variation of
HG described in Chenet al.(2004) - HG2 (Eq. (4)).
The equations of these models are presented below:
GSR b T
T R
BC
i c
avg a
= - æ
-è ç ç
ö
ø ÷ ÷ é
ë ê ê
ù
û ú ú 075 1. exp D
D (1)
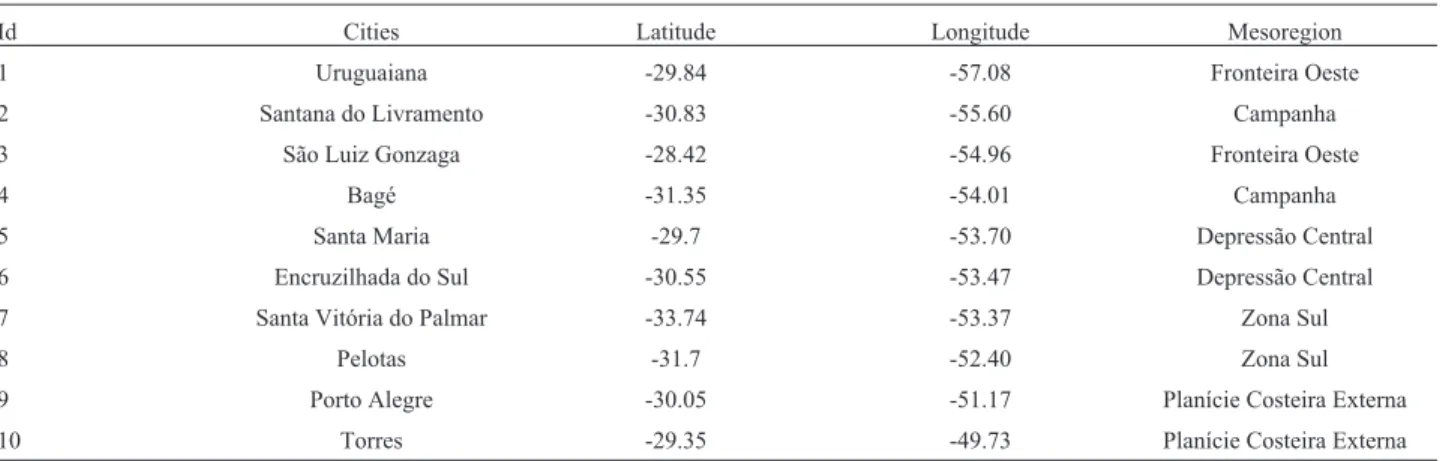
Table 1- Location of the municipalities where calibrations were carried out of the empirical models of estimating global solar radiation.
Id Cities Latitude Longitude Mesoregion
1 Uruguaiana -29.84 -57.08 Fronteira Oeste
2 Santana do Livramento -30.83 -55.60 Campanha
3 São Luiz Gonzaga -28.42 -54.96 Fronteira Oeste
4 Bagé -31.35 -54.01 Campanha
5 Santa Maria -29.7 -53.70 Depressão Central
6 Encruzilhada do Sul -30.55 -53.47 Depressão Central
7 Santa Vitória do Palmar -33.74 -53.37 Zona Sul
8 Pelotas -31.7 -52.40 Zona Sul
9 Porto Alegre -30.05 -51.17 Planície Costeira Externa
(
)
(
)
(
)
(
)
(
)
[
]
GSRCD =0 75 1. -exp -b 0 017. exp exp -0 053. DTavg DT f Ti3 1 min Ra (2)
GSRHG1 =bRa Tmax -Tmin +c (3)
(
)
GSRHG2 = b Tmax-Tmin +c Ra (4)
In the Eqs. (1) to (4), the variables are:Ra= average
daily solar radiation incident at the top of the atmosphere (MJ m-2 day-1), which is calculated using astronomical equations based on latitude and on the day of the year; daily temperature rangeDT=Tmax– (Tmin+Tmin+1)/2, hereTmin+1
is the minimum air temperature recorded in the next day; DTavgweekly average temperature, based on the moving
av-erage of the minimum and maximum temperatures (°C). In Eq. (2) the functionsf1(Tmin) andf2(i) are given by:
(
)
f T e
T Tnc 1 min min = æ è ç ç öø÷÷
(5)
( )
( )
f i2 c1 ixc2 ixf c3 2
180 180
= æ ´
è ç ö ø ÷ é ë ê ù û
ú + æèç ´ öø
sin p cos p ÷ (6)
In Eq. (5), Tnc is the factor of summer night tempera-ture to avoid under-estimating solar radiationiis the day of
the year,c1ec2are empirical parameters of the models. In
Fig. (6),f3is calculated as follows:
( )
f c3 2 c3 c3
2
1 19 383
= - . + . (7)
( )
c3 =c2-integer c2 (8)
In the calibration process, b and c are empirical pa-rameters of BC and CD models (Eqs. (1) and (2)) and they were estimated by ordinary least squares. Also, these pa-rameters (b and c) for HG1 and HG2 (Eqs. (3) and (4)) were estimated using an iterative process using the Gauss-Newton algorithm (Heinemannet al., 2012). For this, we
used daily GSR’s automatic stations observed data from the National Institute of Meteorology (INMET), except for the municipality of Pelotas, whose automatic station belongs to Embrapa Clima Temperado. In the calibration process, it was used even years series of the meteorological data from 2008 to 2014. Also, to evaluate the models it was used odd years series from 2008 to 2014. The Tnc,c1andc2(Eqs. (5)
and (6)) were adjusted by ordinary least squares, as de-scribed by Bellocchi et al. (2003) and Donatelli et al.
(2003).
The estimated GSR satellite-derived data were ob-tained from the Project POWER/NASA (2015) (Prediction of Worldwide Energy Resource, named in this study as PN). These data have not been locally calibrated, as occurs with the empirical models based on air temperature (Eqs. (1) to (4)) described above. PN data have regular cov-erage around the globe, with a spatial resolution of 1°. The detailed methodology description for the satellite-derived GSR estimation is presented in Stackhouse Jr.et al.(2015)
and these data have already been used in another studies in the environmental modeling (Van Wartet al., 2013, 2015;
Espeet al., 2016; Tesfayeet al., 2017).
To assess the impact of using GSR estimated data in the irrigated rice yield simulations, we used the crop model simulation (CMS) driven process CERES-Rice (Jones et al., 2003). The model simulates rice phenology, leaf area,
development, biomass production, yield, and nitrogen ac-cumulation in the aerial part, in response to climatic vari-ables (precipitation, air temperature and solar radiation), management (population density, sowing date, application of nitrogen) and Genetics (characteristics of the cultivar). This model was used to simulate the cultivars BRS Atalanta, BRS 7 Taim, BR/IRGA 410 and BRS Querência, potential yield (which considers only the effect of air tem-perature, global solar radiation and cultivar characteristic) once the rice cultivation in the State of Rio Grande do Sul is done under flood irrigation and also to prevent bias in yield due to nitrogen deficiency, diseases, and pests.
The CERES-Rice model was previously calibrated on the experimental data basis from the experimental Embrapa Clima Temperado’s station, Pelotas, RS. These cultivars present distinctive features about biological cycle, being the BRS Atalanta classified as very short cycle. It takes ap-proximately 100 days from emergency to full grain matura-tion. The cultivar BRS Querência is consider as short cycle (110 days for full maturation) being characterized by its high production potential and grain quality. On the other hand, BRS 7 Taim and BR/IRGA 410 cultivars are classi-fied as medium cycle, with a biological cycle of 121 to 131 days to complete grain maturation (SOSBAI, 2012). In the present work, we have considered four simulations for the sowing dates (September 15, October 15, November 15 and December 15) consistent with the sowing calendar used in Rio Grande do Sul. The GSR estimated data impact in sim-ulations of irrigated rice potential productivity was evalu-ated through comparisons between statistical indexes obtained from simulations performed with the GSR ob-served (Yobs) and estimated (Yest) data.
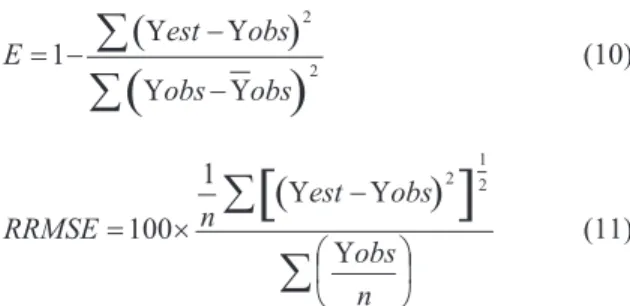
The efficiency of the models of GSR estimates was quantified through the following statistical indexes: a)
RMSE(root mean square error - Eq. (9)), b) andE
(effi-ciency index of Nash and Sutcliffe - Eq. (10)), c)RRMSE
(relative root mean square error - Eq. (11)) and d) coeffi-cient of determination (R2) that is obtained from linear
re-gression between estimated and observed GSR values. To analyze this efficiency, we have considered the estimated and observed data grouped by mesoregions (Table 1).
(
)
[
]
RMSE
n est obs
=1
å
- 21 2
(
)
(
)
E est obs
obs obs
= -
-å
å
1
2
2
U U
U U
(10)
(
)
[
]
RRMSE n
est obs
obs n
= ´
-æ è
ç ö
ø ÷
å
å
100
1 2 12
U U
U (11)
whereYest are the estimated variables (GSR or potential productivities), andYobsare the observed values,nis the number of observations used, andYobsare the
measure-ment data average.
TheRMSE andRRMSEindexes are precision
mea-sures and values close to zero indicate better model perfor-mance. TheRRMSEallows a qualitative rating, according
with Jamiesonet al.(1991), and the estimates are classified
as “poor” forRRMSE > 30%, “reasonable” for values of RRMSEbetween 20 and 30%, “good” for values between
10 and 20%, and “excellent” for values lower than 10%. The E index is an accuracy measure and ranges from -¥to 1. Values close to 1 indicate the model perfection.
Also, the impact of the GSR estimated data in the sim-ulations of irrigated rice potential yield was determined through the comparisons between the observed (Yobs) and
estimated (Yest) GSR simulations. For this, we used the
empirical cumulative distribution function (ecdf). This function estimates the cumulative distribution underlying to the sample’s points and converges with probability 1 ac-cording to the theorem of Glivenko-Cantelli (Dudley, 1969). The estimated ecdf by different models of GSR’s es-timation were tested against the observed ecdf considering the maximum distance between the estimated and observed curves through the Kolmogorov-Smirnov (K-S). To ana-lyze this efficiency the estimated and observed data were considered and grouped by months: September, October, November, and December. To analyze the effect of the GSR estimation on yield a total of 5600 simulated pro-ductivities were considered (7 years x 4 cultivars x 4 sow-ing dates x 5 models of GSR estimations x 10 locations).
3. Results and Discussion
The empirical coefficients referring to the estimates models of GSR based on air temperature (Eqs. (1) to (4)) are described in Table 2. The models of GSR estimates, BC (Eq. (1)) and HG2 (Eq. (4)), presented greater variability to the b (standard deviation of 2.45) and c (standard deviation of 1.39) parameters, respectively. For the BC model in the localities of Santa Vitoria do Palmar and Torres (Id 7 e 10, Table 1), situated on the coast, the parameter b presented higher values (7.74 e 3.55, Table 2), inflating the variability of the parameter. This variance, or standard deviation, indi-cates that the location (the coast proximity) influences the parameter b adjustment for this model. To stress this influ-ence, when the coastal towns (Santa Vitória do Palmar (Id 7) and Torres (Id 10)) are removed from the analyses, the standard deviation reduced to 0.32. So, the value is close to the one obtained by Heinemannet al.(2012) in a study
con-ducted in the State of Goiás - Brazil. For the HG2 model (Eq. (4)), the variability of the parameter c related to the proximity to the coast is not very clear. However, when these coastal sites are removed, the standard deviation is also reduced from 1.39 to 0.86. According with Liuet al.
(2009), the empirical parameters b and c, from the respec-tive models (Eqs. (1) and (4)) present significarespec-tive correla-tion with the relative air humidity and this is a ruling element to the variability that is observed in the coastal lo-calities. These locations are influenced by the interaction of local phenomena, such as the occurrence of sea breeze (Reboitaet al., 2010). The other models of GSR estimates
showed lower variability in the empirical parameters with values of standard deviations three orders of magnitude smaller than the average (Table 2).
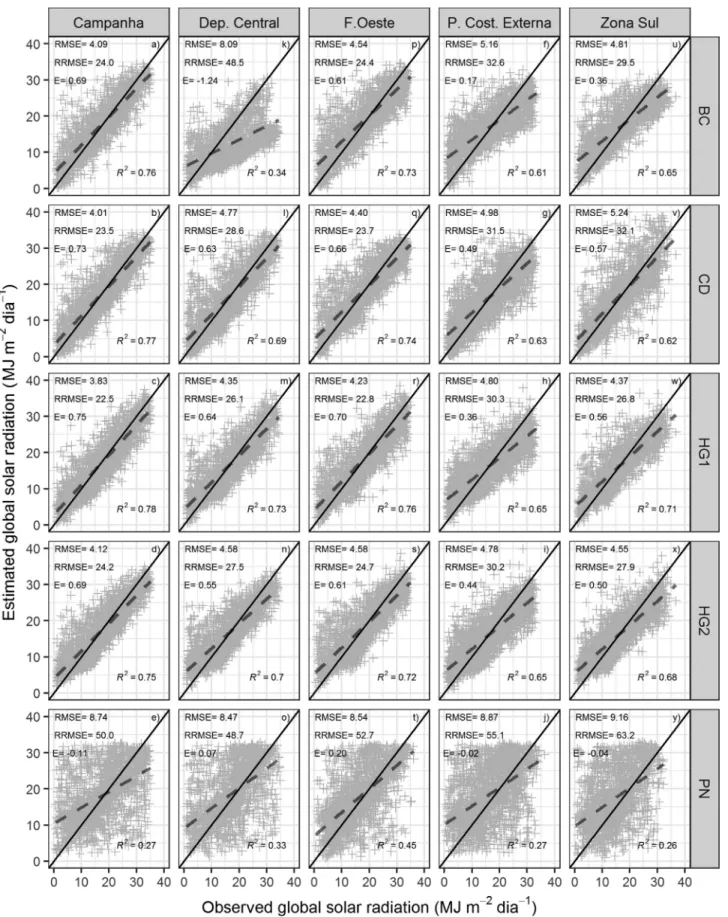
The validation in the models of GSR estimates based on air temperature was made grouping observed and esti-mated data for each rice paddy mesoregion (Table 1) is pre-sented in the Fig. 1. Through this analyses a variability in the estimates related to the observed values of GSR was ob-served. This effect occurs with greater emphasis on meso-regions that have municipalities located in the coastal area (Santa Vitória do Palmar and Torres), which indicates a
Table 2- Coefficients of the empirical models of global solar radiation estimation, estimated for each location, accompanied by the average and standard deviation (sd). See Table 1 to find out the Id corresponding to each city.
Models Coef. Id Cities Average sd
1 2 3 4 5 6 7 8 9 10
Figure 1- Dispersion among the estimated values (y-axis) and observed (x-axis) of global solar radiation. The secondary x-axis (top) represents the
need for calibration of the empirical coefficients for each region.
The models of GSR estimates based on air tempera-ture relate the daily thermal amplitude with the global inci-dent radiation at the surface. These relationships are difficult to predict in places where changes in cloudiness are accentuated, particularly with daily scale fluctuations, and the models tend to present poor performances. On the occurrence of nocturnal cloud cover, there is a tendency of reduction of thermal amplitude as a function of higher min-imum air temperature (Bechiniet al., 2000). If throughout
the day the dissipation of cloudiness is existent, despite the high maximum temperature, the temperature amplitude tends to be lower, but the global solar radiation is high, and as a result, this method shows an underestimate. Thus, the inferior result in the coastal Zona Sul and Planície Costeira Externa (lower R2, Fig. 1) mesoregions can be related to
bigger water vapor influence as well for the occurence of local factors that influence the cloudiness variations in a lo-cal slo-cale which tend to have a sub-daily life cycle.
It is observed that the performance of the empirical models of GSR estimates was similar for all mesoregions. The models then were classified as reasonable (20% <RRMSE< 30%) except the PN (satellite-derived)
that presented poor performance (RRMSE> 30%) for all
mesoregions (Fig. 1 e, j, o, t and y). TheRMSEindex
pre-sented values ranging from 3.83 MJ m-2day-1(Fig. 1, c) to
5.24 MJ m-2day-1(Fig. 1, v). This value range was verified
for all the mesoregions and empirical models based on tem-perature but the BC for the Depressão Central mesoregion which presented 8.09 MJ m-2day-1(Fig. 1, k) and the PN
(satellite-derived) which showed values ranging from 8.47 to 9.16 MJ m-2day-1(Fig. 1 e, j, o, t and y).
In the ensemble analysis of the GSR estimated data in considering only the model as a factor, the best adjustment was obtained by HG1, followed by HG2 and CD. These models presented RMSE values of 4.34 MJ m-2 day-1;
4.53 MJ m-2day-1and 4.70 MJ m-2day-1and
RRMSEvalues
of 25.8; 26.9 e 27.9%, respectively. So, they were also clas-sified as reasonable according to Jamiesonet al.(1991). On
the other hand, the BC model showed a value of 31.27% and was classified as poor.
In the validation carried out by Silva,et al.(2012) for
the State of Minas Gerais - Brazil the models HG1, HG2, CD and BC showed better performance to the one obtained in this study with RMSE values ranging from 3.25 to
3.50 MJ m-2day-1. In Canada, Hunt
et al.(1998) obtained
anRMSEvalue similar to the HG1 model that was achieved
in this study. The models HG1, CD and BC showed a better performance in Goiás, with RRMSE values around 13%
(Heinemannet al., 2012). The variability related to the
per-formance of the GSR estimation models is related to factors as the altitude, longitude, and precipitation, which affect the BC and CD models significantly, while the models HG1 HG2 and are influenced by the thermal amplitude (Liuet
al., 2009). Comparing the studied mesoregions here and the
study by Heinemannet al.(2012) in the State of Goiás, the
performances of these models are affected by patterns of cloudiness and altitude.
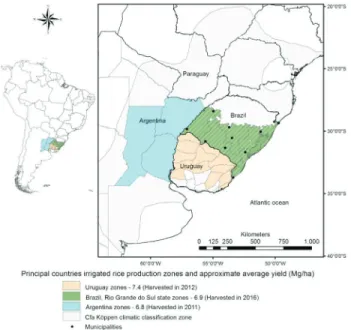
The mentioned studies indicate that the variation on the performance of the GSR estimation models based on the air temperature may be related to the distinct character-istics of sites in the regions. However, the results from GSR models obtained at RS in this study can be extrapolated for the main irrigated rice producing region in South America as showed in Fig. 2.
The three regions, south of Brazil, Uruguay and Ar-gentina, represent 65% of total rice produced in South America (CAS, 2012; CONAB, 2016). This region is char-acterized by having similar climatic and ecological classifi-cation (Pampa biome), and has similar synoptic patterns that influence the weather and climate, such as, the surface temperature of the western subtropical portion of the Atlan-tic Ocean (Doyle e Barros, 2002; Reboita et al., 2010).
Thus, air temperature models calibration is justified, mainly the HG1 model for the Fronteira Oeste and Campa-nha regions (Fig. 1, c and r), being an alternative for GSR estimate in the south of Brazil, Uruguay and Argentina re-gions.
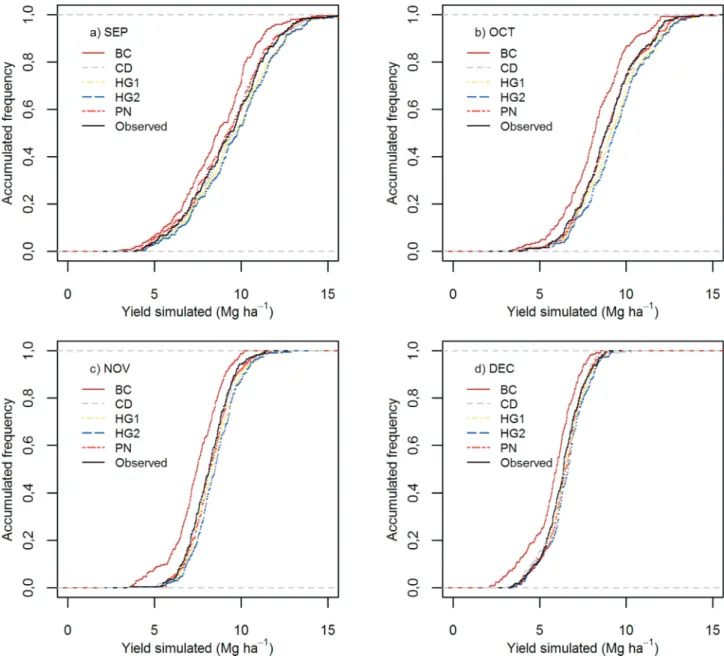
The utilization of estimated GSR data as an input data in the simulation model CERES-Rice showed that it is practicable for the evaluation of the accumulated frequency distribution curves (ecdf) of the simulated and observed productivities (Fig. 3). There is an overlap of the ecdf curves for the simulated potential yield, obtained with the bases CD (grey line, Fig. 3) and PN (red line, Fig. 3), and the obtained using the GSR observed data (black line, Fig. 3), to the times of sowing (Fig. 3-a, b, c and d). The
models HG1 (yellow line, Fig. 3) and HG2 (blue line, Fig. 3) overestimated the values of simulated potential rice productivity, regardless of the time of sowing (Fig. 3-a, b, c, and d). On the other hand, the BC model (brown line, Fig. 3) underestimated the potential yield simulated values (Fig. 3-a, b, c and d).
The medians of the simulated productivities obtained from the accumulated frequency distribution curves are presented in Table 3. The potential yield values simulated by the models HG1, CD and PN are similar in every season of sowing, with a decrease of yield as the sowing is delayed. The K-S test showed equivalence, at 5% significance,
be-Figure 3- Distribution curves of accumulated empirical frequency, from potential yield simulations obtained with the use of GSR data estimated by BC (Brown), CD (grey), DB (green), (yellow) HG1 and HG2 (blue) models; and by satellite-derived data PN (red) for the Sowings made in a) September, b) October, c) November and d) December. The black line refers to the distribution obtained using observed data of GSR.
Table 3- Quantile of 50% and p-valor (in brackets) of the Kolmogorov-Smirnov test between the estimated empirical cumulative distribution curves and the distribution performed with data observed from GSR to the simulation of potential yield (Mg ha-1).
Seeding Observed HG1 HG2 BC CD PN
tween the ecdf (Fig. 3-a, b, c, and d) obtained with the ob-served GSR data and the ones estimated by CD models, PN and HG1 for sowing dates (Table 3).
Although the GSR estimates from the PN basis have shown the worst performance regarding GSR estimations to mesoregions (Fig. 1, high indexes ofRMSEand lowE),
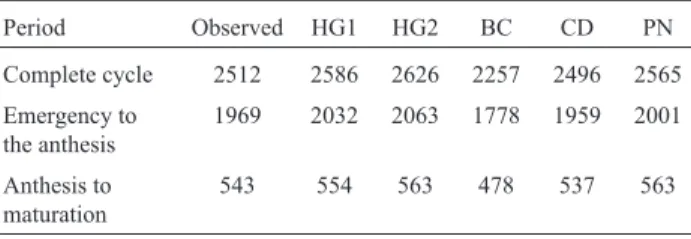
the equivalence in simulated potential yield is justified due to radiation accumulation throughout all rice cycle. Gen-erally, this model does not present the tendency of errors as a function of the values of GSR -i.e., despite variability, the values are centered on line 1:1 (Fig. 1). To evaluate the ac-cumulation of GSR in different simulations, it was found that the GSR buildups during the culture cycle between the simulations performed with the PN and the based observed data are similar (Table 4). Heinemannet al. (2012) also
noted that there was no impact on simulated yield of rice by using data from GSR empirical models, based on estimated air temperature, BC, CD, DB and HG1.
Furthermore, we could notice the variability of simu-lations performed using data observed of GSR (Table 3). This marked variability can be explained both by the pro-ductive potential differences between cultivars, as well as due to occurrence of other abiotic stresses such as the oc-currence of minimum temperatures, in the time and magni-tude sufficient to cause sterility of the spikelet. This effect was observed as a consequence of the time of sowing used (Steinmetzet al., 2013). Thermal stress is captured by the
model of culture derived from dates of sowing, which pro-vide the occurrence of reproductive stages outside the ideal period. This results in yield falls, as can be verified in the ecdf related simulations carried out in December (Fig. 3d). It is observed that this pattern is also captured with the use of estimated radiation data.
4. Conclusions
1. GSR data estimated by empirical models, based on air temperature HG1, HG2 and CD and satellite derived (PowerNasa) can be used as an entry data in models of growing simulation, development and yield in irri-gated rice crop.
2. We suggest that the applicability of global solar radiation estimation models be also evaluated in the producing regions of Argentina and Uruguay, in order to allow a
complete validation for the main rice producing region of Latin America.
Acknowledgments
The authors are grateful to CAPES for financial assis-tance and to Embrapa Clima Temperado, especially to Mr. Silvio Steinemetz, and Embrapa Arroz e Feijão for techni-cal support.
References
BECHINI, L.; DUCCO, G.; DONATELLI, M.; STEIN, A. Mo-delling, interpolation and stochastic simulation in space and time of global solar radiation. Agriculture, Ecosystems and Environment, v. 81, p. 29-42, 2000.
BELLOCCHI, G.; DONATELLI, M.; FILA, G. Evaluation of es-timated radiation data for calculating evapotranspiration and crop biomass.Italian Journal of Agronomy, v. 7, p. 95-102, 2003.
BOUMAN, B.A.M.; KROPFF, M.J.; TUONG T.P.; WOPEREIS, M.C.S.; TEN BERGE, H.F.M.; LAAR, H.H. VAN. ORY-ZA 2000: Modelling lowland rice. 1.ed. Manila: IRRI,
235 p, 2001.
BRESEGHELLO, H.C DE P.; NEVES, P DE C.F.Arroz Irri-gado Subtropical: Desenvolver a cadeia produtiva do arroz irrigado em ambiente subtropical por meio de colaborações com instituições parceiras. 2016. Available at:
https://www.embrapa.br/arroz-e-feijao/inovacao-tecnologi ca/arroz-irrigado-subtropical. Acess: January 23th, 2017.
BRISTOW, K.L.; CAMPBELL, G.S. On the relationship between incoming solar radiation and daily maximum and minimum temperature.Agricultural and Forest Meteorology, v. 31, p. 159-166, 1984.
CHEN, R.; ERSI, K.; YANG, J.; LU, S.; ZHAO, W. Validation of five global radiation models with measured daily data in China. Energy Conversion and Management, v. 45, p. 1759-1769, 2004.
CEBALLOS, J.C.; BOTTINO, M.J.; SOUZA, J.M. A simplified physical model for assessing solar radiation over Brazil us-ing GOES 8 visible imagery.Journal of Geophysical Re-search, v. 109, 2004.
CONAB- Companhia Nacional de Abastecimento.
Acompa-nhamento safra brasileira de grãos, v. 3 - Safra 2015/16, n. 12 - Décimo Segundo Levantamento, set. 2016.
CAS -Conselho Agropecuário do Sul. El mercado del arroz en los países del CAS. 2012. Available at: http://www.agroindustria.gob.ar. Acess in: 10thJune, 2017.
DONATELLI, M.; CAMPBELL, G.S. A simple model to esti-mate global solar radiation. In: Congress of the European Society for Agronomy, 5., Nitra, Slovak Republic, 1998.
Anais.
DONATELLI, M.; BELLOCHI, G.; FONTANA, F. RadEst 3: a software to estimate daily radiation data from commonly available meteorological variables. European Journal of Agronomy, v. 18, p. 363-367, 2003.
DOYLE, M.E.; BARROS, V.R. Midsummer Low-Level Circula-tion and PrecipitaCircula-tion in Subtropical South America and Re-lated Sea Surface Temperature Anomalies in the South At-lantic.Journal of Climate, v. 15, p. 3394-3410, 2002.
Table 4- GSR accumulation (MJ m-2) during the complete cycle of crop
and periods between the emergency to the anthesis and physiological mat-uration, observed when simulating potential yield. They were performed with different data base of GSR.
Period Observed HG1 HG2 BC CD PN
Complete cycle 2512 2586 2626 2257 2496 2565 Emergency to
the anthesis
1969 2032 2063 1778 1959 2001
Anthesis to maturation
DUDLEY, R.M. The speed of mean Glivenko-Cantelli conver-gence.The Annals of Mathematical Statistics, v. 40, n. 1, p. 40-50, 1969.
ESPE, M.B.; CASSMAN, K.G.; YANG, H.; GUILPART, N.; GRASSINI, P.; VAN WART, J.; ANDERS, M.; BEI-GHLEY, D.; HARREL, D.; LINSCOMBE, S.; MCKEN-ZIE, K.; MUTTERS, R.; WILSON, L.T.; LINQUIST, B.A. Yield gap analysis of US rice production systems show op-portunities for improvement.Field Crops Research, v. 196, p. 276-283, 2016.
HARGREAVES, G.H.; SAMANI, Z.A. Reference crop evapo-transpiration from temperature. Applied Engineering in Agriculture, v. 1, p. 96-99, 1985.
HEINEMANN, A.B.; VAN OORT. P.A.J.; FERNANDES, D.S.; MAIA, A.H.N. Sensitivity of APSIM/ORYZ A model due to estimation errors in solar radiation.Bragantia, v. 71, n. 4,
p. 572-582, 2012.
HUNT, L.A.; KUCHAR, L.; SWANTON, C.J. Estimation of so-lar radiation for use in crop modelling.Agricultural and Forest Meteorology, v. 91, p. 293-300, 1998.
IRGA - Instituto Rio Grandense do Arroz.Dados de safra. Porto
Alegre, 2016. Available at:
http://www.irga.rs.gov.br/conteudo/4215/safras. Access in: November 10th, 2016.
JAMIESON, P.D.; PORTER, J.R.; WILSON, D.R. A test of the computer simulation model ARC-WHEAT1 on wheat crops grown in New Zealand. Field Crops Research, v. 27, p. 337-350, 1991.
JERSZURKI, D.; SOUZA, J.L.M. Parametrização das equações de Hargreaves and Samani e Angstron-Prescott para estimativa da radiação solar na região de Telêmaco Borba, Estado do Paraná.Ciência Rural, v. 43, n. 3, p. 383-389, 2013.
JONES, J.W.; HOOGNBOOM, G.; PORTER, C.H.; BOOTE, K.J.; BATCHELOR, W.D.; HUNT, L.A.; WILKNS, P.W.; SINGH, U.; GIJSMAN, A.J.; RITCHIE, J.T. The DSSAT cropping system model.European Journal of Agronomy, v. 18, n. 3-4, p. 235-265, 2003.
LI, H.; CAO, F.; WANG, X.; MA, W. A Temperature-Based Model for Estimating Monthly Average Daily Global Solar Radiation in China.The Scientific World Journal. 2014.
LIU, X.; MEI, X.; LI, Y.; WANG, Q.; JENSEN, J.R.; ZHANG, Y.; PORTER, J.R. Evaluation of temperature-based global solar radiation models in China.Agricultural and Forest Meteorology, v. 149, p. 1433-1446, 2009.
PINTO, L.I.C.; COSTA, M.H.; DINIZ, L.M.F.; SEDYIAMA, G.C.; PRUSKI, F.F. Comparação de produtos de radiação solar incidente à superfície para a América do Sul.Revista Brasileira de Meteorologia, v. 25, n. 4, p. 469-478, 2010. POWER/NASA -Prediction of Worldwide Energy Resource,
Available at:
www.power.larc.nasa.gov/com-mon/php/POWER_AboutAgroclimatology.php. Access in: 23thJuly, 2015.
REBOITA, M.S.; GAN, M.A.; DA ROCHA, R.P.; AMBRIZZI, T. Regimes de Precipitação na América do Sul: uma revisão bibliográfica. Revista Brasileira de Meteorologia, v. 25,
n. 2, p. 185-204, 2010.
SALIMA, G.; CHAVULA, G.M.S. Determining Angstron Con-stants for Estimating Solar Radiation in Malawi. Interna-tional Journal of Geosciences, v. 3, p. 391-397, 2012. SILVA, C.R.; SILVA, V.J. JÚNIOR, J.A.; CARVALHO, H.P.
Radiação solar estimada com base na temperatura do ar para três regiões de Minas Gerais,Revista Brasileira de Enge-nharia Agrícola e Ambiental, v. 16, n. 3, p. 281-288, 2012. SOSBAI - Sociedade Sul-Brasileira de Arroz Irrigado. Arroz
irrigado: recomendações técnicas da pesquisa para o Sul do Brasil. Reunião Técnica da Cultura do Arroz Irrigado, 29. Itajaí, 179 p., 2012.
STACKHOUSE JR, P.W.; WESTBERG, D.; HOELL, J.M.; CHANDLER, W.S.; ZHANG, T. Prediction of Worldwide Energy Resource (POWER).Agroclimatology Methodol-ogy. 2015. Available at: https://power.larc.nasa.gov/docu-ments/Agroclimatology_Methodology.pdf.
STEINMETZ, S.; DEIBLER, A.N.; DA SILVA, J.B. Estimativa da produtividade de arroz irrigado em função da radiação so-lar global e da temperatura mínima do ar.Ciência Rural, v. 43, p. 206-211, 2013.
TAO, F.; ZHANG, Z.; SHI, W.; IU, Y.; XIAO, D.; ZHANG, S.; ZHU, Z.; WANG, M.; LIU, F. Single rice growth period was prolonged by cultivars shifts, but yield was damaged by cli-mate change during1981-2009 in China, and late rice was just opposite.Global Change Biology, v. 19, p. 3200-3209, 2013.
TESFAYE, K.; ZAIDI, P.H.; GBEGBELEGBE, S.; BOEBER, C.; RAHUT, D.B.; GETANEH, F.; SEETHARAM, K.; ERENSTEIN, O.; STIRLING, C. Climate change impacts and potential benefits of heat-tolerant maize in South Asia.
Theoretical Applied Climatology, v. 130, p. 959-970, 2017.
VAN WART, J.; GRASSINI, P.; TANG, H.; CLAESSENS, L.; JARVIS, A.; CASSMANM K.G. Creating long-term weather data from thin air for crop simulation modeling. Ag-ricultural and Forest Meteorology, v. 209-210, p. 49-58,
2015.
VAN WART, J.; KERSEBAUM, K.C.; PENG, S.; MILNER, M.; CASSMANM K.G. Estimating crop yield potential at re-gional to national scales. Field Crops Research, v. 143,
p. 34-43, 2013.