Ar
ti
go
*e-mail: [email protected]
DISCRIMINATION OF NATIVE WOOD CHARCOAL BY INFRARED SPECTROSCOPY
Fabrice Davrieux e Patrick Louis Albert Rousset
CIRAD-Forêt, 73 rue J.F. Breton, Maison de la Technologie, BP 5035, 34032 Montpellier Cedex 1, France Tereza Cristina Monteiro Pastore*, Lucélia Alves de Macedo e Waldir Ferreira Quirino
Laboratório de Produtos Florestais, Serviço Florestal Brasileiro, SCEN Trecho 2, 70818-900 Brasília - DF, Brasil
Recebido em 24/8/09; aceito em 7/1/10; publicado na web em 23/4/10
Brazil is one of the largest producers and consumers of charcoal in the world. About 50% of its charcoal comes from native forests, with a large part coming from unsustainable operations. The anatomic identiication of charcoal is subjective; an instrumental technique would facilitate the monitoring of forests. This study aimed to verify the feasibility of using medium and near infrared relectance spectroscopy to discriminate native (ipê) from plantation charcoals (eucalyptus). Principal Components Analysis, followed by Discriminant Factorial Analysis formed two different groups indicated by Mahalanobis distances of 40.6 and 80.3 for near and mid infrared, respectively. Validation of the model showed 100% eficacy.
Keywords: NIRS; MIRS; charcoal.
INTRODUCTION
In 2008, Brazil consumed more than 33 million cubical meters of charcoal,1 making it one of the biggest consumers as well as producers of the fuel in the world.2 According to the Associação Mineira de Sil-vicultura - AMS publication,1 47.5% of this charcoal is obtained from native forests. The steel industry is responsible for most of its consump-tion, particularly within the state of Minas Gerais and the region of Carajás. In 2007 the two areas consumed 59% and 28%, respectively of the total charcoal consumption of Brazil.3 A study by the Brazilian Environment and Natural Resources Institute – IBAMA,4 revealed that in Carajás, between 2000 and 2004, approximately 7.4 million cubic meters of charcoal was consumed in a non sustainable way.
Brazilian charcoal from native forests that is legal in origin can be produced from: the residues of sawdust, activities derived from the management of sustainable forests or from authorized deforestation. However, a great deal of charcoal still comes from unsustainable forest operations.
To discriminate between native charcoal and charcoal from eu-calyptus is not an easy task. The current identiication of charcoal is based on its anatomical characteristics and therefore demands specia-lists in wood anatomy, who are becoming increasingly rare. Recently, studies involving antracology have been undertaken to identify the origin of charcoal.5 In such studies the botanical determination of charcoal is based on the anatomical structure of wood, using reference collections of wood cuttings and of carbonized wood. The use of techniques involving instruments that determine fast and precisely the origin of vegetal charcoals would therefore aid and facilitate the work of those involved in the control and inspection of the forests.
Near infra-red spectroscopy (NIRS) is one technique that provides fast results with little preparation of sample materials. There have been many studies in the determination of the properties of woods using this method due to the polymer composites that make up wood being very good absorbers of infrared light.6 For spectra obtained with near infrared radiation for different types of wood the assignments of bands were rare due to the complexity in interpreting combinations of vibrations and the overlapping of harmonics in the spectra, coherent with the chemical complexity of materials.7 In this study the author
provides an ample revision of work produced during the 1990s and early 2000 of the uses of NIRS for studies undertaken using wood and paper materials.
NIRS has a number of uses in analyzing wood materials, such as: estimating the length of tracheidsduring the examination of the ibers quality,8,9 to verify the characteristics of wood treated thermally,10 to monitor wood structures that are currently in use,6 to estimate the chemical composition of Pinus taeda L.,11 of Pinus pinaster Aiton12 and of Eucalyptus camaldulensis.13 Also the method is applied in the detection inorganic preservatives such as CCA – copper, chromium and arsenic, ACZA – arsenic, copper, zinc in ammonia solution,14 boron15 and copper salts.16 Other applications relate to the estimation of mechanical properties of wood logs and wood composites.9,17,18
The majority of publications concerned with performing NIRS on wood aim to reduce the time of obtaining quantitative results, where spectral data are always associated with multivaried analysis (MVA) techniques. However, less common are studies involving the use of NIRS in discriminating types of wood.19-22 Studies performed with vegetal charcoal are much more scarce e.g. Labbé et al.23 who demonstrated the viability of using relectance spectroscopy in the medium infrared region for the classiication of vegetal charcoal of four species of woods found in forests of temperate climates: Acer saccharum, Acer rubrum, Acer saccharinum and Quercus Alba, which are all used in industry during the iltration and maturity of the production of whiskey. Reeves et al.24 have investigated the effect of charring on near infrared spectra of 4 materials: cellulose, lignin, pine bark and pine wood over various time periods (1 to 168 h) and at various temperatures (200 to 450 �C). It is shown that there is suf- to 450 �C). It is shown that there is suf-). It is shown that there is suf-icient commonality in the changes to develop calibrations without the need for unique calibrations for each speciic set of charring conditions (i.e. material, temperature and time of heating).
The objective of the present study is to verify the viability of the use of relective spectroscopy in the medium infrared region – MIR and in the near infrared region – NIR in the discrimination of different types of vegetal charcoals derived from ipê (Tabebuia serratifolia) and eucalyptus (Eucalyptus grandis) woods whose origin is from native and plantation forests, respectively.
EXPERIMENTAL
Species of wood from the Amazon region, ipê (Tabebuia serrati-folia (Vahl) Nichols) and a derived species from a forest plantation, eucalyptus(Eucalyptus grandis Hill ex Maiden) were obtained. The eucalyptus was 6 years of age and was collected in the Federal Dis-trict of Brazil. 50 samples of each species of 2x2x2 cm, without any peeling and free from defects were dried outdoors and were placed in a mufle where they were continuously carbonized for 105 min. The rate of heating was approximately 3.81 ºC/min up to a temperature of 400 �C. Samples of both species of wood had been carbonized at the same time to ensure that differences in the carbonization method could not inluence the characteristics of the produced charcoal.
After cooling, the samples of charcoal were ground and passed through a sieve with 60 meshes and with a spacing of 0.25mm. All samples were placed in sealed lasks to keep them free from moisture. The MIR spectra were obtained from the Bruker Tensor 37 spectrometer which contained a Pike diffuse relector (DRIFT). The powder samples were placed in a metal container and its surface layer was made even with a razor. After 64 scans of each sample, spectral band lines were collected between 400 and 7000 cm-1; with a nominal resolution of 4 cm-1. The spectra were processed using OPUS 6.5 computer software.
The NIR charcoal spectra were collected with a NIRSystem 6500, Foss-Perstorp spectrometer using a method of diffuse relec-tance. After 32 scans of each sample, the spectral data was obtained between 800 and 2500 nm with a resolution of 2 nm. The data was processed with ISI NIRS 2 version 4.11 (InfraSoft International) computer software.
All the spectral data was analyzed with computer software XLSTAT v. 2008 7.01 (Addinsoft, Paris) for the analysis of princi-pal components (ACP), that was undertaken in order to observe the separation or grouping between the species. Next, factorial analysis discrimination (AFD) was applied over the principal components (CP) for two reasons: to separate the groups of individuals and to introduce new individuals to the group that would be the closest to the original sample. The approach calculated the factorial axes in order to maximize inter-group variance and minimize intra-group variance. For the calculation of a function to discriminate, a reversal of the variance-covariance matrix is needed; but in the case of spec-tral data this is impossible. Thus, the solution was to replace AFD in the spectral data by CP from the ACP and assign them non-zero values.27 The choice for the CP to be placed in the AFD was held in accordance with a step by step procedure in order to select the CP to provide the best discriminating power.28 At each step the CP variable that maximized the inter-groups Mahalanobis distance was introduced to the model.
Discriminant analysis provides the mathematical description of the Mahalanobis distance (the distance between statistical samples), which can be described by an ellipse circumscribing the data:
D2 = (X –X
i)’M (X –Xi)
where Dis the distance of the point Xto the centre of the groupXi, X is the multidimensional vector that describes the point x,Xi, is the multidimensional vector that describes the local average of the
group i, (X –Xi)’ is the transposition of the vector (X –Xi) andMis a matrix that determines the distances between the multidimensional space involved.29
RESULTS AND DISCUSSION Analysis in the near infrared
The average NIR spectra of charcoal and wood from ipê ( Tabe-buia serratifolia) and eucalyptus (Eucalyptus grandis), are illustrated in Figures 1 and 1S (supplementary material), respectively, to show the changes caused by the thermal degradation process. In both cases, wood and charcoal, it is observed that the spectra of the two species are very similar to each other. However, note in Figure 1 that the slopes are different, especially in the inal portion of the spectrum of the sample of Tabebuia serratifolia.
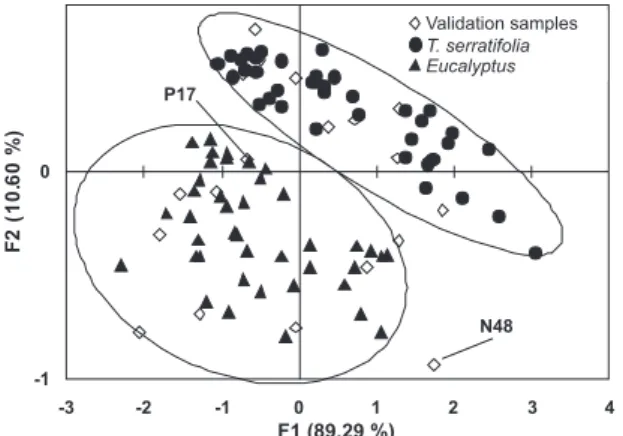
Preliminary analysis of principal components (ACP) was perfor-med on the set of 100 without pre-processing spectra and a separation between the charcoals was found. A formation of two distinct groups was observed with the irst principal component (PC) responsible for 88% of the total variance in the spectrum and the second group responsible for 11%. This distinction in the outcome of ACP showed that charcoals can be classiied based on their chemical composition. Discriminant analysis
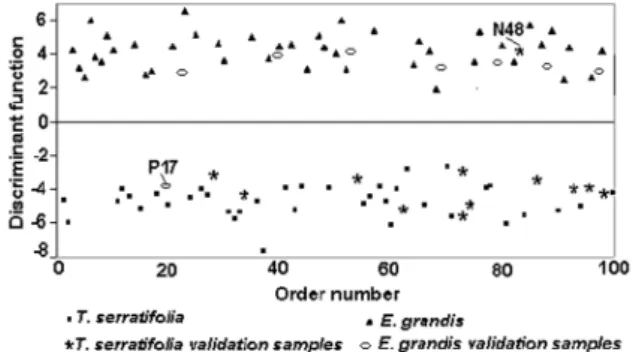
The Mahalanobis distance found between the barycenters of the two groups was 40.6. This high value relects an effective separation between the two types of samples, in accordance with the discriminant function. For the set of calibration samples the rate of well classiied samples was 98.75%. Only one sample of Eucalyptus grandis (p17) was barely classiied as shown in Figure 3. Already the rate of well classiied samples for Tabebuia serratifolia was 100% and for Eu-calyptus grandis was 97.56%.
For the validation of the model, 95% of the samples were clas-siied correctly. In this case, the sample n48 of was badly clasclas-siied (Figure 3). These results are extremely positive; when the atypical sample is omitted, 100% of the samples are validated. As the samples of charcoal were randomly chosen and were made from wood treated at a ixed temperature, the discrimination results obtained are very encouraging.
Analysis in the medium infrared
The FTIR spectra of the original wood and charcoal of Tabebuia serratifolia and of Eucalyptus grandis are illustrated in Figures 4 and 2S (supplementary material), respectively, in order to observe some of the principal changes of the functional groups during carbonization at 400 �C. Spectra of wood are very similar and the assignments of the main bands are well established and described in literature.30 The spectra of the carbon product shows the following main features: (A) Initially, the intensity of the band around 3400 cm-1 due to the vibrational mode of OH stretching bond in the wood is relatively higher than in charcoal, which suggests loss of the constitution water that is impregnated in the cell wall of wood with an increasing of the temperature. (B) The decomposition of lignin is evident by the reduction of C = C vibrational bands of aromatic rings, in ca. 1600,
1513 and 1460 cm-1, as also veriied by Nishimiya et al.31 and by Zuo et al.32 during the carbonization of Cryptomeria japonica (Sugi) and bamboo, respectively. (C) The non conjugated bonds C=O in 1734 cm-1 assigned to hemicelluloses decreased markedly in intensity.30 (D) A formation of an aromatic network with the appearance of three bands at low frequencies 880, 820 and 757 cm-1, from the angular deformation outside the plane of the ring CH groups.32 Nishimiya et al.31 suggested that the aromatic mode due to lignin was changed to a different type of aromatic compound by the carbonization process. These observations are consistent with the literature on the thermal degradation of wood that at 400 oC all polymers components of wood: hemicellulose, cellulose and lignin suffer degradation.23
The average spectra of the charcoal samples of T. serratifolia in the infrared region is very similar to the E. grandis, but certain regions around 880 cm-1 presented different responses, as shown in Figure 5, the resulting spectrum obtained by the subtraction of the native wood charcoal spectrum minus the plantation wood spectrum. The difference can be attributed to the differences between the lignin content of the two woods species. This observation can be conirmed by the fact that: native woods from the tropics, such as ipê have high levels of soluble and insoluble lignins around 34%, according to Santana and Okino33 while the total lignin content found in 7 year old eucalyptus was found to be 23.3%.34
Discriminant analysis
The principal components analysis performed on the medium infrared data shown in Figure 6 (to improve the computation time the region above 4000 cm-1 was removed from the spectra) conirms the separation of samples into two groups according to the species of wood. This observation follows and agrees with previous results as NIR and MIR analyses follow the same principles related to the Figure 2. Distribution of the 80 calibration samples of charcoal from Tabebuia
serratifolia and Eucalyptus grandis as well as the 20 samples for validation in accordance with the irst two principal components
Figure 3. Distribution of the samples according to the discriminant function
Figure 4. Medium infrared spectra of Tabebuia serratifolia wood and charcoal
vibrational properties of the chemical compounds present in charcoal and electromagnetic radiation. Here, it is interesting to note that the results were obtained in the two different spectral regions with two completely different instruments (FTIR and a monochromator) and in their detection (InGaAs and PbS). Therefore the results have different sensibilities and resolutions in their absorbance intensities.
Again, the n48 sample supposedly derived from T. Serratifolia wood is more markedly contained in the Eucalyptus grandis population. This sample is an outlier from the T. Serratifolia samples in the principal plane. A new ACP was carried out with 20 more samples, including the two incorrectly classiied n48 and p17 samples and 18 further samples. For validation, discriminant analysis was performed on the remaining 60 samples, setting the qualitative variable as the species of wood.
The Mahalanobis distance between the two barycenters of the groups of Tabebuia serratifolia and Eucalyptus grandis was 80.3. The analysis of charcoal in the medium infrared has a more clear separation between the samples because the removal of the two outliers is two times higher than in the near infrared. In the calibration of 80 samples, the rate of correct classiication was 100% and the rate of validation 90%.
The samples n48 and p17 were wrongly classiied. These two samples have effectively atypical behavior in the medium and near infrared regions. This inding shows that it is probably an error with the coding of the samples; this is corroborated with the robustness of the model selected.
Figure 7 shows the effective separation between the two types of charcoal for the samples that were used in calibrating and validating the model, according to the discriminant function.
CONCLUSIONS
The analysis of discriminant factors (AFD) helped highlight the link between qualitative features belonging to a group and a set of
quantitative explanatory characteristics. The results obtained from NIR and MIR analyses allowed a discriminant function for two spe-cies of wood used to make charcoal to be obtained. The validation model showed that once the two wrongly classiied samples were removed, one can classify with 100% eficiency of the origin of charcoal from their MIR and NIR spectra; where the differentiation is more pronounced using MIR.
Considering that the samples of charcoal analyzed were made from wood treated a ixed temperature and obtained randomly, the results obtained in discriminating their types are very encouraging. However, what is now necessary is to conirm this study analyzing samples of woods treated at different temperatures of the same species from the same forests: native and plantations.
SUPPLEMENTARY MATERIAL
The supplementary material contains Figures 1S and 4S, freely ac-cessible and available at http://quimicanova.sbq.org.br, in PDF format. ACKNOWLEDGEMENTS
The authors would like to acknowledge the French Ministry of Foreign Affairs (MAE) for inancing the project, the Center for International Cooperation in Agronomic Research and Development (CIRAD) as well as the Laboratory of Forest Products (LPF), of the Brazilian Forest Service, for allowing experiments to be performed on their premises. Thanks also are due to Mr. R. Flowerdew for his helping in translating the paper.
REFERENCES
1. http://www.silviminas.com.br/NumerosSetor/Arquivos/Anuario-AMS2009, accessed April 2010.
2. http://www.sbs.org.br/FatoseNumerosdoBrasilFlorestal.pdf, accessed May 2009.
3. http://www.silviminas.com.br/NumerosSetor/AnuarioAMS2008, accessed April 2010.
4. Instituto Brasileiro do Meio Ambiente e dos Recursos Naturais Renováveis — IBAMA; Diagnóstico do setor siderúrgico nos estados do Pará e do Maranhão, Relatório Técnico, Brasília, 2005.
5. Gonçalves, T. A. P.; Rangel, A.; Scheel-Ybert, R.; II Simpósio Internacional de Savanas Tropicais/IX Simpósio Nacional Cerrado, Brasília, Brasil, 2008.
6. Zanetti, M.; Rials, T. G.; Rammer, D.; Proceedings of the 2005 Weather-ing Structures Congress and the Foresinc EngineerWeather-ing Symposium, New York, USA, 2005.
7. Tusuchikawa, S.; Appl. Spectrosc. Rev. 2007, 42, 43.
8. Schimleck, L. R.; Jones, P. D.; Peter, G. F.;Daniels, R. F.; Clark III, A.; Holzforschung 2004, 58, 375.
9. Jones, P. D.; Schimleck, L. R.; Peter, G. F.; Daniels, R. F.; Clark III, A.; Can. J. For. Res. 2005, 35, 85.
10. Schwanninger, M.; Hinterstoisser, B.; Gierlinger, N.; Wimmer, R.; Hanger, J.; Holz Roh Werkst. 2004, 62, 483.
11. Jones, P. D.; Schimleck, L. R.; Peter, G. F.; Daniels, R. F.; Clark III, A.; Wood Sci. Technol. 2006, 40, 709.
12. Alves, A.; Santos, A.; Perez, D. S.; Rodrigues, J.; Pereira, H.; Simões, R.; Schwanninger, M.; Wood Sci. Technol. 2007, 41, 491.
13. Punsunvon, V.; Terdwongworakul, A.; Thanapase, W.; Tsuchikawa, W.; Proceedings of the 11th International Conference, Chichester, U.K., 2004.
14. So, C-l.; Lebow, S. T.; Groom, L. H.; Rials, T. G.; Wood Fiber Sci. 2004, 36, 329.
15. Taylor, A.; Lloyd, J.; Forest Prod. J. 2007, 57, 116. Figure 6. Separation of the samples according to the irst plane in the ACP
16. Feldhoff, R.; Huth-fehre, T.; Cammann, K.; J. Near Infrared Spectrosc. 1998, 6, A171.
17. Schimleck, L. R.; Jones, P. D.; Clark III, A.; Daniels, R. F.; Peter, G. F.; Forest Prod. J. 2005, 55, 21.
18. Rials, T. G.; Kelley, S. S.; Chi-Leung, S.; Wood Fiber Sci. 2007, 34, 398. 19. Schimleck, L. R.; Michella, A. J.; Vindem, P.; Appita Journal 1996, 49,
319.
20. Nault, J. R.; Manville, J. F.; Wood Fiber Sci. 1992, 24, 424.
21. Tusuchikawa, S.; Inoue, K.; Noma, J.; Hayashi, K.; J. Wood Sci. 2003, 49, 29.
22. Adedipe, O. E.; Dawson-Andoh, B.; Slahor, J.; Osborn, L.; J. Near Infrared Spectrosc. 2008, 16, 49.
23. Labbé, N.; Harper, D.; Rials, T.; J. Agric. Food Chem. 2006, 54, 3492. 24. Reeves, J. B. III; McCarty, G. W.; Rutehrford, D. W.; Wershaw, R. L.; J.
Near Infrared Spectrosc. 2007, 15, 307.
25. Fitzer, E.; Köchling, E. K. H.; Boehm, H. P.; Marsh, H.; Pure Appl. Chem. 1995, 67, 473.
26. Pastor-Villegas, J.; Rodríguez, J. M. M.; Pastor-Valle, J. F.; García, M. G.; J. Anal. Appl. Pyrolysis 2007, 80, 570.
27. Devaux, M. F.; Bertrand, D.; Robert, P.; Qannari, M.; Appl. Spectrosc. 1988, 42, 1015.
28. Downey, G.; Robert, P.; Bertrand, D.; Kelly, P. M.; Appl. Spectrosc. 1990, 44, 150.
29. Mark, H. L.; Tunnell, D.; Anal. Chem. 1985, 57, 1449.
30. Pastore, T. C. M.; Oliveira, C. C. K.; Rubim, J. C.; Santos, K. O.; Quim. Nova 2008, 31, 2071.
31. Nishimiya, K.; Hata, T.; Imamura, Y.; Ishihara, S.; J. Wood Sci. 1998, 44, 1998.
32. Zuo, S.; Gao, S.; Yuan, X.; Xu, B.; J. Forestry Res. 2003, 14, 75. 33. Santana, M. A. E.; Okino, E. Y. A.; Holzforschung 2007, 61, 469. 34. Barbosa, L. C. A.; Maltha, C. R. A.; Silva, V. L.; Colodette, J. L.; Quim.
M
ate
ri
al
S
up
le
m
enta
r
*e-mail: [email protected]
DISCRIMINATION OF NATIVE WOOD CHARCOAL BY INFRARED SPECTROSCOPY
Fabrice Davrieux and Patrick Louis Albert Rousset
CIRAD-Forêt, 73 rue J.F. Breton, Maison de la Technologie, BP 5035, 34032 Montpellier Cedex 1, France Tereza Cristina Monteiro Pastore*, Lucélia Alves de Macedo e Waldir Ferreira Quirino
Laboratório de Produtos Florestais, Serviço Florestal Brasileiro, SCEN Trecho 2, 70818-900 Brasília - DF, Brasil
Figure 1S. Average NIR spectra of Tabebuia serratifolia and Eucalyptus
grandis woods samples