HOW ARE COMPANIES ADDRESSING SUSTAINABILITY?
THE PEDAGOGICAL CASE STUDY OF SOCIEDADE
CENTRAL DE CERVEJAS E BEBIDAS
Sara Nunes Sobral
Project submitted as partial requirement for the conferral of
Master in International Management
Supervisor:
Professor Ana Simaens, Assistant Professor, ISCTE Business School,
Department of Marketing, Operations and Management
September 2019
H
O
W
A
R
E
C
O
M
PA
N
IE
S
A
D
D
R
E
S
S
IN
G
S
U
ST
A
IN
A
B
IL
IT
Y
?
T
H
E
P
E
D
A
G
O
G
IC
A
L
C
A
S
E
S
T
U
D
Y
O
F
S
O
C
IE
D
A
D
E
C
E
N
T
R
A
L
D
E
C
E
R
V
E
JA
S
E
B
E
B
ID
A
S
S
ar
a
N
u
ne
s
So
b
ra
l
I
ABSTRACT
Companies are being called to action by their consumers and even by governments. Both “Sustainability” and “Corporate Social Responsibility”, however, are still very broad concepts, which makes it harder for organizations to successfully implement a business strategy that takes into account and compensates for the impact of their operations in society. This pedagogical case study is focused on Sociedade Central de Cervejas e Bebidas, one of the two leading Portuguese brewers and which is part of the Heineken Group, and how it has developed its own sustainability strategy – more, how has Heineken, as an international group, contributed to this process? Taking this into account, the case study explores strategic management tools for organizations to understand their environment and capabilities and to recognize potential barriers when setting the strategic path. Additionally, it identifies not only why are companies tackling sustainability, but also which challenges do they face when so doing. As such, this case study represents a useful tool to realize the magnitude of strategic management on a real company and provides outlines for consideration when seeking to implement a sustainability strategy.
Keywords: Sustainability, Social Responsibility, International Business, Strategy JEL Classification System:
M14 – Corporate Culture; Diversity; Social Responsibility F23 – Multinational Firms; International Business
II
RESUMO
As empresas estão a ser chamadas à ação. Tanto pelos seus consumidores como também pelos governos. No entanto, tanto “sustentabilidade” como “responsabilidade social corporativa” ainda são dois conceitos bastante vagos, o que dificulta, por parte das empresas, a implementação bem-sucedida de uma estratégia de negócio que tenha em consideração e compense o impacto das suas operações na sociedade. Este caso de estudo foca-se na Sociedade Central de Cervejas e Bebidas, uma das duas cervejeiras Portuguesas líderes de mercado e que é detida pelo Grupo Heineken, e em como esta desenvolveu a sua estratégia de sustentabilidade – mais, como é que a Heineken, enquanto grupo internacional, contribuiu para este processo? Tendo isso em conta, o caso de estudo explora ferramentas de gestão estratégica para as organizações compreenderem o ambiente em que operam e as suas capacidades, bem como reconhecerem possíveis barreiras na definição do percurso estratégico. Além disso, identifica não só o porquê de as empresas estarem a abordar a sustentabilidade, mas também quais os desafios com que se deparam ao fazê-lo. Desta forma, este caso de estudo representa uma ferramenta útil para entender a magnitude da gestão estratégica de uma empresa real e faculta linhas gerais a ter em consideração aquando da implementação de uma estratégia de sustentabilidade.
Palavras-chave: Sustentabilidade, Responsabilidade Social, Gestão Internacional, Estratégia
Sistema de Classificação JEL:
M14 – Corporate Culture; Diversity; Social Responsibility F23 – Multinational Firms; International Business
III
ACKNOWLEDGEMENTS
I would like to firstly thank my family, particularly my parents, for their support and patience during all these months. Your encouragement, even from afar, was important. I also have to thank Professor Ana Simaens, for her guidance and detailed feedback, especially in this last phase.
To Sociedade Central de Cervejas e Bebidas and, in particular Mr. Nuno Pinto de Magalhães and Ms. Sandra Peixoto, a thank you for their availability, for providing all the necessary information to complete this piece and for promptly receiving me.
Finally, to my friends from home and even from work, goes an appreciation message for always hearing and cheering me up, as well as for the insights provided – especially in the final weeks.
IV
TABLE OF CONTENTS
ABSTRACT ... I RESUMO ... II ACKNOWLEDGEMENTS ... III LIST OF FIGURES ... VI LIST OF TABLES ... VII LIST OF CHARTS ... VII LIST OF ABBREVIATIONS ... VII1. Case ... 1
1.1 Problem Identification ... 1
1.2 The Brewing Industry: Analysis ... 2
1.2.1 European Market ... 3
1.2.1.1 Growth: Forecast & Trends ... 3
1.2.1.2 Major Players ... 4
1.2.1.3 Segmentation ... 4
1.2.2 Water Usage & Sustainability Programs ... 5
1.3 The Heineken Company & Sociedade Central de Cervejas e Bebidas ... 6
1.3.1 The Heineken Company ... 6
1.3.2 Sociedade Central de Cervejas e Bebidas... 7
1.3.2.1 History ... 8
1.3.2.2 Vision, Mission, Strategic Objectives and Values ... 9
1.3.2.2.1 Vision ... 9 1.3.2.2.2 Mission ... 9 1.3.2.2.3 Strategic Objectives ... 9 1.3.2.2.4 (Behavioural) Values ... 10 1.3.2.3 Products ... 10 1.3.2.4 Sustainability ... 12
1.3.2.4.1 First Sustainability-related Initiatives ... 12
1.3.2.4.2 Packaging ... 12
1.3.2.4.3 Local Sourcing ... 13
1.3.2.4.4 Responsible Consumption ... 13
1.3.2.4.5 Heineken & the Sustainability Program ... 14
V
1.3.2.5.1 Market Growth & Seasonality ... 16
1.3.2.5.2 Imports & Exports ... 18
1.3.2.5.3 Tax ... 18 1.3.2.5.4 Competition ... 19 1.3.2.5.4.1 Direct Competitors ... 19 1.3.2.5.4.2 Indirect Competitors ... 20 1.4 Problem Review ... 21 2. Pedagogical Note ... 22 2.1 Target Audience ... 22
2.2 Pedagogical Objectives & Learning Outcomes ... 22
3. Literature Review ... 23
3.1 Sustainability ... 23
3.1.1 Definition and Evolution ... 23
3.1.2 Sustainable Development Goals (SDGs) ... 26
3.1.2.1 Before the SDGs ... 26
3.1.2.2 Laying foundation for SDGs ... 26
3.1.2.3 Creation of SDGs ... 27 3.1.2.4 Approach at EU level ... 27 3.1.2.5 Private sector ... 28 3.1.2.5.1 Financial Resources ... 29 3.1.2.5.2 Reporting ... 30 3.1.2.5.3 Performance Trackers ... 31
3.1.3 Sustainability & Corporate Social Responsibility ... 32
3.2 Corporate Social Responsibility ... 33
3.2.1 Definition ... 33
3.2.2 CSR Models ... 34
3.2.2.1 Carroll’s Pyramid of CSR ... 34
3.2.2.2 Wood’s Social Performance Model ... 35
3.3 Strategy ... 36
3.3.1 Strategic Management ... 37
3.3.2 Strategic Analysis Tools ... 37
3.3.2.1 Porter’s Five Forces Model ... 38
VI
3.4 Linking Strategic Management, Sustainability & CSR ... 39
3.4.1 Mergers & Acquisitions ... 40
3.4.1.1 M&A Strategy ... 40
3.4.1.2 Due Diligence ... 40
3.4.1.3 A way to improve sustainability? ... 41
3.5 Case Study Methodology ... 42
3.6 Analysis Tools ... 43
4. Case Resolution ... 44
4.1 Animation Plan ... 44
4.2 Case Questions ... 46
4.3 Case Resolution ... 47
4.4 Slides for Case Resolution ... 56
4.5 Lessons from the Case Study ... 56
5. Endnotes ... 58
6. Bibliography ... 60
7. Appendixes ... 73
Appendix A: Brewing a Better World’s Targets and Progress ... 73
Appendix B: The 8 Millennium Development Goals (MDGs) ... 74
Appendix C: Millennium Development Goals: 2015 Progress Chart ... 75
Appendix D: The Sustainable Development Goals (SDGs) ... 76
Appendix E: Interview Questioner ... 76
Appendix F: Slides for Case Resolution ... 78
LIST OF FIGURES
FIGURE 1:SOCIEDADE CENTRAL DE CERVEJAS E BEBIDAS'BRANDS &PRODUCTS ... 11FIGURE 2:THE THREE PILLARS OF SUSTAINABILITY ... 25
FIGURE 3:INTERLOCKING CIRCLES MODEL USED BY THE IUCN ... 25
FIGURE 4:PYRAMID OF CORPORATE SOCIAL RESPONSIBILITY ... 35
VII
LIST OF TABLES
TABLE 1:POTENTIAL PLANNING FOR CASE RESOLUTION ... 44
TABLE 2:SCC'S PORTER FIVE FORCES MODEL ... 47
TABLE 3:SCC'S SWOTANALYSIS... 51
LIST OF CHARTS
CHART 1:SALES OF LEADING BEER COMPANIES WORLDWIDE IN 2018 ... 2
CHART 2:HEINEKEN'S MAIN FIGURES ... 7
CHART 3:HEINEKEN'S CONSOLIDATED BEER VOLUME, AS A PERCENTAGE OF TOTAL, IN
2018 ... 7 CHART 4:BREWING A BETTER WORLD'S FOCUS AREAS ... 15
CHART 5:REVENUE (IN MILLION EUROS) OF BEER CONSUMED AT AND OUT OF HOME IN
PORTUGAL (2010-2023) ... 17
CHART 6:BEER SALES IN VOLUME (%) IN 2018 ... 18
LIST OF ABBREVIATIONS
AB InBev – Anheuser-Busch InBev ABV – Alcohol by Volume
BITC – Business in the Community
CAGR – Compounded Average Growth Rate CO2 – Carbon Dioxide
EC – European Commission
ESG – Environmental, Social and Governance EU – European Union
FMCG – Fast Moving Consumer Goods
IDMC – Internal Displacement Monitoring Centre
IISD – International Institute for Sustainable Development IUCN – International Union for Conservation of Nature KPI – Key Performance Indicator
LICs – Low-income Countries M&A – Mergers and Acquisitions
MDGs – Millennium Development Goals MICs – Middle-income Countries
VIII MSME – Micro, Small and Medium Enterprises
NGOs – Non-Governmental Organizations
OECD – Organization for Economic Cooperation and Development R&D – Research and Development
SCC – Sociedade Central de Cervejas e Bebidas SDGs – Sustainable Development Goals
SLB – Sport Lisboa e Benfica
SWOT – Strengths, Weaknesses, Opportunities, Threats UN – United Nations
UNDP – United Nations Development Programme UNEP – United Nations Environment Programme USA – United States of America
VAT – Value Added Tax
WBCSD – World Business Council for Sustainable Development WHO – World Health Organization
WTO – World Trade Organization WWF – World Wide Fund
1
1. Case
1.1 Problem Identification
In this era, we speak about climate change almost every day. More and more we are swamped with news about earthquakes, tsunamis, floods, landslides or heat waves (amongst others) happening around the world and at a faster pace than ever before1. Of
course, we are also better connected and receive news almost in real time, but one cannot forget the impact that population growth and economic development have on the planet’s resources. In fact, if we take into account the period from 1980 to 2018, 8 out of the “10 most significant natural disasters worldwide by death toll”2 happened in the 21st century
and the same percentage can be verified if we refer to the “biggest natural disasters worldwide by economic damage”3. According to a report from the Internal Displacement
Monitoring Centre (IDMC, 2017) on the topic, 14 million people are expected to be displaced every year in the next two decades due to floods, earthquakes and storms. Thus, with such alarming statistics, countries and different organizations have been raising awareness for a sustainable development, especially in the last decade. Citizens are now asked to join the movement, by incorporating slight changes in their daily lives which can have a big impact altogether, and companies are invited to modify their business models in order to make them greener and more efficient (International Institute for Sustainable Development). But, as sustainability is not only about climate change and global warming, sustainable development also covers the society’s conditions, i.e. similarly it motivates the creation of wealth (for the different businesses) while also improving the surrounding community’s quality of life. How can companies maintain (or even increase) their profit while creating a material return for their stakeholders?
A survey by the European Commission (Eurobarometer, 2017: 36) unveiled that 90% of its respondents had “taken at least one personal action that helps tackle climate change” and notably 71% attempt to “reduce their waste and regularly separate it for recycling”, while 56% “try to cut down on their consumption of disposable items, such as plastic bags from the supermarket and excessive packaging”. This means that more and more people are aware of the daily choices they make when buying a product, leading to companies to put more effort into communication of their sustainability-related achievements.
Indeed, this pedagogical case study is focused on the sustainability strategy implemented by Sociedade Central de Cervejas e Bebidas, a Portuguese company operating in the brewing industry, and how it was driven by its integration into the Heineken Group, the
2 world’s second largest brewer. This will allow the understanding of internal and external factors that might have influenced the chosen path, especially considering that the production of beer is water-heavy and that its packaging is usually regarded as disposable waste. Additionally, it intends to aid the integration of sustainability into organizations’ business models by exploring the challenges a company faces when turning to a greener operational model.
1.2 The Brewing Industry: Analysis
The brewing industry deals with the production of beer, which is said to be the oldest and one of the world’s most popular alcoholic beverages. It is a major consumer of cereal grain, as malt is the most important ingredient in beer (Edney and Izydorczyk, 2003; Crawshaw, 2009).
The world’s biggest beer market is China, as the beverage represents 75% of the total alcohol consumption in the country, translating into more than 45 billion litres consumed per year – which is the double than the USA and five times bigger than Germany, the European leader – this means that 3 out of 4 imported beers are produced in Europe. Ten years ago, the brewing industry was highly fragmented, however, several acquisitions have occurred, being explained by cost-cutting or gaining market share in emerging markets (e.g. Anheuser-Busch and InBev in 2008 or Heineken and Asia Pacific Breweries in 2012). Nowadays, with an estimated market value of USD 603.1 billion, it is a more concentrated industry worldwide (Chart 1), with five companies controlling more than 60% of the global market (Statista 2019) by volume: AB InBev, Heineken, China Resources, Carlsberg and Molson Coors.
Source: Adapted from Statista (2019)
3
1.2.1 European Market
Europe is the world’s second largest beer producer, being only after China, with one third of the year’s production having been exported to outside EU in 2017 (with the top three importers being the USA, China and Canada)4. Europe is estimated to hold around 80
beer styles and 50 000 brands (Arthur, 2018), producing almost 40 billion litres of beer per year by around 9500 breweries and employing 2.3 million people (The Brewers of Europe, 2018).
1.2.1.1 Growth: Forecast & Trends
The European beer market, which accounted for USD 138.7 billion in 2017, is forecasted to register a CAGR (Compound Annual Growth Rate) of 1.8%, between 2018 and 2025 (Sable and Deshmukh, 2019), backed by:
i) Changes in demand, due to consumers’ shifting towards healthier lifestyles (which is translated into less intake and less sugar);
ii) Higher disposable income, especially in Eastern European countries; and iii) Increased popularity of beer among the younger generation.
Bearing this in mind, and the fact that Europe is mostly comprised of ‘matured beer countries’, it is facing specific tendencies which pose both opportunities and challenges (Mordor Intelligence, 2019):
i) Consumers search for more variation and distinctive aromas, leading to consumers being willing to pay more for better quality, which has also led to the rise of specialty, crafted and imported beers;
ii) There is a growing number of lower and non-alcoholic beer versions, with the market for non-alcoholic and low alcohol beers having doubled between 2000 and 2015 (The Brewers of Europe, 2018) and Carlsberg’s alcohol-free brew volume growing 23% in Western Europe over 2017;
iii) There is a shift from draught to small-pack beer due to the off-trade channel and, due to exports, a higher focus on longer “beer shelf life while maximising the flavour stability” (Boulton, 2015: 59);
iv) Several brands have started using new technology, such as artificial intelligence, to assess different flavours mix (J.P. Morgan, 2018);
v) Tighter regulation and heavy taxation; and
4
1.2.1.2 Major Players
Some of Europe’s leading beer companies are: AB InBev, Heineken Group, Carlsberg Group, Bitburger Brewery, Budweiser Budvar Brewery, Diageo Plc, Erdinger, Oakleaf Brewery and Radeberger. However, it is important to highlight that:
i) AB InBev is the world’s largest brewer estimated to control around 30% of the whole market (after the acquisition of SABMiller in 2016)5, with a portfolio of
both international and local brands that include over 200 trademarks (e.g. Budweiser, Corona, Stella Artois or Leffe); and
ii) Heineken is the world’s second largest brewer, with a clear focus on the premium category (Euromonitor International, 2018), and operates more than 300 brands (e.g. Amstel, Desperados, Strongbow) in over 190 countries.
1.2.1.3 Segmentation
There are five types of segmentation on the Europe beer market: i) Type – split into lager, ale, stout & porter, malt and others;
The lager segment detained the main share in 2017, contributing more than two-fifths of the market. However, the malt segment is estimated to manifest the fastest CAGR of 2.0% during the forecast period of 2018-2025 (Sable and Deshmukh, 2019).
ii) Category – trifurcated into popular-priced, premium and super premium;
The premium category accounted for more than half share of the European market in 2018 and is predicted to retain its dominance throughout 2018-2025 (Sable and Deshmukh, 2019), as mentioned before, which turns it into a key category for competition between traditional brands.
iii) Packaging – segmented into glass, PET bottle, metal can and others;
Glass contributed more than two-thirds of the market and is expected to register a CAGR of 1.5% (2018-2025), as it allows cool temperatures for longer time. Additionally, it is considered to be also more visually appealing to the consumers. iv) Production – divided into macro-brewery, micro-brewery, craft brewery and
others; and
The macro-brewery segment still dominated the market in 2017, nonetheless, micro-brewery is estimated to grow fastest at a CAGR of 1.9% during the 2018-2025 period (Sable and Deshmukh, 2019).
5 v) Geography – at country level, Germany retained one-sixth of the market share
and is anticipated to maintain its position, on the back of local brewing, followed by the United Kingdom (which should register high growth until 2025), Russia and France.
1.2.2 Water Usage & Sustainability Programs
The brewing industry is one of the most water-intensive ones, as it utilizes water in almost every step of the brewing process (e.g. it corresponds to c.a. 93% of a 5% ABV beer6).Given the move towards sustainable actions, minimizing water usage is one of the key issues in the sector (Boulton, 2015), thus several brewing companies have already implemented sustainability programs.
In 2018, Heineken opened a new brewery in Mexico, which has been constructed bearing in mind circular economy principles and, thus, with a clear focus on renewable energy and on efficient water usage (MarketWatch, 2019).
Carlsberg has already put into effect ‘Together Towards Zero’, which lays the following targets in four main areas (Arthur, 2018):
i) “Zero carbon footprint – to eliminate carbon emission at breweries by 2030 and to use 100% renewable electricity by 2022;
ii) Zero waste water – including cutting water usage in breweries by half by 2030; iii) Zero irresponsible drinking – 100% distribution of alcohol-free brews by 2022,
as well as nutritional and ingredient information; iv) Zero accidents culture in the company”.
Molson Coors has setup ‘sustainability and responsibility targets’ in 2017, such as improved water efficiency (to reach a lower water-to-beer ratio), reduce carbon emissions by half, achieve zero waste to landfill and provide low and alcohol-free options in all its markets. This has been motivated by company’s internal research, which found that its consumers “increasingly care that companies act in a socially responsible way, whether it be through sustainability actions, community involvement or desirable employment practices” (Arthur, 2018). The biggest challenge that Molson Coors found on the first year of tracking progress was the creation of a ‘culture of change’ throughout the company, even though wide-ranging range targets were created at group level, allowing then the brands to focus on the topics that would make more sense to each.
In addition to this, the group also has initiatives at brand level, such as the ‘Coors Light Líderes’, which awards leaders that are impactful to the community, and the ‘MillerCoors
6 Business and Beer’, allowing small companies to learn and network with top business leaders.
Recognizing the need for cooperation, Molson Coors has even partnered up with different organizations (local, national and international) to work on water-related issues. An example of that is the participation on the industry’s working groups, where best practices are shared, as well as benchmarking to improve sustainability.
Taking on the partnership importance, AB InBev has launched an “accelerator program” for sustainability-related start-ups (Arthur, 2018). The group’s incubator will invest in selected applicants, which will then focus on 10 areas derived from the group’s “2025 sustainability goals” (Shoup, 2018), linked to: smart agriculture, water stewardship, circular packaging and climate action.
1.3 The Heineken Company & Sociedade Central de Cervejas e Bebidas
1.3.1 The Heineken Company
Established in 1873, in Amsterdam, after the acquisition of De Hooiberg (The Haystack) brewery in 1863, Heineken has now grown to over 85 000 employees and 300 brands in more than 190 countries, having 125 breweries in more than 70 countries with a strategy of “thinks global, acts local”, claims Nuno Pinto de Magalhães. It is Europe’s largest brewer and cider producer7, with revenues above EUR 22 billion in 2018 (Chart 2), and
the world’s second largest brewer by volume with 25 million Heinekens being served daily around the globe (Chart 3).
“Heineken is the world’s most international brewer. Wherever you are in the world you are able to enjoy one of our brands.” The Heineken Company’s official website
7 Chart 2: Heineken's main figures
Source: Author based on Heineken’s 2018 Annual Report
Chart 3: Heineken's consolidated beer volume, as a percentage of total, in 2018
Source: Author based on Heineken’s 2018 Annual Report
1.3.2 Sociedade Central de Cervejas e Bebidas
Established in 1934, Sociedade Central de Cervejas e Bebidas (SCC) is based in Vialonga, Portugal and fully owned by The Heineken Company since 2008. Its main output is Sagres beer, but it also sells other brands under its portfolio, namely Heineken and other beers, Água de Luso in the mineral water and Strongbow and Bandida do Pomar in the cider segments. It currently employs around 1 800 people and fully owns Novadis, the company which is now responsible for the distribution of SCC’s portfolio to c.a. 70% of the Horeca channel.
21.629 22.471 3.759 3.868 0 5 10 15 20 25 2017 2018 (i n bi lli on E U R )
Net Revenue Operating Profit
34% 36% 18% 12% Europe Americas
Africa, Middle East & Eastern Europe Asia Pacific
8
1.3.2.1 History
Sociedade Central de Cervejas (“the company”) was founded in 1934, resulting from the union of four former breweries: Companhia Produtora de Malte e Cerveja Portugália, Companhia de Cervejas Estrela, Companhia de Cervejas Coimbra and Companhia da Fábrica de Cerveja Jansen.
In 1943, the company started exporting to Gibraltar first and then to the Azores, Angola, Cape Verde, Guinea, S. Tomé and Príncipe, Timor, Goa, Macau and Mozambique. Having acquired 52.5% of Sociedade da Água de Luso’s share capital in 1970, it started selling the brand’s products as well.
Following a merger of Sociedade Central de Cervejas, S.A.R.L. (from 1934) with another brewery (integrated in 1972), Centralcer – Central de Cervejas, E.P. was created in 1977. After having its capital fully privatised in 1990, the Bavaria Group became one of Centralcer’s major shareholders, selling its shareholding in 2000 to VTR-SGPS, S.A. (a group of Portuguese companies formed by Parfil, Portugália, BES, Fundação Bissaya Barreto, Olinveste and Fundação Oriente), which assumed the Company’s management role. Later that year, Scottish & Newcastle, one of the largest European brewers at the time, was granted shares representing c.a. 49%. In 2001, following a Group’s restructuring, Centralcer was merged with Centralcontrol S.G.P.S., S.A., with the new entity becoming SCC - Sociedade Central de Cervejas, S.A. in 2004. Scottish & Newcastle finally acquired 100% of the company’s and Sociedade da Água de Luso’s share capital in 2003.
Lastly, in 2007, Carlsberg and Heineken set-up a consortium for a takeover bid to acquire the Scottish & Newcastle Group. This ultimately resulted in Heineken taking over control of Sociedade Central de Cervejas e Bebidas (SCC) on the 29th of April 2008, following
9
1.3.2.2 Vision, Mission, Strategic Objectives and Values
As the vision, mission and values of a company guide people and drive decisions throughout the organization, they should indicate what it aims to achieve, the culture and how people should behave. Business is run based on these pillars and they might be the justification for an enterprise’s success or failure, thus it is important to specify them8.
“To be known as the best drinks company in Portugal, with a sustained growth and generating maximum returns on investments”, Sociedade Central de Cervejas e Bebidas’ official website
1.3.2.2.1 Vision
“Together, we produce the leading brands that people just love to drink.” (Sociedade Central de Cervejas e Bebidas’ official website)
1.3.2.2.2 Mission
“Our mission is
- To have a leading brand business, with a highly efficient team that fulfils our consumers’ needs;
- To be the drinks company operating in Portugal that leads our consumers and customers’ satisfaction, producing and distributing the brands that they simply couldn’t live without;
- To develop our People in a safe culture.”
(Sociedade Central de Cervejas e Bebidas’ official website)
1.3.2.2.3 Strategic Objectives
“SCC Group’s greatest asset is the sum of its staff’s diverse experiences and skills, combined with the synergies generated by its excellent beer, cider and water brand portfolio, the value of its countrywide distribution network, which together fulfil its numerous and different consumer and business partners’ needs.”
(Sociedade Central de Cervejas e Bebidas’ official website)
10
1.3.2.2.4 (Behavioural) Values
The SCC Group has drawn the seven behavioural values that they expect their people to master:
“Proud of the brands and products we produce, sell and distribute; Passionate about everything we do;
Focused on our consumers; Work as a team;
Our business goals must always take into account safety, sustainability and economy principles;
Straightforward, flexible and quick, both in our actions and responses;
Aware of our business-associated costs, promoting its efficient management.” (Sociedade Central de Cervejas e Bebidas’ official website)
1.3.2.3 Products
SCC sells the below different brands (Figure 1), which can be split into six main categories:
Sagres beers, being Sagres Branca, Sagres Cascade, Sagres Preta, Sagres Bohemia, Sagres Radler and Sagres Sem Álcool Branca;
Heineken beer;
International beers, including Desperados, Guinness, Guinness Original, John Smith’s Extra Smooth, Kilkenny and Affligem;
Ciders, such as Strongbow, Bandida do Pomar and Old Mout;
Waters, comprising Água Mineral Natural, Água do Cruzeiro and Luso com Gás; and
Soft drinks, which includes Luso Fruta and Royal Club.
Strengthening its presence in the Portuguese natural mineral water market, SCC has announced, in August 2019, the acquisition of Mineraqua Portugal, which owns the Água Castello brand9, a centenary brand of carbonated natural mineral water, which is
estimated to own a 7% share by volume9 of the carbonated water market in Portugal,
11 Figure 1: Sociedade Central de Cervejas e Bebidas' Brands & Products
Source: Sociedade Central de Cervejas e Bebidas’ official website
It is important to highlight that, in 2002, Sagres was the “world's top selling Portuguese beer brand, including the domestic and exports markets” (Sociedade Central de Cervejas e Bebidas’ official website), with the main export markets being: Angola, Cape Verde, Spain, France and Switzerland. While in 2008, the brand “became leader in the domestic beer sector, a historic leadership accomplishment in the total domestic market both in volume and in value”10 – it currently holds a market share of c.a. 46%, as Nuno Pinto de
Magalhães assures.
In 2018, Sagres Beer and Água de Luso were nominated for the twelfth and ninth consecutive time, respectively, by Reader’s Digest Trusted Brands, while the Monde Selection Competition awarded gold medals to one of the Sagres beer’s categories, as well as Água de Luso, Luso com Gás and three beers under the Bohemia brand.
In 2018, Heineken beer has solidified its leadership in the premium segment in Portugal (although retaining a 2% market share of the overall beer sector in Portugal, as confirmed by Nuno Pinto de Magalhães), having reported a 12.4% growth in volume (vs. 2017) although the segment has registered an average growth of 7%11.
As for the Cider category, 2018 registered a 14% increase in volume in the domestic market, while SCC’s Cider portfolio presented an above market average development, with a “combined growth in volume of around 123%”12.
12
1.3.2.4 Sustainability
“Sustainability is part of our business’ DNA.” Nuno Pinto de Magalhães, Head of Corporate Affairs of SCC
SCC has recently created a separate team dealing with sustainability-related matters, which is placed under the Communication and Corporate Affairs, and which aims to provide a “helicopter view” of the whole business in the future, as Nuno Pinto de Magalhães confirms. For now, the team is focused on its water segment, namely Águas de Luso, due to its PET packaging, which is considered by Nuno Pinto de Magalhães their main challenge as of today and one of SCC’s priorities. Nonetheless, through its Communication and Corporate Affairs team, which still deals with the carbon footprint and CO2 emissions for example, SCC has developed several Corporate Social Responsibility (CSR) initiatives throughout its life.
1.3.2.4.1 First Sustainability-related Initiatives
SCC’s first measure regarding sustainability can be traced back to 1979, when the company introduced the “returnable packaging materials policy” (Sociedade Central de Cervejas e Bebidas’ official website), which still nowadays corresponds to most of SCC’s business, i.e. bottles are filled and sold to be then returned again, unlike most European countries which have a ‘one-way’ distribution. Since then, it has received the Quality Certificate (1996), being the first Portuguese brewer to achieve so, was awarded the Environmental License for its Vialonga Unit (2008), established Fundação Luso to promote education on water and health as well as the conservation of Luso’s water (2009), published its Volunteering Guide with the aim of engaging its employees in volunteering in the community (2011), has financially supported Vila Franca de Xira’s impoverished families (2012 and 2013), partnered up with Make a Wish Foundation for young people with life-threatening diseases (2012), reduced the energy consumption of Sagres’ refrigerating equipment for its Horeca channel clients (2012) and has set-up ‘Heineken Green Rocks’ for the recycling of empty cups in Rock-in-Rio Lisbon (2012).
1.3.2.4.2 Packaging
As pointed out, SCC is committed to consistently improve the packaging of its products. In 2007, the company changed its labelling paints to eco-friendly ones, while in 2012 it
13 has reduced Água de Luso’s packaging PET and launched the more environmental-friendly 5.4 litre bottle. As mentioned by Nuno Pinto de Magalhães, it is also currently changing the labelling of all its Sagres beers to FSC-certified paper (instead of metallic paper), which ensures the labels are responsibly sourced13, even though it means they are
less shiny, which has a marketing impact, and competition is still using metallic paper. Another example is the downsizing of the plastic bottles’ edges, which allowed a substantial reduction of plastic in its packaging.
Always trying to improve its footprint, SCC looks into the consumers’ opinion through reputation studies when positioning itself on sustainability efforts – the company is regarded as valued given that sustainability is a factor that is integrated in its activity, which might be explained by:
i) The fact that most of SCC’s business is, even if using glass, returnable; and ii) By SCC’s approach to sustainability: as Nuno Pinto de Magalhães put it in the
interview, it is part of SCC’s DNA and every decision taken or investment made as it into consideration.
This explains why SCC has recently invested in a new filling line, for its Vialonga unit, which increases production capacity to 55 000 bottles per hour and, at the same time, allows an annual reduction of: up to 22% of CO2 consumption, 12 6000 kWh of electricity and 96% of water consumption14.
1.3.2.4.3 Local Sourcing
There are four ingredients needed to produce a beer: malt (obtained from barley), unmalted grains (often corn, but might also be barley, rice or wheat), hops (an aromatic plant) and water. Being all natural products, SCC privileges sourcing locally: not only it supports barley creation in the country, but also its packaging which is 100% from Portuguese suppliers. The company does it because not only it is an important activity for the Portuguese economy, due to its exports and growth, but also for the creation of jobs. However, this poses one of SCC’s main challenges, as the type of barley it uses in its production is not widely available: Portugal accounts for only 40% of SCC’s needs, the remaining have to be imported.
1.3.2.4.4 Responsible Consumption
One of the brewing industry’s main challenges is responsible consumption. In 2007, Sagres introduced the “Be responsible. Drink with Moderation” label, again being the
14 first domestic beer to do so, which was expanded (through an “Enjoy in Moderation Seal”) to all its alcoholic beers in 2010.
1.3.2.4.5 Heineken & the Sustainability Program
Although Heineken allows high flexibility for its local brands, the Group tries to leverage on its knowledge in different areas such as provisioning, R&D, with the purpose of creating synergies, assures Nuno Pinto de Magalhães. Regarding sustainability, he adds that, although all the market players are tackling it, being part of an international group makes SCC being pulled. Not only is this integration relevant, but also the fact that SCC has become a well-established brewer emphasizes Sandra Peixoto – smaller brewers, naturally, do not have sustainability embedded in their daily operations.
SCC’s first program addressing sustainability started in 2006. ‘O Nosso Compromisso’ included several commitments from the company, which were defined after questioning its stakeholders (employees, government, consumers, suppliers and partners) on what they valued the most and what they believed SCC should do in this regard. However, 2008 was the first year of publication of SCC’s Sustainability Report, the same year of the integration into the Heineken Group. After a period of transition (where the company had 2 programs running in parallel), SCC aligned with the ‘Brewing a Better Future’ Program defined by Heineken for 2010 – 2020. The program, which has logically evolved and is now called ‘Brewing a Better World’ (Appendix A), is focused in 6 areas (Chart 4), which are then linked to 6 SDGs and has already allowed:
Reduction of water and energy consumption; Improvement of CO2 emissions;
Purchase of raw materials from sustainable sources; Continued promotion of responsible consumption; Investment in the surrounding community;
Enhancement of its employees’ safety, health and human rights, also visible in the decrease of accident frequency; and
15 Chart 4: Brewing a Better World's focus areas
Source: Heineken’s 2018 Annual Report (p. 119)
The agenda had been set-up before the launch of the SDGs (in 2015), considering that the program was already established by then. Thus, Sandra Peixoto clarifies that it was more straightforward to map the SDGs into the pre-established focus areas. Nonetheless, all the supply chain, from the ‘barley to the bar’, had to suffer changes to make sure there was a full alignment to the company’s objectives, which included substantial investment on the processes. The targets (available under Appendix A), defined by Heineken, were clear since the beginning and adapted to the reality of each country. After this, when the SDGs were introduced, the mapping to the objectives was done by checking each SDGs’ indicator and seeing where SCC could contribute, considering its business – this is a key step for the definition of indicators, as they should be realistic otherwise they will be impossible to be achieved (or even measured).
Even though employees’ feedback was taken into account, Nuno Pinto de Magalhães highlights that the first step, now surpassed, was the hardest: to pass the message and to make everyone understand that sustainability was not a ‘one team problem’ but transversal to the organization. To successfully get through this, SCC created an independent sustainability committee (which also overviews the achievement of the targets), with participants representing every area of the business, explains Nuno Pinto de Magalhães. Each participant had different responsibilities, while the sustainability team
16 was merely a coordinator, thus creating the need for the involvement of every team in order to successfully implement the sustainability strategy. Furthermore, several activities were held to promote this idea: awareness campaigns, training, internal and external communication (regarding involvement and achievements), volunteering programs (switching towards more environmental, namely on the region of Luso with plantation of trees, instead of only social areas) – all taking into account the different populations within the workforce, i.e. as SCC has different brands, also its employees have different profiles depending on the brand. Nuno Pinto de Magalhães stresses that changing minds is a core step.
As for other incentives that contributed to this process, Nuno Pinto de Magalhães highlighted that no government aid (be it in terms of incentives or fiscal benefits) were received. However, the measures implemented, which had lower environmental impact, brought economic benefits (e.g. the thinner bottles led to cost reduction).
As for the strategy, SCC hired a consulting company back in 2005, for the launch of ‘O Nosso Compromisso’. NGOs, such as Quercus, also support SCC, with a special focus on the Luso resources and also cooperating regarding the usage of plastic glasses (in events, such as festivals).
Regarding positive feedback from its consumers, Nuno Pinto de Magalhães distinguishes Millennials, which are increasingly aware of brands’ way of thinking and go beyond what is available in the supermarket and the product’s price (although it is not yet very clear what is the context in Portugal due to lack of data), and the institutional stakeholders (journalists, regulators, amongst others) which are opinion makers. Nonetheless, the latter are considered more relevant (thus there are specific communication campaigns targeting them), as consumers are highly segmented and have different targets.
To conclude, Nuno Pinto de Magalhães underlines the two main issues regarding sustainability in Portugal are: plastic bottles and plastic glasses, which heavily impact SCC’s business.
1.3.2.5 Market and Competition
1.3.2.5.1 Market Growth & Seasonality
The beer sector is placed under the food industry (FMCG) and is very attached to natural products, as they are the main ingredients of a beer. Being a very dynamic sector, Nuno Pinto de Magalhães highlights innovation is essential to prosper in the sector, as consumers expect new product launches and novelty.
17 The domestic market has, in 2018, registered a higher beer consumption for the second consecutive year, however, “consumption per capita remained unchanged at 51 litres, a number still behind the 61 litres recorded in 2009 prior to the beginning of the economic crisis”12. On top of this, beer exports totalled around 200 million litres last year, which
translates to a growth of 12.6% (vs. 2017)14.
According to Nielsen15, however, in the first semester of 2019, the beer category has
grown by 19% in value and 15% in volume. In fact, this was the highest growth of the beer category (considered to be under FMCG) in the last decade and is much related with the higher spending of the Portuguese population outside home, as well as brand promotion in the retail chain.
The Horeca channel, consisting of restaurants, snack-bars and cafés, bars, hotels and convenience stores, remains the most prominent for the beer category (Chart 5), being responsible for 80% of the sales in value and two-thirds in volume (Nielsen, 2019) – making Portugal one of the European countries that consumes most beer outside home. Chart 5: Revenue (in million Euros) of beer consumed at and out of home in Portugal (2010-2023)
Source: Adapted from Statista (2019)
Due to the importance of the on-trade channel, it is also relevant to emphasize the seasonality in the industry, as the summer months tend to register higher volume of sales due to the better weather conditions, the usual vacation period and an increase in tourism, the return of the Portuguese emigrants for holiday and the higher availability of products
672.3 676.4 657 609.9 581.4 582 606.8 645 674.1 701.5 717.7 727.4 740.9 755 266.4 250.1 248.6 255.9 265.6 268 261.9 250.3 236.5 226.6 221.7 219.8 219.7 218.1 939 927 906 866 847 850 869 895 911 928 939 947 961 973 0 100 200 300 400 500 600 700 800 900 1000 0 100 200 300 400 500 600 700 800 900 1000 2010 2011 2012 2013 2014 2015 2016 2017 2018 2019 2020 2021 2022 2023
18 in store. In fact, around 40% of the year’s sales happen between June and September (Chart 6).
Chart 6: Beer sales in volume (%) in 2018
Source: Adapted from Nielsen (2019)
1.3.2.5.2 Imports & Exports
Beer imports are not so significant for the Portuguese beer industry and have declined to 19.8 million litres in 2018 (-10.9% vs. 2017)16.
Conversely, Portugal was the sixteenth largest country exporting beer in 2018 (Workman 2019), with an estimated export value of USD 154.2 million (EUR 140 million), which represents around 1% of the world’s total. At a faster pace than the reduction in the annual production of beer (by 3% to 676 million litres in 2018), the exports slowed down to 162.2 million litres, or decreased by 14.6% (vs. 2017)16 but they still represent c.a. 25%
of the country’s production17. Since 2016, China is the leading importer of Portuguese beer, given the crisis in the Angolan market, however new barriers imposed to the Portuguese brands resulted in a decrease in beer sold by 45% or almost 30 million litres (or EUR 27 million)18 in 2018 – a trend that aggravated in the first months of 2019, which registered a decline by 55%18. On the other hand, exports to Spain have been growing (by
44%), after a 3% increase in 2018.
1.3.2.5.3 Tax
The brewing sector in Portugal is impacted by an Excise Duty, which amounts to c.a. 18 cents per litre19. Although beer is eligible for the Excise Duty application, wine is
exempted – a measure that the brewing sector regards as unfair, especially if one considers
6.1% 6.0% 6.5% 7.0% 8.4% 9.5% 10.5% 12.2% 10.2% 8.8% 7.2% 7.7% 0.0% 2.0% 4.0% 6.0% 8.0% 10.0% 12.0% 14.0%
19 the two drinks are substitutes. For 2019 this tax has been frozen, nonetheless there is still no overview on the Portuguese government’s decision for the coming year. The brewing sector, especially the Association ‘Cervejeiros de Portugal’ (which includes breweries such as SCC or Super Bock Group), is pushing for the freeze to last five years, as it would lead to the creation of 15 000 job posts and additional EUR 6 million in tax20.
Additionally, and mentioned by Nuno Pinto de Magalhães, wine also benefits from a lower VAT than beer: 13% and 23%, respectively21.
1.3.2.5.4 Competition
1.3.2.5.4.1
Direct Competitors
The Super Bock Group
The beer industry in Portugal is dominated by two brewers: SCC, the object of this case study, and the Super Bock Group. Together, they hold around 90% of the market share. As pointed out by Cision Portugal (2016), every year they fight for the leading position, which is highly determined by their communication (advertising, sponsorships, events and public relations) and this is the main reason for the companies to participate in music festivals (for example, Super Bock organizes the Super Bock Super Rock Festival and the presence in Rock-in-Rio is usually disputed) or in the sponsoring of the main Portuguese football teams (with SCC sponsoring SLB and the national team) – both want to be connected to leisure moments, party and friendship. Marketing and innovation are thus key areas to invest in.
In 2018, Super Bock was estimated to hold a 47% market share22, detaining the leading
position. The Super Bock Group (“Super Bock”), former Unicer and which had its trademark registered in 1927, is, since the end of 2018, 60% owned by the Carlsberg Group22 – 44% directly owned, while the remaining were acquired through a participation
on Viacer. Super Bock sells, besides its brand’s beer:
Carlsberg (premium segment), Coruja, Cristal and Cheers, as other beer brands; Somersby, on the cider category;
Água das Pedras, Vitalis, Melgaço and Vidago, under the water segment; Frutea, Frisumo, Frutis, Guaraná Brasil and Snappy, as soft drinks;
Vinha de Mazouco, Tulipa, Planura and Monte Sacro, within the wine segment, and Vini for sangria.
20 Craft Beer
The craft beer movement, which has started later in Portugal than in the rest of Europe, now counts with 140 national brands2323, however, the vast majority of them produces less than 200 hectolitres per year. Despite this, craft beer reported a growth of 10% in value and 15% in volume in 201823, although it only corresponds to c.a. 1% of the total
beer market. Craft beer is thus gaining acceptance and can usually be found on bigger grocery stores, gourmet shops, bars specialized in craft beer and some restaurants (Euromonitor International, 2019).
SCC and Super Bock have both invested in this segment as well through the Hoppy House Brewing (which sells Topázio brand) and The Browers Company, respectively. The newly created Quinas beer (February 2018), from the Domus Capital Group, aims to reach a 5.9% market share in the first three years24, thus trying to become the third player in the
Portuguese market, however at least half of its 2019 production is expected to be sold internationally. Other Portuguese craft breweries are: Sovina (the first microbrewery registered in the country, in 2011, which now belongs to the Esporão Group), Cristal, Tagus, Nortada, Mean Sardine, Passarola, Post Scriptum, Maldita, Vadia and Letra.
1.3.2.5.4.2
Indirect Competitors
Beer’s indirect competition is mainly wine and cider, nonetheless, one cannot discard other alcoholic drinks and soft drinks – as one has to look at the context of when beer is consumed.
Wine
Wine is considered beer’s most relevant competitor, not only due to the fact that it also counts with a high consumption per capita in Portugal (although consumers are changing towards drinking higher quality wine but less regularly), but also because its consumption generally happens in the same occasions when one could drink beer.
Wine’s revenue evolution (according to Instituto da Vinha e do Vinho (2019)), revenues amounted to EUR 975.7 million in 2018 (vs. EUR 929.6 million in 2017), which is the result of a 5% increase by value (although volume decreased by 1.2%) is mainly supported by tourism and a “rising interest in wine from Portugal” (Euromonitor International, 2019) and has turned from volume to value growth due to rising product quality and buyers’ improved expertise when the selection moment arrives.
21 Another relevant factor to take into account is the fiscal policy in the country. Wine is exempted from the excise duty that is applied to beer and also benefits from a lower VAT – although both are alcoholic beverages.
Similarly to the movement in the beer sector, with rising craft beer production, wine has also seen new smaller producers, which leads to a burden in the price from the off-trade channel (and thus more promotions) – as such, producers are turning to the international market and the on-trade channel.
Cider
As previously mentioned, cider registered a growth by volume of 14% in 2018, in Portugal, on the back of brand communication focused on the natural component of the drink, which targets mainly young adults and female consumers. Somersby, from Super Bock, is the leader of the segment (Euromonitor International, 2019) due to its investment in summer festivals, digital and TV campaigns. SCC is also on the cider market, via Bandida do Pomar, which arrived in 2017, and has experienced quick revenues due to its orientation towards digital platforms (Euromonitor International, 2019). It is also important to highlight the rise of private labels, such as Continente (2017) and Pingo Doce (2018), which usually propose a lower price.
1.4 Problem Review
Sustainable Development is considered a hot topic nowadays. With alarming statistics all around us, citizens are generally also pushing for a movement towards sustainability and changing to a greener lifestyle little by little.
Sociedade Central de Cervejas e Bebidas operates in the brewing industry and thus, selling a water-intensive product with an often disposable packaging, leads to the company focusing on its sustainability strategy. It was acquired by the Heineken group in 2008, which led to an alignment of its CSR policy to the group’s program. The study of this integration and the consequences on SCC’s sustainability strategy will allow to:
1. Understand the environment in which the company operates; 2. Recognize SCC’s competences;
3. Identify the challenges faced; and
22
2. Pedagogical Note
2.1 Target Audience
This pedagogical case study is intended to target students from bachelor or master’s degrees in Management, being especially useful to be addressed in courses within the two following fields: Strategy and Sustainability in business. Taking into account the practical approach of the case study, it might also be recommended for business professionals, who would like to better understand the implementation of sustainability strategies and develop their knowledge, or even for internal company use, being suitable for recruitment processes or employee training and development.
2.2 Pedagogical Objectives & Learning Outcomes
As a hands-on tool involving a real company, the pedagogical goals and the main learning outcomes of this case study are:
To solidify the theoretical concepts acquired;
To analyse the context of the company through the application of strategic management theory tools, specifically in the brewing industry, namely:
o Porter’s Five Forces;
o SWOT Analysis for identification of internal and external factors that might impact the business; and
To form an outline for debate between users, allowing the enhancement of problem-solving skills, critical thinking and teamwork.
The ultimate goal is to enable a translation of the learning conclusions and tools applied to other contexts, be it different companies, sectors, industries or countries. This allows professionals that are responsible for the implementation and development of a sustainability strategy within their companies to apply these instruments internally.
23
3. Literature Review
In the following sections, the studies previously conducted and research made throughout the past years is presented. The evolution of the concepts "Sustainable Development" and "Corporate Social Responsibility" is also provided, in order to better understand the topic, as well as the need for the United Nations (UN) to create the 17 Sustainable Development Goals (SDGs) in 2015 (and the previous Millennium Development Goals), which fields the SDGs cover and what they truly represent. Finally, guiding principles (also prepared by the UN) in order to facilitate the implementation process of the SDGs on companies’ business model, as well as how corporations have been addressing this issue, were gathered.
3.1 Sustainability
3.1.1 Definition and Evolution
"Sustainability" and "sustainable development" have been explained in hundreds of definitions (Johnston et al., 2007). It can be referred to as the goal of Sustainable Development (Diesendorf, 2000). Today, and according to the Oxford Dictionary, sustainable development is an economic development that is conducted without the consumption of natural resources being faster than their replenishment (Mittal and Gupta, 2015). However, the most widely used definition for this concept quotes that it is a development that “meets the needs of the present without compromising the ability of future generations to meet their own needs” (Du Pisani, 2006: 83), which was the one introduced by “Our Common Future” or the “Brundtland Report” (United Nations, 1987). In order to fully understand what sustainable development really means, one must also have in mind the evolution of the world in the past centuries and how it has contributed to this concept. Although the concept of sustainability has been raised by “Plato in the 5th century BC, Strabo and Columella in the 1st century BC and Pliny the Elder in the 1st century AD” when they “discussed different types of environmental degradation resulting from human activities” (Du Pisani, 2006: 85), as well as “recommended what we would call sustainable practices to maintain the ‘everlasting youth’ of the earth” (Columella, 1948: 3, 19), it was only after the industrial revolution, in the 18th century,
that it received more attention. The industrialization brought prosperity and economic growth to the countries that started producing in mass, however, it has also led to:
24 ii) An abusive use of raw materials, such as wood, at a worldwide scale; and iii) Dependency on non-renewable energies, such as fossil fuel-based energy
sources, which ultimately was also translated into increased pollution.
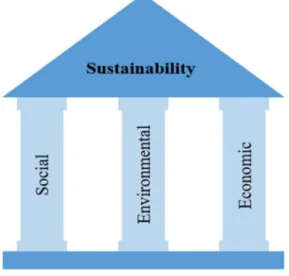
Especially after the World War II, with the growing population and the ecological disasters getting more media coverage, several movies and TV shows raised awareness to an ecological crisis. Additionally, different bodies were created in order to address this matter, such as the International Union for Conservation of Nature (IUCN), founded in 1948 in order to ensure an ecologically sustainable use of natural resources, The Club of Rome, which in 1972 reported that economic growth could not last indeterminately due to restricted natural resources (Meadows et al., 1972), oil specially or the UN Environment Programme which was created in 1972 (after the conference in Stockholm, where 122 countries signed a declaration of principles) to be the authority that sets the "global environmental agenda" (UNEP), while promoting the implementation of the environmental dimension of sustainable development within the United Nations (UN) system. After the Stockholm conference, in June 1972, the position of Minister of the Environment was created within several governments. The first environmental Non-Governmental Organizations (NGOs), such as Greenpeace among other associations, were also established, culminating on Earth Day being celebrated in 1970. Later in 1983, the UN created the Brundtland Commission to reflect about ways to save the human environment and natural resources and prevent deterioration of economic and social development and, officially launched in 2000 (United Nations, 1999), the UN Global Compact was also set-up as a non-binding UN pact to encourage companies to adopt sustainable and socially responsible policies while reporting on their implementation. Being a voluntary initiative and a principle-based framework which incorporates ten principles in the areas of "human rights, labour, the environment and anti-corruption" (UN Global Compact), it provides support to UN goals, such as the SDGs. The expectation of an imminent ecological catastrophe in this period stimulated a new mode of thinking about development and prepared the way for sustainable development as an alternative to unlimited economic growth. In the 1992 Earth Summit in Rio de Janeiro (Brazil), it was general understanding that such a broad concept needed a holistic approach and was based on three main “interdependent and mutually reinforcing” (United Nations, 2005: 12) pillars (Figure 2): social, environmental and economic (Munasinghe, 1992; Banuri et al., 1994; Najam et al., 2003; United Nations, 2005).
25 Figure 2: The Three Pillars of Sustainability
Source: Adapted from United Nations (2005)
The interconnection of the pillars (Figure 3), represented by the Interlocking Circles Model (which was adopted by the IUCN Programme in 2005 to show the three dimensions have to be better integrated), was verified during the 2008 financial crisis, when the weakness of the other pillars has caused a deteriorated environmental pillar. As well, if the social pillar suffers a crisis (e.g. during a war period), the environmental problems will lose importance.
Figure 3: Interlocking Circles Model used by the IUCN
Source: Adapted from IUCN (2006)
Frequently efforts are made by focusing in one pillar at a time, for example, the UN Environmental Programme (UNEP) and environmental NGOs focus on the environmental pillar, while the World Trade Organization (WTO) and the Organization
26 for Economic Cooperation and Development (OECD) work mostly on economic growth. Although the UN make efforts on all the three pillars, the economical usually receives more consideration, as economic progress is what most of its members seek.
3.1.2 Sustainable Development Goals (SDGs)
3.1.2.1 Before the SDGs
In the context of the UN Millennium Declaration (signed in 2000), which commits “world leaders to combat poverty, hunger, disease, illiteracy, environmental degradation and discrimination against women” (World Health Organization), the 189 UN Member States (MS) created the Millennial Development Goals (MDGs). The 8 MDGs (available under Appendix B and which included more than 60 indicators for progress measurement) were intended to tackle problems the MS noticed were not being correctly addressed (and would eventually harness the future generations' quality of life) and were to be achieved by 2015.
The MDGs have been considered "the most successful anti-poverty movement in history" (United Nations, 2015: 3) by Ban Ki-moon, UN’s previous Secretary-General, and a study has further found that at least 21 million (and up to 29.7 million) extra lives were saved due to accelerated progress, i.e.were saved beyond “business-as-usual” pre-MDG trends (McArthur and Rasmussen, 2017). Nonetheless, very few of the targets to be achieved were actually accomplished by 2015 (Ritchie and Roser, 2018) and one is able to recognize (Appendix C) the different levels of achievement taking into account the region considered, i.e. low-income countries (LICs) have registered higher progress, while the middle-income countries (MICs) have seen less acceleration as they were already more advanced at the starting point, before 2000 (McArthur and Rasmussen, 2017).
3.1.2.2 Laying foundation for SDGs
One of the key ideas that has been advocated for the following agenda was that governments and public institutions alone would fail to accomplish the SDGs. Instead, private sector funding would be crucial to complete the task (Adams and Jeanrenaud, 2008). Companies would have to undertake and share responsibility as well, although they needed the financing means to reward their move towards a more sustainable business model (IUCN, 2006). Organizations such as the World Business Council for Sustainable Development (WBCSD), with over 200 member companies that work
27 together to accelerate the transition to a sustainable world, should be leveraged on.All this involvement of several entities at different levels meant access to more data. As highlighted by The Millennium Development Goals Report (United Nations, 2015), for the SDGs to be met, the implementation strategies to be applied needed to have reliable, treated and in real-time data (crucial to provide the best solutions faster), otherwise it would not be possible to correctly measure the agenda’s impact and resources could be directed towards less efficient channels. The same report suggests that “an integrated framework of indicators is needed” (United Nations, 2015: 13), pointing towards an integrated statistics system. This also enables governments to adapt their national sustainable development strategies25 and focus intervention on where most needed.
3.1.2.3 Creation of SDGs
After the MDGs’ targets not being entirely met by 2015 as stipulated, the UN’s 193 MS decided to create the SDGs (Appendix D), also known as the “2030 Agenda for Sustainable Development”, which are composed by 17 goals (and more than 200 indicators) to further foster the results of the MDGs in a much wider scope within the 5 Ps: People, Prosperity, Planet, Peace and Partnership. While the former were condemned for centring developing countries (Kumar et al., 2016), the latter apply to all nations.
3.1.2.4 Approach at EU level
Even though “The New European Consensus on Development” (2017) has been agreed upon – an outline for action on collaboration for the EU and the MS, which clearly mentions both “will improve the quality and availability of data on their development cooperation activities” (European Commission, 2017: 55) – a newly released report from the European Court of Auditors26 states that sustainability reporting does not yet happen
at the European Commission (EC) level. Thus, citizens are not able to draw conclusions on how the EU contributes to sustainable development, despite its commitments to the SDGs. In September 2018, Helsinki announced it would voluntarily report (on a regular basis) its progress on SDGs implementation, with the aim of becoming “a pioneer for local implementation of global responsibilities”27. Having presented this year's report,
Helsinki became the first city in the EU and the second in the world (after New York) to commit to produce regular sustainability reports.
28 Drawing on the lessons learnt from the MDGs, the UN Development Programme has created tools (such as the “SDG Integration Offer” and the “UN SDG Action Campaign”) to support countries with data analysis, policy and innovation solutions to reach the SDGs.
3.1.2.5 Private sector
Since the beginning, i.e. when the SDGs were to start being implemented, it was clear that public financing support would play a crucial role in catalysing other funding sources. Moreover, given the holistic approach the SDGs follow, private sector engagement and the mobilization of private sector funding (ranging from MSMEs to the largest international groups) would also be needed in order to have a successful achievement of the targets (European Commission, 2017).
Although Friedman (1970) supported that businesses are only able to be socially responsible if they maximize profit, there is evidence that:
i) Companies that build conscious and receptive relations with their stakeholders tend to be more successful and long-standing in the long term (Wheeler and Sillanpää, 1997; Diesendorf, 2000); and
ii) Consumers are more sensible to receiving “negative CSR information” than showing support in case they are confronted with “positive CSR information” (Sen and Bhattacharya, 2001: 232).
Additionally, a business might decide to change its direction towards a more environmentally-friendly and socially-focused direction, as mentioned by Diesendorf (2001) to avoid litigation, from not complying with new regulation, or consumer boycotts (such as the one made to The Body Shop for cruelty-free cosmetics testing or to Nestlé to achieve a zero deforestation policy in its palm oil supply chain28), to gain market
advantage due to product differentiation, to reduce its operating costs (due to more efficient processes), to increase customers’ loyalty or even to retain and attract talent (Bansal and Song, 2017). This is exactly what Maltenfort (2018), senior manager (CSR) at the Campbell Soup Company argued in an interview:
“corporate responsibility efforts attract top talent, engage employees and instil pride, build stronger customer partnerships, enable better connections with consumers, manage supply chain risks and allow for transparent conversations with investors. It’s not just the right thing to do; it’s good business”.