HOW
TO
IDENTIFY
VALUABLE
FIRMS
FOR
OUTSIDE
INVESTORS?
A case stud y of Alibaba Group
Tan Hui
Project submitted as partial requirement for the conferral of Master in Finance
SU P E RV IS OR:
PR O F. PED RO LE IT E IN ÁC IO ISCTE BU S IN E S S SCHO O L, DE P AR TM E N T OF FIN ANCE
Abstract
IPOs (initial public offering) of valued privately-held companies can be great investing opportunities for all outside investors. However, most IPOs face great underpricing and bad long run performances, which may cause losses to uninformed investors.
This case study of Alibaba’s IPO will demonstrate the methodology of finding out the true value of a company and proper share price for outside investors to identify good investing opportunities.
Keywords: corporate valuation, Alibaba, IPO, stock
Resumo
IPO de empresas privadas (oferta pública inicial) pode ser uma grande oportunidade de investimento para todos os investidores externos. No entanto, a maioria das empresas de IPO enfrentam um problema, os valores de stock apresentam uma grande subvalorização, e más performances de longa duração o que poderá trazer um grande prejuízo a muitos investidores mal informados.
Neste caso, que tratará da análise de IPO de ALIBABA, a metodologia de investigação irá demonstrar o verdadeiro valor da companhia e o valor correto da transação para os investigadores externos, os quais desta forma poderão identificar boas oportunidades de investimento.
Palavra de chave: Empresa valorização, Alibaba, IPO, stock
I
INDEX
1. Introduction ………....………...…………1
1.1 Background ………...……….…...………1
1.2 Goals of study………...……….…...…….………1
1.3 Methodology and contents………...……….….…...….…………2
2. Literature review ………..3
2.1 Basic concepts ………….……….3
2.2 IPO underpricing ………….……….3
2.3 IPO stock long-run performance ………….……….4
2.4 Valuation methods ..………….………..………..………...…..5
3. Introduction of Alibaba Holding Group ……….10
3.1 Introduction of Alibaba’s main operation department ………….………...10
3.2 Introduction of Alibaba’s profit model ………….………..……11
4. Analysis of Alibaba ………..…….14
4.1 Investment Prospects Analysis ………….………..……..14
4.2 SWOT analysis ….………..……….…….18
4.3 Financial Analysis………..………...19
4.4 Share performance analysis………...21
5. Valuation………...… 26
5.1 Discounted Cash-Flow Models ………..………...…...26
5.2 Relative Valuation ……….……..………....………33
5.3 Recommendation ………..………...…………34
II
1
1.Introduction
1.1 Background
Alibaba Group Holding Limited is a Chinese e-commerce company that provides consumer-to-consumer (C2C), business-to-consumer (B2C) and business-to-business (B2B) sales services, electronic payment services and data-centric cloud computing services. The company primarily operates in the People’s Republic of China. On 19 September 2014, it had its initial public offering at New York stock exchange with a code of “BABA”. Alibaba's market value was measured as US$231 billion. The pricing of the IPO initially raised US$21.8 billion, which later increased to US$25 billion, making it the largest IPO in history. However, the stock has traded down and market cap was $145 billion at the end of September 2015.
1.2 Goals of study
All companies need capital to start up their business, to support new projects, or to export new segments. There are two ways for privately-held companies to do so: asking more investment from the original shareholders or seeking capital from the public.
When the investment of the original shareholders cannot meet the needs of the company, the best way to get money is going public (also known as IPO).
IPO, is short for initial public offering, is the first sale of stock by a company to the public. Therefore, an IPO is the first time the owners of the company give up part of that ownership too other stockholders.
However, when companies go public, the equity they sell in an initial public offering tends to be underpriced, resulting in a substantial price jump on the first day of trading.
The price jumping after the first day may cause great losses to uninformed investors. Hence, how to valuate a privately-held company that is going public and how to decide the proper price for its shares is a matter of considerable interest.
This case study bases on Alibaba’s registration statement, road show materials, financial reports and other published materials to analyze its value. Fundamental analysis, share price analysis and equity valuation will be applied from an outsider perspective. The competitive advances
2 will be measured by internal and external environment. The result of this case study has direct meaning for Alibaba’s potential investors. On the other hand, the methodology used in this case study may help financial professionals.
1.3 Methodology and contents
In this case study, both descriptive and qualitative methods will be applied and various previous researches of corporate valuation will be taken as reference, to measure the value of study object, Alibaba Group Holding Limited. Different valuation systems will be compared and analyzed according to their applicability and limitations.
First, this case study will introduce the general information of internet industry and the company. Then, the company’s competitive advantages will be measured by internal and external environment: industry attractiveness will be tested by observing the E-commerce competition; SWOT analysis will be applied to test Alibaba’s strategies; financial reports will be analyzed and assumptions will be made. Last, the proper target price will be derived from DCF method and relative valuation.
There are six chapters:
Chapter 1 is introduction
Chapter 2 is review of literature. It introduces basic concepts and demonstrates various ways of corporate valuation.
Chapter 3 introduces the general information of Internet industry and Alibaba Group.
Chapter 4 is the case study of Alibaba Group, including sector analysis, strategy analysis
Chapter 5 presents the financial analysis and applies DCF method and relative valuation to derive proper stock price for Alibaba and provides advices for outside investors.
3
2.Review of literature
2.1 Basic concepts
Book value is the value of an asset according to its balance sheet account balance.
Market value or Open Market Valuation is the price at which an asset would trade in a competitive auction setting.
Intrinsic value refers to the value of a company, stock, currency or product determined through fundamental analysis without reference to its market value. It is ordinarily calculated by summing the discounted future income generated by the asset to obtain the present value.
Fair value is the estimated value of all assets and liabilities of an acquired company used to consolidate the financial statements of both companies.
Liquidation value is the likely price of an asset when it is allowed insufficient time to sell on the open market, thereby reducing its exposure to potential buyers. Liquidation value is typically lower than fair market value.
Enterprise value or Total enterprise value (TEV) is an economic measure reflecting the market value of a whole business. It is a sum of claims of all claimants: creditors (secured and
unsecured) and equity holders (preferred and common).
2.2 IPO underpricing
IPO underpricing is a well-documented phenomenon. There are several principal theories to explain it.
The first theory is Adverse Selection model, which was established by Rock (1986). This model assumes that one of these parties knows more than the others, and that the resulting information frictions give rise to underpricing in equilibrium (Espen, 2007). Investors are divided into two categories: the informed investors know the true value of the shares, while the uninformed investors do not know it. If the issuing firm makes its IPO price reflect its true value, the uninformed investors will make break-even or lose money because of asymmetric information. Therefore, they will choose not to participate in the IPO. On the other hand, the informed investors will not demand much for the IPO, either. As they have full knowledge of the
4 company, they will only invest in “good deals”. Hence the issuing company has the motivation to underprice its shares to increase the demand of IPO in case of undersubscription.
The second theory is Principal-Agent Theory which is established by Baron (1982). It focuses on the relationship between the issuing company and investment bank. This model assumes the issuing company does not know its true value. It has to relay on the report of investment bank for accurate information. Then a contract is made between the two parties about IPO price. The contract must meet certain minimal levels of expected returns to the investment bank, and the IPO price must be low enough to induce the investment bank to act in the issuing firm’s best interest (Peter, 2000). Therefore, the issuing company intends to underprice its shares so that the investment bank discloses all information of the company’s interest.
The remaining theories focus on signaling effects on an IPO price. In these models, both the issuing company and the investment bank have perfect information about the true value of the shares, and investors are the uninformed entities. Investors then value the company as a function of several different signaling mechanisms (Peter, 2000).
A study done by Leland and Pyle (1977) concluded that the issuing company could signal its value by retaining its own shares. The more shares retained by its original owners, the higher value it signals to outsiders.
Willenborg (1999) presented a theory that explained demand for IPO shares as a function of the
size and status of the auditing firm.
If a company’s financial statements are very positive, it benefits more from having more accurate reports. Logically, it desires to hire a more reputable auditing firm. This is the informational signaling effect which raises the demand for the IPO. On the other hand, when the IPO is overpriced or is involved in securities litigation, the investors are more likely to get back their investment if the defendant auditing firm is large and well established. The insurance signaling effect also serves to increase the demand for the IPO. The investment bank knows these effects and will lower the share price when he agrees on the IPO contract in case of downsize risk.
5
Ibbotson (1975) studied IPO shares established during 1960 to 1969. The result shows that
during the first year after IPO, IPO shares perform better than the standard; in the following 3 years, they perform worse than the standard; but in the fifth year, they have better performance again. However, as the sample size used in this study is too small, Ibbotson failed to conclude that “market is not efficient after the IPO”.
Loughran and Ritter (1995) examined the performance of IPO stocks during 1970 to1990.
They applied a bigger sample size: 4753 IPO stocks during 20 years. Besides, they used 3 year and 5 year as measurement period to make the results more reliable.
Though most studies support that IPO stocks do not have good performance in the long run,
Brav and Gompers (1997) presented different ideas. They applied different investment
portfolios to test the long run performance of IPO stocks and got opposite results. They argued that IPO stock did not obviously perform badly in the long run. Therefore, the studies of IPO long run performance were closely related with the way of measuring stocks’ long run returns ever since.
2.4 Valuation methods
Though there have always been investors who have believed that market prices are determined by the perceptions of buyers and sellers, most of the scholars argue that “it is possible to estimate value from financial fundamentals, albeit with error, for most assets, and that the market price cannot deviate from this value in the long term” (Damodaran, 1994). In Damodaran’s work, he mainly introduced two ways of valuation: absolute valuation and relative valuation.
2.4.1 Absolute Valuation (DCF)
Absolute value models (or discounted cash-flow models) try to determine a company's intrinsic worth. Usually, absolute value is estimated by calculating the present value of the company's future free-cash flows (cash flow minus capital spending). The present value of that future-income stream is the theoretically correct value of the stock. Dividend discount model (DDM) and free cash flow discount valuation are included.
6 Gordon constant growth model
Gordon’s model is a model for determining the intrinsic value of a stock, based on a future series of dividends that grow at a constant rate. The formula is
V =
=
. (1)
Where V is the stock’s fundamental value; D0 is the most recently paid dividend; D1 is the dividend expected to be paid in one year; r is the required rate of return on the stock; and g is the dividend growth rate. The required rate of return (r) must be more than the dividend growth rate (g); if it is not, another valuation method must be chosen.
Two-stage growth model
Many companies experience above normal growth rates for a short period of time before settling in on a lower but stable perpetual growth rate. It would be inappropriate to calculate the stock’s intrinsic value based on the constant dividend growth model. The two-stage dividend growth model formula is V =
[∑
]
+ . (2)Where gs is the short-term dividend growth rate; gL is the long-term dividend growth rate; t is the year (i.e., 1st year, 2nd year, etc.); and n is the growth period in years.
H-Model
The H-Model assumes that growth begins at some super-normal rate, then the growth rate declines in a linear fashion until it reaches the normal rate. Under the H-Model,
Value =
–
+
– – . (3)
Where gt is the growth rate at time t; gs is the current super growth rate and H is the half-life of the expected high growth period.
7 This model is designed to value the equity in a firm with three stages of growth - an initial period of high growth, a transition period of declining growth and a final period of stable growth.
V=
+ [
]*(g1−g2). (4)
Where n1 is the length of high growth phase ;n2 is the period until constant growth phase, therefore, n2= n1+ length of transition phase; g1 is the growth rate during high growth phase; g2 is the growth in constant growth phase after n;.
Free Cash Flow (FCF) Model
Free cash flow (FCF) is a measure of financial performance calculated as operating cash flow minus capital expenditures. It represents the cash that a company is able to generate after laying out the money required to maintain or expand its asset base.
Free cash flow (FCF) = cash flow from operating activities - net capital expenditures (total capital expenditure - after-tax proceeds from sale of assets). Then the value of the firm can be calculated by
V=∑
+ RV. (5)
RV is the residual value.
There are two forms of free cash flow: Free Cash Flow of Equity (FCFE) and Free Cash Flow of Firm (FCFF), the formulas are
FCFF=EBIT*(1-t) + Dep-FCInv-WCInv. (6)
FCFE=FCFF- Int*(1-t) + net borrowing. (7)
Int is interest expenses; FCInv is fixed capital investment; WCInv is working capital investment; Dep is depreciation
Discount FCFF by weighted average cost of capital (WACC) or discount FCFE by cost of capital (re), we can get the firm value.
8 Relative valuation models are an alternative to absolute value models, this method compares a firm's value to that of its competitors to determine the firm's financial worth. Like absolute value models, investors may use relative valuation models when determining whether a company's stock is a good buy.
P/E ratio
The Price-to-Earnings Ratio is a ratio for valuing a company that measures its current share price relative to its per-share earnings. The higher the P/E ratio, the more the market is willing to pay for each dollar of annual earnings.
Price-To-Book Ratio
A lower P/B ratio could mean that the stock is underpriced.
P/B ratio =
. (8)
Price-To-Sales Ratios
The price-to-sales ratio is an indicator of the value placed on each dollar of a company’s sales or revenues.
P/S ratio =
. (9)
Price-To-Cash-Flow Ratio
A ratio in the low single digits may indicate the stock is underpriced, while a higher ratio may suggest potential overvaluation.
P/CF ratio =
. (10)
The cash flow can be replaced by adjusted operation cash flow1 or FCFE or EBITDA.
Price/Earnings to Growth
The PEG ratio is used to determine a stock's value while taking the company's earnings growth into account, and is considered to provide a more complete picture than the P/E ratio.
1
9
PEG ratio =
. (11)
Enterprise multiple
A low ratio indicates that a company might be undervalued.
EV/EBITDA ratio=
10
3. Alibaba Group Holding Limited
3.1 Introduction of Alibaba’s main operation department
Alibaba group covers every aspect of e-commerce, including the biggest C2C platform in China, Taobao Marketplace; Chinese biggest B2C platform, Tmall.com; the group buying supermarket, Juhuasuan; and the biggest B2B platform in China, 1688.com. Alibaba’s oversea business includes C2C platform AliExpress and B2B platform Alibaba.com. Except for online shopping platform, the adverting service platform Alimama, the intelligent logistics platform Cainiao Logistics (Alibaba owns 48% of its shares) and cloud service company Aliyue are also in Alibaba’s business landscape. Besides, Alibaba has expended its business landscape to other business. Recently, it invested in UC browser (100%)、Gaode Map (100%)、Sina Weibo (18%)、 Intime Department Store Group (9.9% of its shares and 370 million HK$ of Convertible bonds)、 Youku video website (16.5%)、China Vision Media Group (60%) , Guangzhou Evergrande Football Club (50%).
11 However, Alipay is a personal hold company by the Alibaba management, has not been consolidated to Alibaba group. It provides payment solutions to Alibaba Group though contracts.
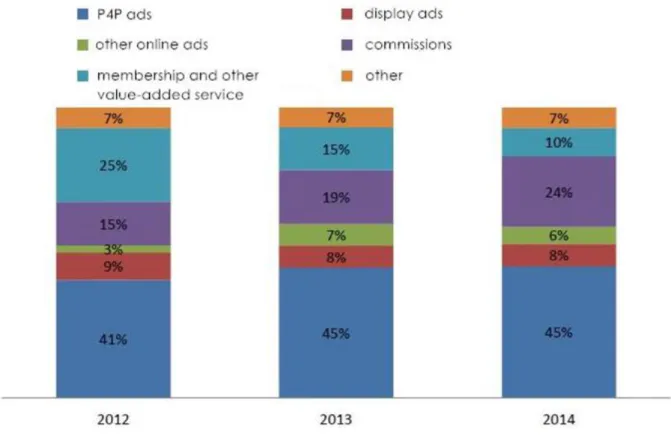
3.2 Introduction of Alibaba’s profit model
Chart2: Portion of profit contributed by different department
(Source: Alibaba’s registration statement)
As showed in chart 2, Up to fiscal year of 2014, the contribution of profit by inland retail business (including Taobao, Tmall and Juhuasuan) has increased to 81.6%. Unlike Jing Dong (JD.US), Amazon (AMZN.US) and other online retailing company, Alibaba relies more on the profit of advertisement.
12 (Source: Alibaba’s registration statement)
As showed in chart 3, 60% of profit of Alibaba Group in 2014 realized from advertisement, including P4P (Proactive network Provider Participation for P2P), display advertisement and other forms of ads.
Table 1:How does Alibaba make profit through its main inland business
Taobao.com Tmall.com Juhuasuan.com
Taobao sellers
P4P ads N/A commissions
display ads listing fees
commissions for Taoke2
shop decoration fees
2
13
Tmall sellers
P4P ads commissions commotions
display ads P4P ads listing fees
display ads
14
4. Analysis of Alibaba
4.1 Investment Prospects Analysis
4.1.1 Tmall.com (B2C) provides motility of growth
Chart 4: Gross Merchandise Volume (GMV) of Taobao and Tmall since 2012
(Source: Alibaba’s registration statement)
As showed in Chart 4, Tmall.com has a greater growth of inland retail volume than Taobao.com.
Up to the end of 3rd fiscal quarter of 2014, Tamll.com has achieved a growth of 80% while Taobao.com only achieved a growth of 33%. The total GMV of Tmall.com and Taobao.com is 3:7. This trend reflects the change of Chinese online shopping structure. According to data provided by Iresearch, the inland B2C and C2C online shopping business has a portion of 5:5 in 2015; the portion is estimated to increase to 4:6 in 2017.
15 (Source: IResearch.cn)
C2C business dominated the online shopping market in the initial phase because of its low-price feature. However, as consumers increase their needs for product quality, shopping experience, after-sale service, logistics and safety of payment, the B2C business shows its advantages. As the leader of Chinese online business, Alibaba should have the same trend of the industry. Tmall will contribute more portions to the company’s gross income and become the motility of company growth.
Chart 6: 2011-2018 China e-commerce market scope
(Source: IResearch.cn)
4.1.2 The fast development and high penetration of mobile ends
16 (Source: Alibaba’s registration statement)
Alibaba is one of the first companies to start their mobile internet business, it launched mobile Taobao platform as early as 2008.
According to the registration report, up to the end of June in 2014, the mobile end penetration rate had reached 32.8%. Revenue gained in this fiscal quarter increased 2.45 billion Chinese yen, increased 111% compared to other terminals; increased over 900% compared to last fiscal quarter. Now, Alibaba has a layout of mobile ends that includes Mobile Taobao, AlipayPortal, Mobile Tmall and so on. Besides, Alibaba has acquired several companies that have good layouts on non-ecommerce mobile platform, including Weibo, AMAP and UC Browser.
Alibaba copied the profit model of its PC ends to its mobile ends. It approaches a large number of users through its well-built e-commerce platform and realizes monetization by advertisement. Therefore, as there is explosive growth of Chinese mobile internet users, the mobile platform layout is more important for Alibaba than the traditional trading profit model used by Jingdong.com and Amazon.
Chart 8: Alibaba’s mobile ends revenue and rate of monetization of mobile ends since fiscal year 2013
(Source: Alibaba’s registration statement)
17 The quickly growing mobile ends business provides Alibaba new profit channel. In long term, the mobile ends layout is the most important to build Alibaba’s Online to Offline (O2O) circle and explore an ever bigger offline market. At the begging of 2014, Alibaba organized its O2O business group and published its strategic concept of “thousands” “codes” and “integrate” “eight scenes”.
“Thousands” refers to that Alibaba plans to absorb 5000 brands in to Tmall.com; “codes” refers to Alibaba’s QR Code plan; “integrate” means Alibaba plans to integrate data of mobile traffic, data of membership, data of product and data of payment; “Eight scenes” means O2O project will realize eight core business scenes.
Now Alibaba’s O2O business layout includes Taodiandian (an app for customers to order and pay the bill in offline restaurants), Taobao movie (an app that provides movie information, seat-picking service and ticket booking service), Ali travel (a platform that provides ticket and hotel booking service and visa service), and so on.
In February 2014, Alibaba announced to purchase A MAP and finished this transition in July. Alibaba made up for its weakness in location-based service (LBS) through this acquisition. It means that the company found another important entrance of O2O. According to data provided by China's Ministry of Commerce, up to the first half of 2015, the Chinese O2O market size has reached 304.9 billion CNY, with a growth rate of 80%. As O2O model asks for a lot online and offline recourses, this market is very likely to be monopolized by three industry leaders in China. The three leaders are Baidu, Alibaba and Tencent (BAT). Alibaba’s good layout and its e-commerce attribute will helps to stand out of this competition.
4.1.4 Cloud service and big data
According to Alibaba’s registration statement, up to 31th of March 2014, the company’s cloud computing and basic internet business had increased to 773 million Chinses yen, was 1.5% of company’s revenue. Ali Cloud had provided distributed computing for Alibaba since 2009 in order to deal with the mass of data produced by the e-commerce platform. Ali Cloud will also provide cloud service for the sellers on Alibaba’s e-commerce platform and other third-party users in the future.
There are two advantages of Ali Cloud. First of all, it has accumulated a great deal of experience about how to optimize the ability of computing and data storage from its own e-commerce business. Like Amazon Web Services (AWS), which lead the world’s cloud service market,
18 Alibaba has technical advantages over other competitor. For example, on the promotion day of Alibaba in 2013, Ali Cloud dealt with over 250 billion orders in 24 hours, the transition amount is over 0.3 trillion Chinese yen. In Aguste of 2013, Ali Cloud stared to operate a cluster named “Feitian” which including 5000 servers. Ali cloud became the first chinses company that independently developed large-scale computing platform.
Second, in the coming 2 to 3 years, small-sized enterprises will be the main costumer of cloud service because they have bigger receptivity for new technique and are more sensitive for operation cost. They can lower down the needs for IT devices and professional staffs. Alibaba has the closest relationship with small-sized enterprises among those Chinese internet leaders, a huge number of sellers on Alibaba’s e-commerce platform are its potential customers. Up to the end of June 2014, there are over 1.4 million customers directly and indirectly using Ali Cloud’s service.
Through the cloud computing market of China is small now, it has great potential. According to Gartner research, the world cloud computing market had a grow rate of 17% in 2015. Therefore, Ali cloud will contribute more profit in the future and become another motivating factor of the company.
4.2 SWOT analysis
4.2.1 Strength
Alibaba has integrated the business process.
Alibaba is Chinese market leader of B2B an.
Alibaba has great marketing capability.
Alibaba has outstanding enterprise culture.
Alibaba has mass information source.
Alibaba has great innovation ability
Alibaba has sufficient funds.
19 Alibaba is not good at search service.
Fake products disputes damaged Alibaba’s corporate image
4.2.3 Opportunity
Good prospect of e-commerce in China.
More and more SMEs need B2B platform. Legal on e-commerce is more mature.
Great country market prospect
4.2.4 Threats
There are a lot of international competitors.
Declined international market demand
Internet security issues
4.3 Financial Analysis
4.3.1 Revenue Growth Analysis
Table 2: Growth of multiple items
CAGR 2012-2016
Sales 50%
EBITDA 60%
Total Asset 67%
20
Total Liability 73%
• CAGR EBITDA > CAGR Sales
This means that the weight of operating charges in the total revenues decreased. • CAGR Assets > CAGR Sales
Asset turnover is decreasing overtime. This means that in order to increase the sales, the company has to increase its assets, via investment, in a higher scale.
• CAGR Equity < CAGR Liabilities
Growth of liabilities is higher than the growth of equity; therefore, the company is increasing its financial leverage overtime.
4.3.2 Operational Profitability Analysis
To understand the operational profitability of Alibaba, we analyzed the Return on Sales (ROS). The ROS ratio is used to evaluate the company's operational efficiency and how much profit is being produced per CNY of sales. Thus, the higher is this ratio the better the company's situation at the operational level. The ROS of Alibaba is high in the past five years. Though this rate declined in 2014, still is high.
Table 3: Ros of Alibaba
2012 2013 2014 2015 2016
ROS 30% 34% 51% 38% 39%
4.3.3 Liquidity risk
There are two main ratios used to analysis the liquidity level of a firm: current ratio and quick ratio.
Table 4: liquidity risk of Alibaba
21
Current Ratio 2.37 1.80 1.81 3.58
Quick Ratio 1.90 1.39 1.21 3.20
The current ratio establishes a relation between the current assets with the current liabilities. It indicates if the company will be able to meet its short-term obligations.
The quick ratio is more conservative approach than the current ratio, since it excludes the inventories from the current assets.
Alibaba has little debts compared to its assets; the current ratios and quick ratios in different fiscal year are over 1. It means Alibaba does not have much short-term liability burden.
4.4 Share performance analysis
The stock developed from the 19th September 2014 to 19th September 2016, priced from 57.39 dollar per share to 119.15 dollar. Though there are small ups and downs of the stock price, the overall trend is stable.
4.4.1 Share Price and returns
Graph 1: Alibaba’s daily share price
Table 5: share price of Alibaba at the beginning and end of the valuation $20.00 $40.00 $60.00 $80.00 $100.00 $120.00 $140.00 2 0 1 4 /9 /1 9 2 0 1 4 /1 1 /1 9 20 15 /1 /1 9 2 0 1 5 /3 /1 9 2 0 1 5 /5 /1 9 2 0 1 5 /7 /1 9 20 15 /9 /1 9 2 0 1 5 /1 1 /1 9 2 0 1 6 /1 /1 9 2 0 1 6 /3 /1 9 20 16 /5 /1 9 2 0 1 6 /7 /1 9 2 0 1 6 /9 /1 9
Alibaba's share price in dollar
22
S&P500 Alibaba
2014/9/19 share price 2010.40 93.89
2016/9/19 share price 2139.12 103.03
As we can see from the two figures below, Alibaba’s returns and stander deviation of daily returns are higher than the market (S&P500) to the year 2016.
Standard deviation measures the risk of a particular asset. In this case standard deviation of Alibaba’s daily returns is higher than that of the market measured by S&P500. It means that company’s shares are more risky than the market portfolio.
Table 6: Return and risk of Alibaba’s stock
S&P500 Alibaba Simply Returns 6.40% 9.73% Annual Returns 3.15% 4.75% Variance of return 0.01% 0.05% Standard deviation of return 0.94% 2.13% 4.4.2 Beta
Capital asset pricing model (CAPM) is model used to determine required rate of return of the share. The model is based on Beta, which represents sensitivity of share to the systematic risk.
23
ra3-rf =Beta * (rm4-rf) + Alpha
To estimate Beta of Alibaba, we did the regression of ra-rf and rm-rf from 19th September 2014 to 19th September 2016. We chose daily data for the estimation to get bigger set of data pool.
With the regression, beta and alpha was determined.
Graph 2: regression of ra-rf and rm-rf
ra-rf =1.036(rm-rf)+0.0008
Alpha (0.0008) represents the intercept of the regression line with the y axis.
Beta coefficient (1.036) expresses the slope of the line and it is a tendency how price of the share responds to the market. A beta of greater than 1 indicates that the security's price is theoretically more volatile than the market. Beta of Alibaba is 1.036; it's theoretically 3.6% more volatile than the market.
Table 7: regression data of Ra-Rf and Rm-Rf
Regression Statistics
3
Return of Alibaba
4
Return of S&P 500 (market return).
y = 1.0361x + 0.0002 R² = 0.2092 -10.00% -8.00% -6.00% -4.00% -2.00% 0.00% 2.00% 4.00% 6.00% 8.00% 10.00% -6.00% -4.00% -2.00% 0.00% 2.00% 4.00% 6.00%
Ra-Rf
Ra-Rf 线性 (Ra-Rf)24 Multiple R 0.457376641 R Square 0.209193391 Adjusted R Square 0.207614935 Standard Error 0.018940318 Observations 503
Coefficient of determination (R-square) is the measure of how well the regression line represents the data. If the regression line passes exactly through every point on the scatter plot, it would be able to explain all of the variation. The further the line is away from the points, the less it is able to explain. In the regression analysis above we see R-square= 0.2092, therefore the model explains only 20.92% of the data used.
Table 8: Coefficients and P value of the regression
Coefficients Standard Error t Stat P-value
Intercept 0.00 0.00 0.49 0.62
X Variable 1 1.04 0.09 11.51 0.00
The very important knowledge is whether our obtained results were statistically significant or not. The lower p-value is the less significant is the observed value. From the regression p- value for alpha is 0.62 and for the beta is 0. Therefore value for beta and alpha are not statistically significant, because the p-values are no higher than 5%. So model is not explicative enough.
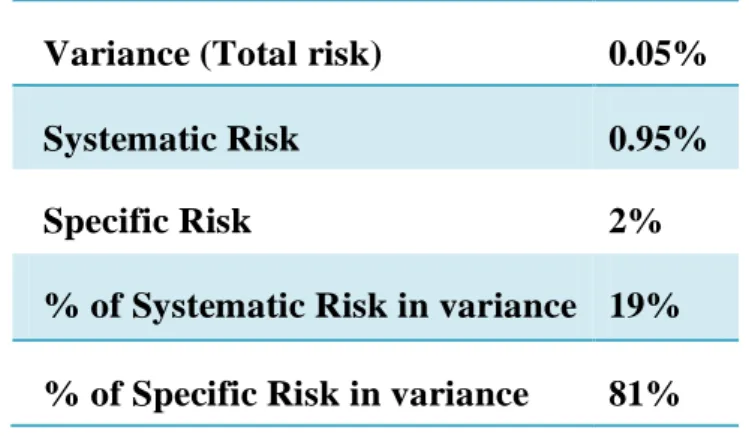
4.4.3 Decomposition of Total Risk
25 The systematic risk (caused by inflation, wars and economic cycles) is the market risk. It is also known as “diversifiable risk”, it affects the overall market. People cannot secure their investment by diversification. It’s computed as standard deviation of the market multiplied by beta from the regression analysis.
Systematic risk = Beta * Std. deviation market. (12)
Alibaba’s beta=1.036
Systematic risk= 1.036 * 0.94%= 0.95%
The specific risk reflects the risk of company. It can be reduced by diversification. It is possible to extract share of the specific risk from the total risk equation:
Total Risk= Systematic risk2 + Specific risk2. (13)
Specific risk=√ = 0.02
Total risk was computed as variance of Alibaba’s return. (STD2 ).
Specific risk = √ = 2%
Table 9: Decomposition of Total Risk of Alibaba’s share
Variance (Total risk) 0.05%
Systematic Risk 0.95%
Specific Risk 2%
% of Systematic Risk in variance 19%
% of Specific Risk in variance 81%
Total risk is represented by variance of Alibaba’s return (STD2). The company faces higher value of the specific risk. As showed by the result, risk exposure for the investor is mainly from the company. (81% of the total risk is from the Specific of the company)
26
5. Valuation
5.1 Discounted Cash-Flow Models
5.1.1 Assumptions of growth rate
The base years we choose are the fiscal year of Alibaba from 2012 to 2016 (12 month ending 31st March), 2017-2021 are the forecasted years. The standing point for the valuation is at 19th June of 2016. On this date, the central parity rate of Chinese Yuan and dollar is 6.6786. We assume the exchange rate is constant and is 6.7 in the future.
Table 10: Alibaba’s historic growth rate
2012 2013 2014 2015 2016
40.56% 41.99% 34.26% 31.10% 24.66%
In 5-year financial forecasting, Alibaba has a growth rate of 49.91% (CAGR) from 2017 to 2021. (Numbers in millions CNY)
Table 11: Alibaba’s CAGR
Revenue of 2012 20,025
Revenue of 2016 101,143
CAGR 49.91%
(Numbers in millions CNY, except CAGR)
We assume that Alibaba follows a two stage growing model. It will keep this growth rate until 2020. After 2020, it will grow at 5% forever (two stage model).
5.1.2 Applying Growth Rate
We assume the operating expenses, deprecation expenses, fixed asset, current liabilities and minority interests as percentage of sales, because they are more likely to vary with sales in that
27 year. Other items that are obviously not changing with sale, we either put average from 2012 to 2015 (if the item has obvious increasing in recent 2 years, we use the average of recent 2 years) or fixed number for them.
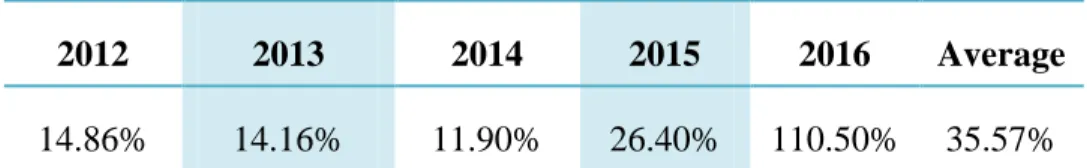
5.1.3 Taxes Rate
Tax rate is calculated by dividing tax expense by income before tax.
Table 12: Alibaba’s tax rate
2012 2013 2014 2015 2016 Average
14.86% 14.16% 11.90% 26.40% 110.50% 35.57%
We use the average tax rate 35.57% of base years as the forecasted tax rate.
5.1.4 Continuing operation
We assume the company will continue to operate for a long time (> 10 years).
5.1.5 Cost of debt
Table 13: Alibaba’s cost of debt
2012 2013 2014 2015 2016
Rd -- 122.53% 6.63% 6.70% 3.70%
The cost of debt in 2013 is too high that we treat it as outlier. We use the average of cost of debt from 2014 to 2016 as the estimated rd. The average is 5.7%.
5.1.6 Cost of equity
Cost of equity is calculated by CAPM model.
Table 14: risk free rate, beta, market rate and Alibaba’s cost of equity
Rf 1.94%5
5
28
Rm 6.35%
6
βL7 1.6
RE 9.48%
10-year Treasury bond rate on 31st December 2015 is applied as risk free rate.
5.1.7 WACC
WACC is calculated by:
WACC= Rd * (1-t) *
+
* RE. (14) Table 15: Alibaba’s Capital structure
Total Debt 57,771
Market value of Equity 1,317,149
(Numbers in millions CNY)
WACC=15.11%
5.1.8 FCFF
FCFF is a measure of financial performance that expresses the net amount of cash that is generated for the firm, consisting of expenses, taxes and changes in net working capital and investments.
FCFF=EBIT * (1-t) - change in IC. (15) Table 16: FCFF of Alibaba 2017 2018 2019 2020 2021 FCFF 23292 39494 59207 88759 113260 6 Source from:http://www.market-risk-premia.com/us.html 7
29 (Numbers in millions CNY)
A positive value of FCFF indicates that Alibaba has cash left after expenses. As all the FCFF are positive, that means Alibaba is able to pay its investment and create value.
Terminal Value n=
. (16)
(Considering 5% perpetual growth rate after 2020, g=5%)
Terminal value = 3,068,381 million CNY
Enterprise Value =∑
. (17)
Enterprise value= 2,363,094 million CNY
Market Value of common stock = EV- market value of preferred equity -market value of debt - minority interest + cash and investments
Total debt= the average of total debt from 2009 to 2012= 57771 million CNY Equity value = 2,388,467 million CNY
Equity per share= ¥957.11 (or $143.31)
And the form below showed the forecast of share price in a few years.
Table 17: Forecasted share price of Alibaba
2017 2018 2019 2020
$156.20 $170.03 $185.09 $201.50
5.1.9 Dividend Discount Model
As Alibaba does not give out dividend, we cannot value it with dividend discount model.
5.1.10 FCFE
Free cash flow for equity is a measure of how much cash can be paid to the equity shareholders of the company after all expenses, reinvestment and debt repayment.
30
FCFE=FCFF- FCFD. (18)
Free cash flow to debt is the cash paid for interest or debt. It is calculated by:
FCFD = Interest expense * (1-t) - △Debt. (19)
Table 18: Forecasted FCFE and FCFD of Alibaba
2017 2018 2019 2020 2021
FCFE 72070 86244 129292 193826 102698
FCFD -48778 -46750 -70084 -105066 10562 (Numbers in millions CNY)
PV of FCFE= 2,242,487 million CNY
Equity per share= ¥944.97 (or $141.49)
The result is similar with that of firm approach ($143.31 per share).
5.1.11 EVA and MVA
Economic Value Added is a measure of a company's financial performance based on the residual wealth calculated by deducting cost of capital from its operating profit (adjusted for taxes on a cash basis).
It is calculated by:
EVAn= EBITn (1-t)-WACC * ICn (boy). (20)
Table 19: EVA of Alibaba from 2016 to 2020
2016 2017 2018 2019 2020
EVA 32075 47687 71490 107173 110788
(Numbers in millions CNY)
Market value Added=∑
31 MVA =2,352,888 million CNY
A high MVA indicates Alibaba has created substantial wealth for the shareholders.
Enterprise value= MVA+ Invested Capital eoy = ¥2,363,094 million CNY
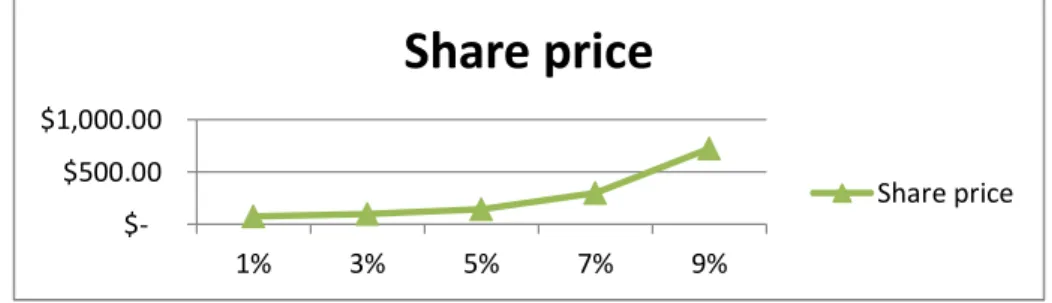
5.1.12 Sensitivity analysis
The most important assumption in the valuation for DCF model is the growth rate. Different growth will affect the true value of the share a lot.
Graph 3: Sensitivity of Alibaba’s share price with estimated perpetual growth rate
As we see from chart 9, the share price are very sensitive to the perpetual growth rate when g>6%. If Alibaba keeps a perpetual growth over 3%, the share price will be likely greater than the market price (around 80 dollar per share).
Table 20: sensitivity of Alibaba’s share price with perpetual growth rate
Perpetual growth rate Share price
1% $ 73.72 3% $ 96.29 5% $ 143.31 7% $ 301.55 9% $ 724.08 $500.00 $1,000.00 1% 3% 5% 7% 9%
Share price
Share price32 We also check the sensitivity of the share is to the growth rate within 5 years.
Graph 4: Sensitivity of Alibaba’s share price with CAGR in 5 years
Table 21: sensitivity of Alibaba’s share price with growth rate in 5 years
5 year growth share price (in dollar) 20% $61.63 30% $83.20 40% $110.24 50% $143.63 60% $184.28
The price is less sensitive to the growth in 5 years compared to the perpetual growth.
Besides, we notice that Alibaba is increasing its debt these years, so we also do sensitivity analysis of debt ratio.
Graph 5: Sensitivity of Alibaba’s share price with Debt ratio $0.00
$100.00 $200.00
20% 30% 40% 50% 60%
share price (in dollar)
share price (in dollar)
33 As Alibaba has lower cost of debt compared to its equity, the share price will increase with more leverage. Especially when the debt ratio is over 40%, the price will be more sensitive to it.
5.2 Relative valuation
Chinese financial analysts think that the veracity of DCF model relays too much on the estimation of growth rate. Therefore, they prefer to relative valuation.
PE valuation and PB valuation are the most popular valuation methods used in China, they has different focus. We will present the analysis of the two ratios and other ratios of Alibaba as well. As for the peer caparison, we do not use the traditional e-commerce giant Amazon as a peer because Alibaba has a different profit model. Considering Alibaba’s advertisement profit model, wide range of business scope and leader position in Chinese internet industry, Baidu (BIDU.US) and Tencent (00700.HK) are the most comparable.
Table 22: PE ratio, PB ratio and PEG ratio of Alibaba and its peers
Alibaba Baidu Tencent Industry Avg
PE Ratio 34.46 12.6 47.01 32.73
Price to Book Value 7.492 4.637 11.76 5.16
PEG Ratio 3.159 0.0798 1.695 7.548 $0.00 $100.00 $200.00 $300.00 $400.00 $500.00 6% 10% 15% 20% 30% 40% 50%
share price (in dollar)
share price (in dollar)
34 Price-Earnings ratio reflects the profitability of company in the further. High PE ratio shows that investors are more confident for the earnings growth; low PE ratio means that company value are not recognized by investors. Price to book value ratio focuses on the profitability of firm equity. Generally speaking, shares with low PB ratio are more worth to be invested.
Alibaba has higher PE and PB ratios than the industry average and its peer Baidu. That means investors are confident in investing on Alibaba now. On the other hand, it doesn’t show more investment potentials than its peer.
The PEG ratio is used to determine a stock's value while taking the company's earnings growth into account. It is more suitable to use PEG ratio to value a company with high growth, like Alibaba. Alibaba’s PEG ratio is lower than industry average, but higher than one of the main peers (Baidu). As the ratio is over 1, the shares are not undervalued.
5.3 Recommendation
Form :The share price was estimated by different approaches FCFF, FCFE, DDM and MVA.
Table 23: Alibaba’s proper share price calculated by different approaches
FCFF FCFE MVA
$143.31 $141.49 $143.31
According to the result of DCF models, Alibaba’s share is undervalued and will probably to have higher price in the future.
According to the result of relative valuation models, Alibaba is not undervalued compared to its peers.
As the main assumptions of the DCF models are conservative (5% perpetual growth), Alibaba’s share price is very likely to increase in the future. So this case gives a buy recommendation.
5.4 Main risks
35 C2C business growth is not as high as estimated, B2B business encounter greater pressers
from competitors
Cloud service and data service grows not as quick as estimated.
36
6. Conclusion
This case is a study on Alibaba Group Holding Limited. We applied various analyses to calculate the share value of the company, compared it with the market price and give a buy recommendation. The result of this case study has direct meaning for Alibaba’s potential investors. On the other hand, the methodology used in this case study may help financial professionals.
Though we are giving a buy recommendation after considering all the analysis, the result relies too much on proper estimation of growth. More researches need to be done in the future to find out the more suitable assumptions.
37
R
EFERENCESA-
P R E LIM IN AR Y IN D E X O F TH E TH E S ISA. Brav and P. A. Gompers.1997. Myth or Reality? The Long-Run Underperformance of Initial Public Offerings: Evidence from Venture and Nonventure Capital-Backed Companies. The Journal of Finance, 52.
D. P. Baron.1982. A Model of the Demand for Investment Banking Advising and Distribution Services for New Issues. The Journal of Finance, Vol. 37, No. 4 (Sep., 1982).
A. Damodaran.2008. Damodaran on Valuation: Security Analysis for Investment and Corporate Finance. WTECH
B. Espen Eckbo.2007. Handbook Of Empirical Corporate Finance Set. North Holland
R.G. Ibbotson.1975. Price performance of common stock new issues. Journal of Financial Economics Vol.2 issue 3, September 1975.
P. L. Karlis.2000. IPO Underpricing. The Park Place Economist Vol.VIII
H. E. Leland and D. H. Pyle.1977. Informational Asymmetries, Financial Structure. Journal of Finance, 1977, Vol. 32, issue 2
T. Loughran and J. R. Ritter.1995. The New Issues Puzzle. The Journal of Finance Vol. 50, No. 1 (Mar., 1995).
K. F. Rock.1986. Why new issues are underpriced. Journal of Financial Economics, Vol.15, issues 1–2, January–February 1986.
M. Willenborg.1999. Empirical Analysis of the Economic Demand for Auditing in the Initial Public Offerings Market. Journal of Accounting Research, Vol. 37, No. 1 (spring, 1999).
38
B-O
TH E RR
E FE R EN C E S http://alibabagroup.com http://www.investopedia.com http://www.iresearch.cn http://www.gurufocus.com http://www.market-risk-premia.com/us.html http://www.nasdaq.com/zh https://ycharts.com39
Appendix A: Forcasted Income statement of Alibaba
For the period ending 31/03 2017 2018 2019 2020 2021 Revenue 151627 227309 340768 510857 536400 Veriable&fixed charges 93611 140335 210381 315390 331159 EBITDA 58016 86975 130387 195467 205240 D&A Expense 6860 10285 15418 23114 24269 EBIT 51156 76690 114969 172353 180971 Financial expense(Gains) 7822 10294 13999 19554 19554 Interest Expense(net) 4952 7424 11129 16684 16684 Foreign Exchange Losses (Gains) 0 0 0 0 0 Net Non-Operating Losses (Gains) 2870 2870 2870 2870 2870 Income before tax 43334 66396 100969 152799 161417 Income Tax Expense 15412 23614 35910 54344 57408 Net income 27922 42782 65059 98456 104009 Extraordinary Loss Net of Tax
0.0 0.0 0.0 0.0 0.0
Minority Interests
787.61 1180.74 1770.08 2653.59 2786.27
40 income Abnormal Losses (Gains) -1156 -1156 -1156 -1156 -1156 Tax Effect on Abnormal Items 411 411 411 411 411 Normalized Income 26390 40857 62545 95058 100478 Total dividends 0 0 0 0 0 Total Cash Common Dividends 0 0 0 0 0 Cash Prefferred Dividends 0 0 0 0 0 Group Retained Earnings 26390 40857 62545 95058 100478