Dissertação
Mestrado em Engenharia Eletrotécnica
Subjective assessment of 3D still images using
attention models
Auridélia Moura de Arruda
Dissertação
Mestrado em Engenharia Eletrotécnica
Subjective assessment of 3D still images using
attention models
Auridélia Moura de Arruda
Dissertação de Mestrado realizada sob a orientação do Doutor Pedro António Amado Assunção, Professor Coordenador da Escola Superior de Tecnologia e Gestão do
Instituto Politécnico de Leiria.
Muda de vida se tu não vives satisfeito
Muda de vida, estás sempre a tempo de mudar
Muda de vida, não deves viver contrafeito
Muda de vida se há vida em ti a latejar
(“Muda de vida” – António Variações)
Abelha fazendo o mel vale o tempo que não voou.
(“Amor de índio” – Milton Nascimento)
Quanto a vós, não vos façais chamar de 'rabi', pois um
só é vosso Mestre e todos vós sois irmãos.
(Mt 23, 10)
Dedicated to Maria Amélia de Arruda
(in memorian).
Acknowledgments
To God, the Triune, Creator, Saviour and Sanctifier, and Virgin Mary, the venerable track, cosy cradle, source of strength and peace.
To my parents, Mariedna and João Alberto, main counsellors and disciplinarians, source of all that makes me truly human. Best representativeness of love. “To educate is not to cut the wings, but to guide the flight”. To my brother, João Alberto, and my sister, Maridélia, essentials in every growth of mine. To her and her husband, Igor, who gave me a couple of beloved nephews, Catherine and Dimitri, certainties of a blessed future. To my dear colleague João F. M. Carreira, who kindly volunteered to assist me with everything about he was available to, at every time I needed during the execution of this work, especially in the very early parts.
To Prof. Dr. Pedro A. A. Assunção, by his dedication to this beautiful career and to those who benefit from it. Also to Instituto de Telecomunicações for providing the logistics, technical equipment and scientific support for this research.
To my colleague and friends Nelson C. Francisco, Mrs Lúcia P. Carreira and Mr. Isidro de J. Francisco, who so lovingly treat me, even since before arriving in Portugal.
To my friends Larissa Fumiga Leite, Eliamara da Silva, Diana Rodrigues, Sandra Santos, Marycota Machado, Bruno Rebelo, Sofia Gualdino, Silene and Sylvain Marcelino; the Silva, the Ferreira and the Affonso families; the spectacular CHIC Woman’s Health group and friends; my great job leaders Rita Lucas and José Leal, the fantastics YBRIK team and KIRBY® Company; the colleagues Gilberto Jorge, Marlene Machado, Luis Pinto, Luis Lucas, Ricardo Monteiro, Filipe Xavier; the invaluable IPL employee Lucinda Carreira; Prof. Dr. Sérgio M. M. de Faria; and other friends, colleagues and teachers who contributed in each aspect of the implementation of this work. Since the beginning, far or near.
iii
Resumo
O sistema visual humano (HVS) conjugado com o processo de atenção visual tipifica rapidamente partes notáveis em cenas visuais, que subjetivamente definem regiões de interesse (ROI). Os mecanismos subjetivos dominam os movimentos dos olhos nos dois primeiros segundos de visualização e, tendo em consideração a relação entre os movimentos dos olhos e a atenção visual, o registo dos movimentos oculares permite obter dados experimentais para definir modelos de atenção 2D: os movimentos oculares registrados e processados são expressos como um Mapa de Densidade da Fixação (FDM). No domínio 3D, é necessário considerar parâmetros adicionais de dimensão visual, como sejam as diferentes profundidades dos objetos da cena, na definição de ROI com base na atenção visual
O principal objetivo deste trabalho foi verificar o impacto de ROIs definidas com modelos de atenção visual, na percepção da qualidade subjetiva de imagens 3D estáticas. Foi usada a base de dados de imagens e dados de fixação do olhar 3DGaze, obtida a partir de um teste de rastreamento ocular descrito em [1], criada para a avaliação de modelos de atenção visual de imagens estereoscópicas 3D fixas. Esta base de dados foi escolhido para ser usada devido à informação estar disponível, com imagens originais de vários tamanhos HD, todas em formato PNG e com conteúdo natural. Foram geradas máscaras binárias para cada FDM e a cada imagem correspondente foi adicionado ruído considerando as fronteiras das ROIs para diferenciar a intensidade de ruído. Usando as posições dos pixels da máscara binária e da imagem, o ruído foi adicionado à imagem nos pixels posicionados dentro ou fora da ROI, conforme os casos. No testes subjetivos os observadores registaram a sua apreciação sobre a qualidade das imagens, verificando assim a diferente importância que a localização do ruído na ROI tem na avaliação subjetiva da qualidade das imagens. As imagens foram classificadas em imagens com ruído adicionado dentro ou fora da ROI, de acordo com o tipo de ruído (Gaussian, Speckle), valores dos parâmetros do ruído (nível de intensidade) e a vista da imagem ruidosa (esquerda ou direita).
Verificou-se que o ruído Gaussian teve menos impacto na qualidade do que o Speckle, bem como o nível de intensidade, que se torna mais importante quando o ruído é introduzido na vista direita e quando o está dentro da ROI. Isso é justificado devido aos visualizadores terem fixado seus olhos sobre aquela região durante mais tempo, tornando-se maior a distorção percecionada. Como o espectro de análitornando-se foi pequeno, as informações acerca do olho dominante parecem ser inconclusivas. A alteração dos parâmetros é sugerida para trabalhos futuros, de tal modo que haja mais certeza sobre os resultados alcançados, sem interferências entre análises. Como este trabalho foi limitado aos dados contidos nas imagens disponíveis (interesse visual do tipo bottom-up), alguns conceitos relacionados ao contexto da visualização (interesse visual do tipo top-down), como a raridade ou surpresa, podem naturalmente ser incluídos em trabalhos futuros, bem como a característica de se olhar principalmente para rostos humanos ou coisas humanóides.
Palavras-Chave: Modelo de Atenção, bottom-up, profundidade, eye tracking, FDM, ROI, still images, VA
v
Abstract
The subjective process associated with image quality evaluation is endorsed by human psychophysical and physiological measurements. In the human visual system (HVS), the visual attention (VA) is a crucial element, which quickly identifies the notable regions of the images, subjectively linked to Regions of Interest (ROI). These are represented by a binary mask, indicating whether a pixel in the corresponding image belongs to the ROI. Subjective mechanisms dominate eye movements in the first two seconds of viewing and, due to the high relation between the eye actions and the VA, eye-tracking tests are used to validate 2D attention models: eye movements are recorded and processed to generate a Fixation Density Map (FDM). In the 3D domain, an essential factor for VA among the additional parameters of visual dimension is the scene depth.
The main objective of this work was to study the impact of a particular ROI on the subjective quality perception of 3D still images, considering different types and level of noise (or distortion) in and out of the ROI. The 3DGaze images and eye movement database, obtained from an eye tracking experiment described in [1] and specifically created for performance evaluation of stereoscopic 3D attention models was used. Besides the full public availability, this database has original images in various HD sizes, all in PNG format and with natural content.
Binary masks were generated for each FDM and different types and intensities of noise was added to each corresponding image according to the ROIs. By using the generated binary masks and image pixels positions in the ROI, the noise was added in the image regions located inside or outside the ROI. Subjective testing with users observing the images and scoring their quality was done to verify the importance of these regions in the subjective quality evaluation. The images were classified according to whether the noise was added inside or outside the ROI, the noise type (Gaussian, Speckle), parameter values (intensity level) and the noisy image view (left or right).
The results have shown that Gaussian noise has less impact on the quality than Speckle, with higher intensity level and also when the noise is added to the right view and inside the ROI. This is justified due to the fact that viewers fix their eyes over the ROI during more time, thus perceiving higher distortion. As the amount of different image content was small, the information about the dominant eye appears to be inconclusive. Changing some parameters is suggested for future works, in such a way that there is more certainty on the results without interferences between analyses. As this work was limited to data contained in the image (bottom-up visual interest), some concepts related to the visualization context (top-down visual interest), such as rarity or surprise, may naturally be included in future works, as well as the characteristic of looking primarily for human faces or humanoid things.
vii
Figures
FIGURE 1.1: ROI APPLICATION ON NEUROIMAGING: MRI, PET AND THE OBTAINED MASK [15]. ... 3 FIGURE 2.1: STIMULUS PRESENTATION IN THE ACR METHOD [40]. ... 19 FIGURE 2.2: COMPARISON TABLE IN DSCS METHODS [17]. ... 20 FIGURE 2.3: DSIS METHOD STRUCTURE: (A) VARIANT I, (B) VARIANT II (C) PATTERN
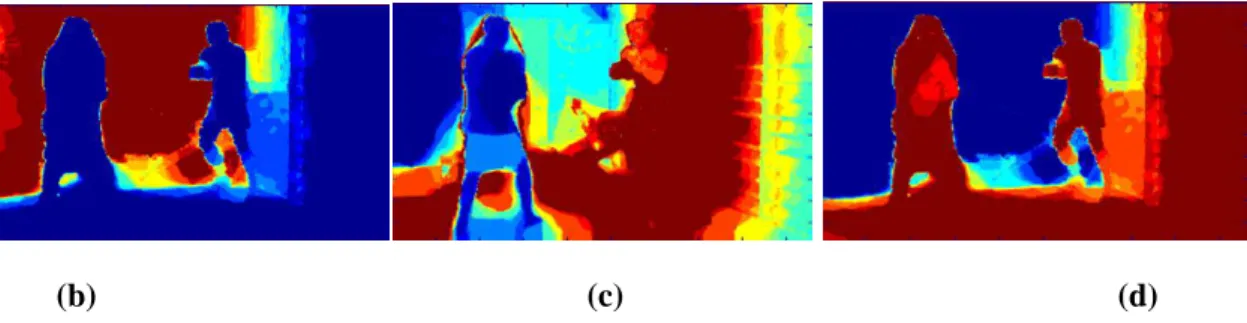
FOR THE STIMULUS PRESENTATION [40] [17]. ... 23 FIGURE 2.4: RATING SCALES OF DSCQS AND DSIS [16]. ... 26 FIGURE 2.5: COMPARISON BETWEEN METHODS. ... 28 FIGURE 2.6: COMMONLY USED SUBJECTIVE TEST METHODS [10]. ... 29 FIGURE 3.1: A 2D COMPUTATIONAL MODEL OF ATTENTION [11]. ... 31 FIGURE 3.2: RESPECTIVE SCHEMES OF THE DEPTH-WEIGHTING AND DEPTH-SALIENCY VA MODELS [21]. ... 32 FIGURE 3.3: RESPECTIVELY BOXING IMAGE: (A) LEFT VIEW, (B) RIGHT VIEW, (C)
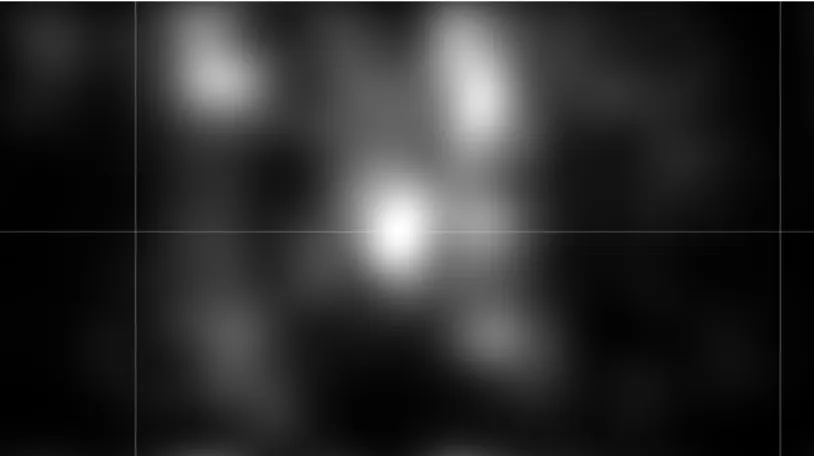
DISPARITY MAP, (D) DEPTH MAP, AND (E) FDM. ... 37 FIGURE 4.1: (A) 3DGAZE DATABASE BOXING IMAGE LEFT SIDE BRIGHTNESS; (B), (C)
AND (D) RESPECTIVELY, ITS B, G AND R COMPONENTS. ... 42 FIGURE 4.2: IMAGES NAMES AND RESPECTIVE ORIGINAL SIZES. ... 42 FIGURE 4.3: FIXATION DENSITY MAP (FDM) OF THE BOXING IMAGE. ... 43 FIGURE 4.4: THE MASKS OF LEFT BOXING IMAGE: MASK128, MASK170 AND MASK100,
RESPECTIVELY. ... 43 FIGURE 4.5: THE LEFT AND RIGHT BOXING IMAGES, EACH ONE OVERLAPPED BY ITS
CORRESPONDENT MASK100. ... 44 FIGURE 4.6: NOISES PARAMETERS: VARIABLE 1 ARE THE GAUSSIAN MEAN AND THE
SPECKLE MULTIPLICATIVE VALUES; VARIABLE 2 IR THE GAUSSIAN VARIANCE VALUE. ... 45 FIGURE 4.7: EXAMPLES OF NONROI AND ROI NOISY IMAGES ... 46 FIGURE 4.8: STILL IMAGES GENERATED. ... 51 FIGURE 4.9: STILL IMAGES FOR TESTS, USED ON THE EXAMPLE SHOWN TO THE
EVALUATORS (4T AND 13T). ... 53 FIGURE 4.10: ORDERED LIST OF SUBJECTIVE ANALYSIS SEQUENCES APPLIED... 53 FIGURE 5.1: ANALYSIS SEQUENCES SUBJECTIVE RESULTS. ... 58 FIGURE 5.2: NOISE PARAMETER RESULTS. ... 58 FIGURE 5.3: VIEWS PARAMETER RESULTS. ... 59 FIGURE 5.4: ROI PARAMETER RESULTS. ... 59
ix
FIGURE 5.5: LEVEL PARAMETER RESULTS. ... 60 FIGURE 9.1: SOURCE DESCRIPTION [1]. ... 75
xi
Acronyms
ACR
Absolute Category Rating, 17, 18, 19, 22, 23, 27, 28, 52 DCR
Degradation Category Rating, 22, 23 DCT
Discrete Cosine Transform, 10, 11 DMOS
Differential or Degraded Mean Opinion Score, 16, 23 DS
Double Stimulus, 19, 22, 26, 27, 54 DSCQS
Double Stimulus Continuous Quality Scale, 17, 22, 24, 25, 26, 27, 28, 29 DSCS
Double Stimulus Comparison Scale, 20, 21, 27 DSIS
Double Stimulus Impairment Scale, 17, 22, 23, 24, 25, 26, 27, 28 DWT
Discrete Wavelet Transform, 3 FDM
Fixation Density Map, iii, iv, vi, 5, 13, 37, 38, 41, 43, 44, 54, 57, 61, 73 FR
Fully Referenced, 10, 11, 13 HDTV
High Definition Television, 10, 11 HVS
Human Visual System, iii, vi, 1, 2, 4, 5, 6, 7, 10, 13, 15, 22, 32, 33, 35, 54 ITU
International Telecommunications Union, 9, 11, 15, 17, 20, 21, 52 ITU-R
Radiocommunication Sector of the International Telecommunications Union, 17, 19, 21, 26
ITU-T
Telecommunication Standardization Sector of the International Telecommunications Union, 26
MOS
Mean Opinion Score, 16, 18, 19, 23, 26, 52, 59 MPEG
Moving Picture Experts Group standard, 10 MRI
Magnetic Resonance Imaging, 3, 4 MSE
Mean Squared Error, 10 MUSHRA
Multiple Stimuli with Hidden Reference and Anchor, 26 NR
Non referenced, 10, 11, 13 OCR
Optical Character Recognition, 3 PET
Positron Emission Tomography, 3, 4 PSNR
Peak Signal to Noise Ratio, 10 PVS
Processed Video Sequence, 2, 7, 15, 16, 19, 22, 23, 24, 25, 26 ROI
Region of interest, iii, iv, vi, 2, 3, 4, 5, 12, 13, 33, 41, 44, 46, 51, 54, 57, 58, 59, 60, 61 RR
Reduced referenced, 10, 11, 13 SAMVIQ
Subjective Assessment Methodology for Video Quality, 17, 25, 26, 27, 28, 29 SC
Stimulus Comparison, 17, 18, 20, 21, 22, 27, 29, 61 SDSCE
Simultaneous Double Stimulus for Continuous Evaluation, 17, 22, 27, 28 SDTV
xiii
Standard Definition Television, 10, 11 SRC
Source Reference Circuit, 2, 3, 7, 10, 11, 12, 15, 16, 17, 18, 19, 22, 23, 24, 25, 26, 27, 29, 44, 46, 73, 75
SS
Single Stimulus, 17, 18, 20, 21, 22, 25, 26, 27, 61 SSCQE
Single Stimulus Continuous Quality Evaluation, 17, 19, 20, 24, 27, 28, 29 SSMR
Single Stimulus with Multiple Repetitions, 17 SSNCS
Single Stimulus Numerical Categorical Scale, 21, 24 VA
Visual attention, iv, vi, 2, 4, 12, 13, 31, 32, 33, 34, 35, 36, 38, 39, 73 VQEG
Video Quality Experts Group of the Telecommunication Standardization Sector of International Telecommunications Union, 11
xv
Summary
ACKNOWLEDGMENTS ... I RESUMO ... III ABSTRACT ... VI FIGURES ...VIII ACRONYMS ... XI SUMMARY ... XV 1. INTRODUCTION... 11.1. CONTEXT AND MOTIVATION ... 5
1.1.1. Factors that affect 3D quality perception... 6
1.2. OBJECTIVES... 13 1.3. OUTLINE ... 13
2. LITERATURE REVIEW ... 15
2.1. VIDEO SUBJECTIVE EVALUATION METHODOLOGIES ... 15
3. ATTENTION MODELS FOR 3D VIDEO ... 31 4. EXPERIMENTAL EVALUATION ... 41
4.1. OBJECTIVE MEASUREMENTS ... 41 4.2. SUBJECTIVE VALIDATION OF ATTENTION MODELS ... 51
5. RESULTS - DISCUSSION ... 57 6. CONCLUSION ... 61 7. REFERENCES ... 63 8. APPENDIX ... 69
8.1. INSTRUCTIONS TO THE PARTICIPANTS ... 69
9. ANNEX ... 73
9.1. 3DGAZE: AN EYE TRACKING ON 3D IMAGES DATABASE ... 73 9.2. DISPLAY SPECIFICATIONS ... 75
1
1.
Introduction
For quality optimization it is important to precisely define the concept of quality, to ensure modelling efficiency and user satisfaction when such models are used to guarantee quality of experience (QoE). Most video quality metrics are chosen according to studies in medical areas addressing the Human Visual System (HVS) and its descriptions: based on human perception of the scenes, trying to model the human sensory system, but just in parts, because the recreated 3D visuo-sensory experience is not completely acessible. Measuring quality perception is complex, then, due to the need of selecting those parameters that better represent the entire HVS, combinations of algorithm-extracted features that summarize the perceptually most relevant stimuli through its individualities are used, covering the whole context of video consumption experience [2] [3] [4].
Choosing the features to be extracted needs their perceptual weighting and interdependencies modelling and the effects between them being masked. Also several factors can affect the results, such as distortions introduced in each algorithm processing step, influencing the viewer experience and turning it difficult to obtain a completely accurate calculus of video visual fidelity. For 3D video, in general only the left and right image views and the associated depth or disparity pixels map are processed and approximations validate them, turning it even less faithful to reality (though generally reasonable). 3D quality measurement is even more useful than 2D to reach better performance and user acceptance in emerging services and applications (considering human capabilities to distinguish and classify images) [3] [4].
Quality assessment studies have vast relevance on multimedia systems, where subjective evaluation protocols and processes and objective metrics for multi modal content are crucial: the interaction of audio and speech with video and haptic data, influence of user background, attention, motivation, task, and subjective as well as objective metrics for interactive applications [5] [6].
Objective quality quantitative measurements are usually applied on different stages in the transmission chain, such as compression and processing systems, aiming overcome huge obstacles faced in subjective quality measurement, such as complexity and cost. Furthermore, to monitor hundreds of video channels, for long periods of time, objective video quality metrics are the only practicable solution, with algorithms calculating
values that represent the combinations of different factors on the network [7] [8] [9] [10].
Beyond the term “quality” being defined (as also as the calculus), it is also essential to clarify the vocabulary applied for the material in use. The frames (or set of them) used as reference video source are also called Source Reference Circuit (SRC), unprocessed, unimpaired or original images, and those to be compared with the SRC are commonly a distorted version of them, being often referred as Processed Video Sequence (PVS). Most perceptual image quality assessment approaches proposed in the literature attempt to weight different aspects of the error signal (difference between PVS and SRC) according to their visibility, as concluded by psychophysical measurements in humans or physiological measurements in animals, what not necessarily is the basis, but it is what inevitably determines the success of every method.
Visual attention (VA) is the biological vision ability to rapidly detect the interesting parts of a given scene. It is usually used in a preprocessing step in computer vision systems, by selecting features that represent conspicuous parts of the scene (available sensory information), reducing the computation cost of high level tasks (such as segmentation and object recognition). Psychophysical studies show that it plays a fundamental role in human vision. At HVS, VA guides eye movements to place the fovea (a high central resolution part of the retina) on the interesting part of the scene, where is then processed [11].
Image processing may be done from cleaning up to alter, from defining a Region Of Interest (ROI) to filtering and spatial manipulation. A VA portion of an image usually subjectively associated to a ROI. Specifying a ROI allows for the definition of shaped regions within a given image, often called subimages defined by a placeholder that bounds a location within an image. The ROI representation can be static (defined during encoding), or dynamic (set by the user during a progressive transmission) and it need to have priority on transmition. Every point of an image is either inside or outside of a given ROI, which may be represented as an amount of points and lines, or as single pixels width (square, the simplest two dimensional ROI contour, with a selected region with four equal sides, useful to return single value data about a region of the image, like intensity, colour data, etc; or rectangle, the most popular two dimensional ROI contour, with more flexibility in defining the required region), returning one-dimensional information. However, setting the corners is not enough to fully define a ROI, as it contains several other attributes [12] [13].
3
The regions that composes the ROI can be geographic in nature (such as polygons encompassing contiguous pixels: with irregular shapes, rectangles or squares, circles, annuluses, polygons, rotated rectangle, annulus arc, or even with freehand shapes), or defined by a range of intensities (not necessarily contiguous pixels: the intensity contours following the outer shape of the ROI, starting at the first defined point, for example). A geographic ROI representation is defined by creating a binary mask, a binary image with the same size of the SRC (pixels set to 0 or 1, relative to it defining the ROI or not) and that can be associated with a particular image, without having an associated image, or it may also not require an input image [12] [13] [14].
ROI application is useful when certain parts of the image are more important or should have higher encoding quality than the background or less interesting regions. Dynamic ROI definition is useful in inspection routines, where the user can pan and zoom a source image to locate features, in image processing routines or being defined around the alphanumeric characters, to make it much simpler and faster for an Optical Character Recognition (OCR) routine to decode. Fields of computer vision that can benefit from this task are industrial quality control, surveillance or autonomous mobile systems [12] [13].
Figure 1.1: ROI application on neuroimaging: MRI, PET and the obtained mask [15].
The JPEG-2000 standard does ROI tagging: standard partitions of the original image (independently compressed blocks, treated like distinct images), have their DC levels passed through a Discrete Wavelet Transform (DWT). ROI is applied in the edge regions: they are encoded separately by different bit planes, and at the decoder, to avoid artifacts along the borders, the map of disparities are encoded in parts, using a ROI. Drawing a ROI is also useful on medical neuroimage processes to examine the morphological properties of an anatomic structure and to extract information for a specific structure from a corresponding functional data set, through defining a specific
shape. In Figure 1.1 there is a ROI drawn on a Magnetic Resonance Imaging1 (MRI) image, the ROI is superimposed onto a Positron Emission Tomography (PET) image (not used at all in the drawing process, as the ROI define pixels from a homogenous region, named caudate, difficult to discern in the PET image) and its mask (pixels each have a value of 1 or 0, consonant belonging to the caudate or background) [11] [15]. The visual importance is a top-down visual representation (related to the context), specified by an object-level map in which the objects are rated according to a subjective relevance (content usability, user behaviour and needs, appropriateness, context, object recognition, artistic intent), by comparison of image objects (including the subjective background). Still supplementary subjective measurements are necessary, since quantifying visual quality via objective criteria gives accurate and repeatable results, but none objective system completely reproduces the subjective experience [8] [16] [17]. Approaches based on visual salience are used to detect the ROI from a perceptual viewpoint not related to the user opinion (bottom-up). Visual gaze patterns are, at least for early gaze locations, driven by bottom-up, signal-based attributes (saliency-driven, fast and independent of particular viewing tasks) and saliency (standing out in terms of one or more attributes, commonly contrast or colour) is an aspect which correlates with those locations. Visual saliency aims to compute a saliency map showing points that usualy are local maxima or minima of the image informative function. In video data this also includes the temporal characteristics. The link between visual salience and visual importance is strongest in the first two seconds of the observation interval, when top-down mechanisms dominate eye movements (saliency maps created from early gaze samples have more reliable values, as minus less bottom-up mechanisms are considered to be at work in eyes movements, being stronger the prediction for the early fixations or primary ROI) [15] [18].
The recognition of the main subjects in a scene (the vast majority of early gaze position samples, the gist of the scene) might be achieved in HVS via neurons interactions, providing psychophysical evidence that lends support to a gist-based strategy and a possible role for the feedback connections prevalent in mammalian visual systems. Due to the strong relation between eye movements and VA, the validation of VA computational objective models is done through eye tracking experiments: eye movements are recorded, post-processed and are represented as successions of fixations
1 MRI is a medical imaging technique used in radiology to investigate the anatomy and function of the body
5
and saccades or as a Fixation Density Map (FDM), which identifies the local fixed by the viewers [15] [18].
Algorithms that search for visual degradations often rely on HVS parts. Human perception motivates handling horizontal or vertical structures in an image differently from diagonal edges, and errors at the edges are perceived to be less disturbing than errors in the middle of the picture. The vision modelling approach of picture metrics applies thus the possibility to base the complete design of an algorithm on the human brain simulation, aiming to process the visual data by simulating the visual pathway of the eye-brain system [19] [10] [20].
1.1.
Context and motivation
In the computational model of stereoscopic visual saliency portraied in [21], the authors have further analysed each parameter, trying not to use generalizations and to be accurate about factors that are customarily largely overlooked in similar models. The images and FDMs generated and employed on that work were choosen to be used in this work due to their characteristics and the information known about them, besides their full public availability (as 3DGaze database, depicted in 9.1). The images were of different sizes (the same height, 1080, but different widths: 1278, 1191, 1282, 1279, 1228, 1274, 1286, 1194, 1247, 1192, 1920), all in PNG2 format, with natural content, synthetic stimuli and a background and some identical objects deliberately displayed at different depth planes. The limitation to models that compute saliency maps representing the level of bottom-up visual interest applied on that work was also valid here. Notwithstanding being considered bottom-up models, some top-down concepts, such as rarity or surprise may naturally be included, as well as the human characteristic of looking primarily for human faces or humanoid things.
This work aimed to examine the quality of images from their respective presented ROIs (defined through binary masks generated from the FDMs). Noise was added to these regions or outside them, so that viewers witnessed their appreciation of the variation in
2
PNG (Portable Network Graphics) is a patent-free file format for image lossless compression aimed to replace the Unisys© GIF (Graphics Interchange Format). An image in a PNG file can be 10 to 30% more compressed than in GIF format and its image interlacing is faster in developing. It is not possible to make one colour transparent, but to control the degree of transparency (opacity) and there is the possibility of correcting gamma, tuning the image in colour brightness along with display requirements. PNG images can be saved using true colour in addition to the palette and gray-scale formats provided by the GIF, but it can not contain multiple images, not supporting animation, thus [63].
the images quality, thus being noticed the importance of these regions in the subjective analysis of their images.
1.1.1.
Factors that affect 3D quality perception
Video systems consist on many components, from the signal acquisition (capturing real frames or generating a virtual scene) to its displaying. This includes converters, codecs, networks, the environment hardware, the signal processing and transmission path, each of them affecting the signal quality perception. Despite the higher complexity, huge bitrate and propensity to perceptual degradations in comparison to analogic, digital signals have higher robustness to noise and interference, efficiency on the encoded signal regeneration, privacy on the information transit, accuracy, and compatibility with digital transmission and media (uniformity in the format of video, audio or data services) [5] [19] [7].
A complex interaction between the HVS components involving the eye and the brain generates the Human perception of a visual scene, which is influenced by spatial fidelity (distinct distortions on parts of the scene) and temporal fidelity (motion’ natural-ness and smoothness). Temporal HVS mechanisms can be the source of performance loss, like the number of temporal channels and the models simplicity on describing the HVS motion processing. To quantify errors visibility, some metrics simulate functional properties of early stages of the HVS based on linear or quasilinear operators (using restricted and simplistic stimuli), relying on a large number of assumptions and generalizations. Psychophysical experiments are usually conducted by characterizing some phenomena as superpositions of a few different relatively simple patterns (such as spots, bars, or sinusoidal gratings), much simpler and with less interactions than those in real world images. Thus, inaccurate modelling of the HVS may occur, as some neurons activities which play important role in motion perception are commonly ignored. A limited number of experiments are applied to build models that aim to predict the visual quality of complex-structured natural images [8] [19] [4].
Images digital representation can be converted into physical properties (for example, brightness measured in candela per square meter), but optics and physical structures of the eye and retina usually are not modelled, because the image scanning done by the eyes make it difficult to predict which part of the image is centred on the fovea. Absolute brightness is not very meaningful, as in relation to colour it is not linearly
7
detected by the HVS (according to its sensitivity peaks in the green-yellow colours, green is brighter, much more clearly seen than blue, while the saturated blue is too dark, almost without contributing to the perceived brightness), so the wide used term Luminance indicates the brightness properly adjusted to what the HVS really sees [19] [7] [10] [22].
Important image effects need to be selected according to the system purpose, as the others are difficult to quantify, not well understood or not essential to the application. It is usual that objective metrics quantize the image dealing with sharpness and colourfulness, attractive characteristics to the viewers (together with well-lit and high contrast), in opposition to pictures with low contrasts, blurred or dark. Even though there are spatiotemporal artefacts, some quality metrics ignore temporal distortions in videos like ghosting (static pixels surrounding moving objects move in the PVS due to temporal low-pass filtering), jitter (variable delay), motion compensation mismatch (background pixels that are static in the SRC but move with the objects in the PVS due to block motion estimation), smearing (such as blur, caused by the relative motion between camera and scene objects), mosquito noise, rods (elongated artefacts like light-rods produced by cameras, which appear in film because of an optical illusion/collusion and are typically traces of a flying insect's wingbeats) and stationary area fluctuations (visual appearance of motion created from temporal frequencies in the PVS not present in the SRC) [7] [23]. The 3D content capture can be done by using single or multi camera techniques3, holographic devices, pattern projection techniques or time-of-flight techniques and its representation can be dense depth, surface-based, point-based, volumetric, texture mapping, pseudo-3D, light field or object-based. Some of them are internationally standardized, as also as the coding, compression and streaming processes [24].
An ideal camera aperture is described as a point, without lenses to focus light (i.e. no geometric distortions or blurring of unfocused objects) and real cameras characteristics have only discrete image coordinates. The internal and external camera parameters, the 3D scene structure and the relation between them also influence the signal quality. To achieve better ratios on coding or compressing, similarities between video frames or
3 An example of multi-camera application was developed by Immersive Media: Telemmersion System®
provides an end-to-end solution for full motion interactive 360° videos on the workflow stages from capture till distribution, including edition; the Dodeca® 2360 camera system (used on the online mapping industry by Google© on its Street View) captures high-resolution video from every direction simultaneously, supports various video formats and is highly portable [61].
image blocks can be used, but only considering the pixels located at the same correspondent position in the video frames (the mismatch between stereo correspondences), what may conduce to flickering depth perception or visual fatigue: a vertical disparity correction thus calibrates the left and right image planes of the video sensors, rectifying the stereoscopic videos [25].
Besides the shooting conditions (such as lens focal length and camera separation or convergence angle), 3D effects also depend on the system resolution. Beyond those that occur in monoscopic television systems (resolution, picture motion, depth, sharpness), there are also the puppet theatre effect (distorted objects angular retinal size and perceived distance and people looking like animated puppets), the depth resolution (spatial resolution in depth direction), the depth motion (related to the movement smooth play in depth direction) and the cardboard effect (objects seen disjoined or flat as if the scene were divided into discrete depth planes, due to a crude quantization of depth values). Puppet theatre effect is avoided or reduced through orthostereoscopic parallel shooting and display conditions (simulating human viewing angles, enlargement and convergence) or auto-stereoscopic displays that enable a large volume of depth, allowing larger images to be presented at a greater distance behind the screen. Cardboard effect can be avoided or reduced with camera parameters adjustments such that the thickness of objects can be perceived [26] [20].
In auto-stereoscopic displays (lenticular, barrier, etc), the major peculiar factors are frame effect (pictures appear unnatural when objects approach the screen frame: a larger screen is useful then, as viewers become less conscious of the frame) and inconsistency between accommodation (focus point fixed on the screen and pictures displayed within this range) and convergence (image defocusing controlled through the gaze point, minimum value for depth of field). Discrepancies between focus and convergence cause sickness after a few minutes. In auto-stereoscopic displays, 3D effect must be thought since the images creation (sets of images interlaced together, resulting on blurred and double image for a common screen), the lenses must direct the light so that each eye of the viewer sees only one image (and the brain overlaps it to create depth effect, interpreting the 3D scene), the equipment is expensive and depends on the physical position of the audience in few specific spots to have the sense of depth, not seeing both views unmerged. Cameras that track the viewer position avoid sweet spots and the restriction of having a single viewer per evaluation [27] [28].
9
The distance betweeen each eye is nearly the same among each layer in a glass, thus the eye wear based equipment (stereoscopic) are other specific outfit to display and view 3D video: passive and active glasses synchronized with the monitor. Passive glasses (anaglyph, with polarized lenses) do not use batteries or any electronics, becoming lighter, more comfortable and cheap. The cheapest ones, anaglyph (shutter, with liquid crystal lenses), use a simple technique of generating 3D: two coloured layers are observed through the glasses filter lenses (each eye sees one image layer, usually cyan for the right and red for the left). Glasses with polarized lenses use the light polarization that reaches each eye, the display has a specific configuration (overlapping images subject to mutually orthogonal polarizations filters) and linearly polarized filters are needed to the lenses, orthogonally and with the same orientation of the display filters. Both systems allow multiple simultaneous viewers. The crystal liquid or active glasses need a display with a 120 frames/sec rate: associated with the playback equipment (commonly a computer), the are synchronized glasses can work via wireless technology and, while the display merges the frames, the issuer ensures that each sunglass lens is only open to receive information during the display of one view frame. To avoid the flickering effect since each lens operates at half of the visualization frequency, the display reproduce frames at a fairly high frequency, leading to the equipment high cost [29].
Samsung© frequently use shutter technology in 3D televisions and the 3D passive glasses with polarized lenses of their UE40ES6300 have are said to have a crosstalking problem (images for the left and right eyes overlapping) due to the user position, what leads to the single viewer problem. The distance from the screen is also a problem, as the display is most comfortable at around a metre, with 3D visible from 90 cm to 120 cm back from the screen. A digital palindromic (or forward and back sequence) display method is applied to medical purposes, improving visual detection of low-contrast luminal morphological feature for coronary artery diseases analysis. The stabilization of a coronary segment is reached by digitally shifting each image and the sequence so that a point of interest remains in one position with respect to the observer [30] [31].
Seeking to standardize subjective assessments environment, the ITU defined parameters of general viewing conditions in both lab and home environments, arranged into ratios of luminance, observation angle, background chromaticity and other room illumination and monitor relevant characteristics (like resolution threshold with luminance and contrast, also strongly influenced by the environment luminance). It is also recommended the importance
on results stability of the input signal quality, its source type, still pictures picture by picture adjustment, the downstream processing, the impairments recording accumulated along the chain, and that, for both SDTV and HDTV, the viewing distance and the screen sizes should be selected to satisfy the ratio of viewing distance and picture height (the preferred viewing distance) [17] [8].
Quality metrics classification is addressed on [7] with focus on distortions, expatiating about data metrics (look at the signal fidelity and not to the data), reference information metrics (based on the SRCamount of available information) and picture metrics (treat the data as its visual information):
Data metrics algorithms are designed to describe the data reliability, but not the content. They are fast and straight forward to execute, by simply analysing pixels and their spatial relation or interpreting images and its differences. A widely used signal, the data metric Mean Squared Error (MSE), sums the SRC and an error signal (as its visibility relates directly to the loss of perceptual quality), quantifying the error signal strength (averaging the subtractions of pixels squared intensity. Images with the same MSE may have diverse types of errors, clearly visible or not). [7] [10] [20].
Reference information metrics are non-intrusive (non-referenced, NR) or intrusive (fully, FR, or reduced referenced, RR). FR methods often operate on an error image and do not react well to global shifts in brightness, contrast or colour, can include HVS models and require entirely available and calibrated signals (usually uncompressed SRC) and a strict spatiotemporal alignment to match each pixel with its counterpart in the other image. NR approaches are applied when the SRC is not on hand, focusing on artefacts due to a given transmission scheme. Since there is not a pristine reference 3D stimulus as a baseline for comparison, 3D-based algorithms are NR in nature, without the HVS aspect of learning from experience or alignment issues. Video content or distortions assumptions turn NR measurements unfeasible and may confuse actual content and distortions (e.g. blockiness estimating, the flashiest artefact of block-DCT, Discrete Cosine Transform, based compression methods such as H.26x, MPEG, Moving Picture Experts Group, standard). Used when the SRC is only partially available, RR methods has relevant controllable amount of images descriptors (extracted features, like amount of motion or spatial detail) [19] [9] [4] [7] [5] [16].
As only the extracted features need to be aligned in RR methods, alignment requests are naturally less rigid than for FR metrics (the most inflexible), while for NR methods the
11
signal quality can be individualized (the SRC is inaccessible in broadcasting and on real-time traffic: low-complexity measurements are needed, without knowing the traffic effect). Thus, methods are out-of-service or in-service, consonant with the usability covering adaptive streaming solutions: without or strictly with time constraints [3] [9]. RR quality models are applied for standardization by the HDTV VQEG (both in laboratory and in operational conditions), bearing in mind the access to the source video bandwidth, withdrawing all NR models. About FR assessment for standard definition television (SDTV), there are the reports in [32] and in [33]. Most existing approaches are FR, such as the subjective methods described in [17], applied for the general picture quality of stereoscopic systems as well as sharpness and depth (not looking at the SRC data features, but only its existence or not, and the categorical judgement method may be used, e.g., to identify the stereoscopic systems merits). Some algorithms are especially useful for NR applications, explicitly designed to detect compression or coding artefacts in a specific type of codec, e.g. blockiness in DCT-based algorithms or ringing in wavelet base [10] [4] [34] [35] [27].
Picture metrics can be classified into vision modelling and engineering approaches. The engineering approach is based on the extraction and analysis of the strength of certain features or artefacts in the video: structural elements (such as contours) or specific distortions (introduced by a processing step, compression technology or transmission link). Psychophysical effects can also be considered, but image analysis rather than fundamental vision modelling is the conceptual basis for their design [7]. The attributes of the evaluation methods classification, some variables or extra components could be added to the ITU recommendations, like psychoperceptual quality evaluation (analysing the relation between physical stimuli and sensory experience, including test sequences, procedures and classification: the overall quality or a certain attribute judged), user-centred quality evaluation or group of factors (relating the evaluation to the system or service potential use), user-centred design (including human and ergonomics subjects/factors, participatory design and design to user experience) and multimedia quality (combining produced and perceived qualities by categorizing multimedia technical factors into levels of abstraction: network, media and content). User-centred methods look at the evaluators of the essential system features as potential users, the potential context of use, evaluation tasks connected to the viewing purpose, or aims to understand the quality including ergonomic measures [29].
Together with the above mentioned viewing environment conditions (viewing distance, ambient lighting, pixel position in the image) and structural information, the quality perception (focusing on fidelity measure, instead of perceived quality) is also affected by the image appeal, the delivery and audio visual quality, the users’ preference, experience (the recency effect4 and the fact that trained viewers are able to spot certain changes more easily), state of mind, cognitive understanding and interaction with the scene (eye movements, instructions received, prior information about the content, attention, fixation, etc.). Idiosynchrasies of viewer attention may lead to a continuous failure risk on predicting the focused points, since the must for quality can vary with the concentration demanded on part(s) of the scene and the significantly reduced human sensitivity outside the focused ROIs. Thus, when challenges to ROIs based assessments like understanding and modelling attention are ignored, distortions are equally weighted over the entire frame [7] [36] [4].
A VA and delivery quality concepts are applied to 3D TV on the Sony© HX850 2012 TV, that selects the correction system along with the type of content (viewers are free to explore the image and sharper objects are valued, like those protruding from the screen and background scenes), while the earlier Sony© HX823 2011 TV slightly blurs the image background, persuading viewers to concentrate on the foreground action. The video purpose is also under debate, in line, for instance, with the pleasure the images give and the artistic choices. When the focus is not on the object chosen to be highlighted in the foreground, eye strain and fatigue may occur, leading to an eventual need of adjustments to sharpen up the various planes [37].
Encoders and compressors can enable simultaneous transmission of multiple frames in just one stream at a reduced bit rate by sampling rate conversion techniques, spatial or domain transformations and digitalizing images, reducing temporal redundancies. Defects produced due to compression depend on the scene and its variations, tending to quality fluctuations during a long program. Irreparable damages to the SRC (like the introduction of nonlinear distortions) may occur and the impact of network losses on video quality directly affects the encoded bit stream and some metrics are based on parameters that can be extracted from the bit stream with no one or only partial decoding. In audio-visual systems, synchronization between different media is done by delaying one of the signals in
4
The recency effect is related to the major influence of recently-viewed rather than older material in human opinion of a visual sequence: the last 10 to 15s contain the most memorable images of a sequence [8].
13
relation to the other (the linear combination – signals product – is a effective model of audio-visual quality) [16] [38].
Most works focus on FR metrics for TV/broadcast applications, many remains to be done in the areas of NR and RR quality assessment. Also in quality evaluation of low-bitrate video and transmission error artefacts, in which the development of reliable metrics have many issues still to be solved [7].
Many issues regarding the impact of 3D TV source on HVS are still under discussion, such as the possibility of such technology causing problems on children with epilepsy. It is known that visual patterns can provoke seizures in people susceptible to them, but researchers found no link between this specific technology and seizures. Some scientists believe that video content, not technology is more likely to bring on seizures [39].
1.2.
Objectives
The main objective of this work was to check the impact of a relevant ROI representation on the perceived quality of 3D still images. It was used the eye movement images database obtained from an eye tracking experiment described in [1] that handle subjective stimuli (created for the performance evaluation of 3D VA model in [21]), employing the generated and publicly available stereoscopic images of natural content, depicted on the Annex 9.1. Binary masks were generated for each FDM and to each corresponding image was added noise considering the 0 and 255 values as determining the ROI borders. Outputs were classified into images with noise added inside or outside the ROI, according to the noise type (Gaussian or Speckle), the noise parameters values (noise intensity) and to the noisy image view (left or right).
1.3.
Outline
This document is structured as follows:
In Chapter 1 there is a brief introduction to subjects covered in this dissertation, encompassing the context and motivation for this work as well as its objectives and this Outline. Concepts and overviews of topics that support the contents are treated here.
Chapter 2 presents a review of more specific literature regarding the various methodologies of video subjective evaluation.
In Chapter 3 it is shortly covered some content on attention models for 3D video and some papers over that topic are reviewed.
The metodology of the work done is depicted on Chapter 4. The objective measurements and subjective validation of the attention models are detailed.
The Chapters 5 and 6 comprise a succint discussion over the results and the conclusions reached from this study.
The References are listed on the Chapter 7 and the Appendix (Chapter 8) comprises the Instructions given to the participants of the subject evaluation procedure.
Finally, the Chapter 9 contains the Annex, with the description of the 3D Gaze eye tracking employed in this work and the display specifications.
15
2.
Literature Review
2.1.
Video subjective evaluation
methodologies
Subjective assessments, the most reliable method to assess the perceived video quality since the HVS is involved, are slow (in both setup and execution times), demand operational costs and are severely limited in the scope of the video material that can be evaluated. Subjective measurements can be divided in categories, according to the analysis point of view, the way they are implemented and the expected results for each specific test scenario. Then, it is predominantly exploited the correlation between the output of each algorithm and human subjective scores to validate practical objective methods. These experiments involve people with normal vision (according to medical definitions), in a controlled environment, and defined by several standards. There are different correlation parameters to validate the effectiveness of each algorithm such as, for example, between the objective quality evaluation algorithm and human perception of quality about a publicly available dataset of 3D images or videos [7] [9] [5] [16]. The ITU considers that there are two classes of subjective assessments. One of them establishes the system performance under optimum conditions (quality assessment). In this case, an objective metric is used to dynamically monitor and adjust image quality and a subjective metric is applied to determine a quality value for the sequence. The other class considers subjective assessments which establish the ability of systems to retain quality under non-optimum conditions that relate to transmission or emission (impairment assessments). Subjective metrics are used to optimize algorithms and parameter settings of image processing systems, as a result of a comparison between two sequences (a SRC and a PVS), customarily evaluated in a random order. ITU also recommends that the exhaustive descriptions of test configurations, materials, observers, and methods should be provided in all test reports, given the importance of establishing the basis of subjective assessments [17].
Test sequences of different content besides the one to be evaluated must be used, and the whole testing procedure should not exceed 30 minutes. According to [40], the content and duration of the sequences submitted for testing should be representative of
the content and duration of the potential use of the system. The selection of evaluators also does need to obey stipulated rules. The sample of participants must be representative of the system potential users. It is recommended the participation of at least 15 non-expert evaluators, who could be potential users of the system. For stereoscopic television it is required to have normal "stereopsis" observers, hence all participants must be tested about their vision. They also should receive instructions about the assessment method to be used, the types of defects likely to occur, the sequences rating scales, the sequences to be used and the whole timing [17] [27].
Using the Mean Opinion Score (MOS) subjective judgement categorization, each pair of images or short video sequences is assigned a quality score that is normalized, averaged and each standard deviation is calculated, resulting on numerical values from 1 to 5. To obtain a truthful result, many people must participate in the subjective evaluation, since single opinions may widely vary. Quantitative performance measures using objective video quality metrics usualy relate to aspects of their ability to estimate subjective scores. Such performance measures include: prediction accuracy (ability to predict with little error); monotonicity (amount of agreement between predictions and relative magnitudes of subjective quality ratings); and consistency (maintenance degree of the prediction accuracy over the test sequences range, response robustness to impairments). These attributes can be determined by different metrics based on the relationship between the Differential (or Degraded) MOS (DMOS) and predicted DMOS (DMOSp) for subsets within each video quality measurement. The DMOS rates the impairment of the PVS in relation to the SRC, normalizing the result to a a 5-grade scale [32] [41].
Evaluation metrics employ those procedures, such as the correlation coefficient between subjective and objective scores after variance-weighted and nonlinear regression analysis metrics (providing a prediction accuracy evaluation5), a Spearman rank-order correlation coefficient between both scores (DMOSp and DMOS, providing a prediction monotonicity measure) and the outlier ratio (a measurement of prediction consistency6). [32] [41].
5 This prediction is done by combining both Pearson linear correlation coefficient between DOSp and DOS
plus a test of significance of the difference and between DMOSp and DMOS [41].
6
I. e., the percentage of the predictions outside the range of 2 times of the standard deviations evaluates an objective model’s ability to provide consistently accurate predictions for every video sequence and not fail excessively for a subset of sequences. This prediction consistency is the number of predictions outlier
17
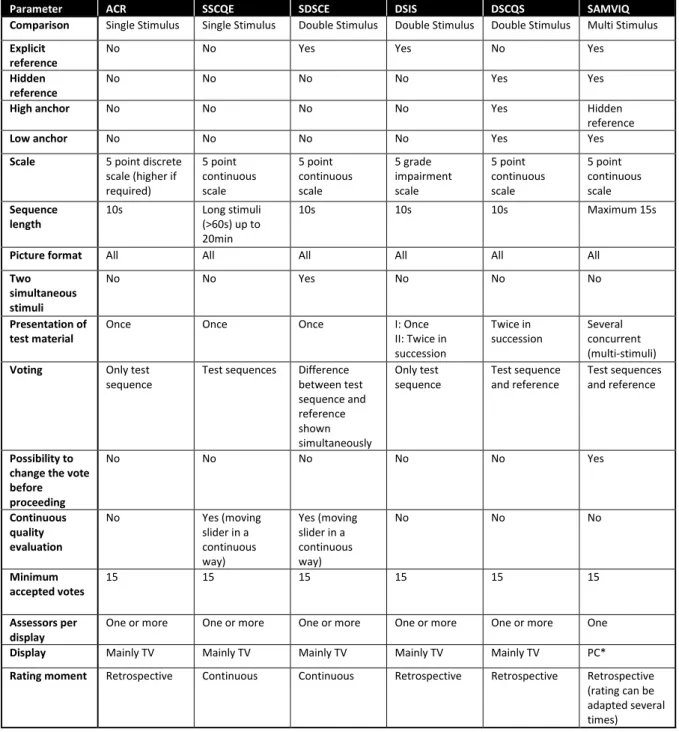
Due to the absence of subjective assessment methods specifically designed and standardized to 3D content, 2D ones are used as basis (consonant the ITU in [17], divided along with the test material presentation): Double Stimulus Impairment Scale (DSIS, the EBU - European Broadcasting Union - method), Double Stimulus Continuous Quality Scale (DSCQS), Single Stimulus Continuous Quality Evaluation (SSCQE), Single Stimulus (SS) methods and Stimulus Comparison (SC) methods. In [40], other methods are described: the Absolute Category Rating (ACR), the Simultaneous Double Stimulus for Continuous Evaluation (SDSCE, also addressed in [17]) and Subjective Assessment Methodology for Video Quality (SAMVIQ).
Five-grade scale Quality Impairment
5 Excellent 5 Imperceptible
4 Good 4 Perceptible, but not annoying 3 Fair 3 Slightly annoying
2 Poor 2 Annoying
1 Bad 1 Very annoying
Figure 2.1: ITU-R quality and impairment scales [17].
For SS, SC and DSIS, the commonly used rating scales such as verbal or numerical categories are given in Figure 2.1. The subjects evaluate the perceived image quality, the impairment, or the relation between two stereoscopic images by placing the presented stimuli in one of these categories [26].
In Single Stimulus (SS) methods, home viewing conditions are replicated: the observer does not have a SRC to compare with the presented sequence to give his judgement, but watch each piece of video displayed and then sort it according to a provided scale. A test sequence (a single image or a sequence of images) is presented at a time, being each one independent from the others and a quality index for the entire presentation is provided by the assessor. In the Single Stimulus with Multiple Repetitions, SSMR, the test material is randomly presented three times, allowing stabilizing the observer’s opinion, being the first rating discarded from further analysis. The test material might include only test sequences or both the test sequences and their corresponding SRC, presented as a freestanding stimulus for rating like any other test stimulus. The content to be analysed is selected and then the test images are prepared in accordance with
points (with an error greater than some threshold as a fraction of the total of points: the smaller this fraction, the more consistent are the predictions) after the nonlinear mapping [32] [41].
design options or ranges of factors to be evaluated. When more than one factor is considered, each image may represent one level of a single factor or one level of every examined factor, in which case it is possible to detect interactions among factors (non-additive effects). Both situations allow establishing a relation between the results and specific factors [41] [17].
SS methods can also be classified according to the evaluation procedure. The evaluator perception score is obtained by answers to the panel, as, for example, the identification of a certain impairment factor in the scene. The analysis of results is based on central tendency and dispersion of the response speed and accuracy characteristics. Rating of the test material can be done either in a post-presentation manner, or in a continuous rating. By employing continuous quality evaluation, longer sequences can be presented and evaluated. These are more representative of realistic video content and error statistics [38] [41].
Four types of SS methods have been used in television assessments: adjectival categorical judgement, numerical categorical judgement, non-categorical judgement and performance methods. Some of them are also used in SC methods.
The ACR method is useful for evaluating the end result of a service quality, considering that the content presentation is similar to the common use of the systems. It is obtained through the direct observation of the sample (test sequences are presented consecutively, one at a time, and independently on a category scale), without a SRC, to view the absolute quality values of the sample. The test sequences are observed one after another, and judged after each presentation, according to a five-point discrete scale, or more detailed (from 9 to 11 points) if necessary, under the subjective rating system MOS [29] [9] [42].
When large distortions occur and they shall be compared to near lossless scenarios, a single stimulus test saves a lot of time. However, small differences between sequences cannot be evaluated with ACR at all because the viewer cannot remember other sequences so precisely and the voting scale is too coarse. Hence, this method is not suitable for very small distortions. In the case of transmission distortions or strong coding artefacts however, this is a very good method to assess many sequences in a short time [10] [41].
19 Figure 2.1: Stimulus presentation in the ACR method [40].
The time pattern for the stimulus presentation is illustrated on Figure 2.1. If a constant voting time is used (e.g., multiple viewers simultaneously), then it should be 10s or less. The presentation time may be determined according to the content of the test material. If higher discriminative power is required, a nine-level scale may be used. For the ACR method, the necessary number of replications is obtained by repeating the same test conditions at different points of time in the test. The ACR scale with hidden reference removal method (ACR-HRR) is an example of applying post presentation assessment, where the SRC is included in the session without the knowledge of the viewers. It is made a subtraction operation between their opinion of the SRC and of each PVS, resulting in a difference MOS [40] [10] [41].
The SSCQE technique considers scene-dependent and time-varying impairments, quality variation related to scene content (impairments may be very short-lived), the ineptitude of conventional ITU-R methods alone to assess these materials, and disablility of the Double Stimulus (DS) methods of laboratory testing on replicating the single stimulus home viewing condition. The material is viewed once, without a SRC, in the context of 3DTV, to assess humans’ sense of presence, depth, and naturalness. A single quality measurement is obtained from the relation between the continuous assessment of a coded sequence and an overall single quality rating of the same segment. This method is proposed for long stereoscopic sequences (from 60s to 20min), covering the selection of meaningful test material (often limited to 10s) and mimicking home viewing conditions, since artefacts are dependent on spatial and temporal content. It is possible to increase the sampling rate of the subjective quality ratings (viewers can dynamically rate a sequence using a slider mechanism with an associated quality scale: useful for tracking rapid changes in quality and, thus, more useful for evaluating real-time quality monitoring systems) [16] [17] [41] [26] [38] [43].
ITU recommends that an electronic recording handset connected to a computer should be the recording device used to the continuous overall quality assessment. The sequences may have 5 min at least, each one with different quality parameters under evaluation. The instantaneous quality is assessed in real time according to the variable position of a hand-held slider. The viewer impressions are transmitted by moving the cursor proportionally to the perceived sensation. Image quality is indicated in a range from excellent (slider at the top of the grading scale) to bad (slider at the bottom of the scale) values, which are recorded at two samples per second rate and the data obtained allow the collection of histograms. The quality ratings have regular time intervals, capturing, thus, the perceived time variations in quality [17] [44] [38] [26] [43].
The procedure described in the ITU recommendations are adapted to the equipment in use, as in [43], where adjustments are done in computer-based testing. The slider for the SSCQE test was not a stand-alone hardware device, but a graphical on-screen slider steered by moving the mouse up and down (vertical mouse movements translated directly into slider shifts), aiming to give viewers a good tactile feeling of the quality scale, considering the additional advantage of the familiarity with handling a computer mouse. A break time is suggested to help reduce fatigue, as well as a random order of the test sequences at the clip level to minimize contextual effects [43].
In Stimulus comparison (SC) methods, images or sequences of images created in the same manner as in SS methods are displayed simultaneously and the viewer score is an index of the relation between them. Two equally adjusted displays or the major proportions of a divided screen can be used. The test session initiates with the observers’ opinion stabilization, which is not useful data to the test results. Three types of SC methods are used in television evaluations: adjectival categorical judgement, non-categorical judgement and performance methods [17] [38].
Comparison scale -3 Much worse -2 Worse -1 Slightly worse 0 The same 1 Slightly better 2 Better 3 Much better
21
The Adjectival Categorical Judgement methods, also known as Double Stimulus Comparison Scale (DSCS), can be applied as SC or as SS method. There is a judgements distribution, depending on the information required or sought, across scale categories for each attribute detection (e.g. to establish the impairment threshold), in SS cases, or, in SC cases, the relation between members of a pair to one of a set of categories defined in semantic terms, expressing the existence and direction of perceived differences. In operational monitoring, half of those grades can be used, and, in special cases, scales that assess text legibility, reading effort or image usefulness. The ITU-R scales are given in Figure 2.2 [17] [38] [44].
The Single Stimulus Numerical Categorical Scale (SSNCS) describes fast and easily automated judgement categories, not limited in value by adjectives, alowing the linear scale to be used for quite different ranges, with a quantity of points dependent on the conditions and range of perceptual attributes. 5 points may be enough, or half points on a scale of 10 may be useful. The number of trials per condition depends entirely on the assessment purpose, but the ITU defines that at least 3 are needed for statistical control [45].
In non-categorical judgments methods, the ratio of perceived quality is given by a number, a point or line in a vertical scale (a continuous variant of the categorical method, or numerical, a discrete method) labelled with two boundaries at the ends of this scale (e.g., same-different ends or the ends of a categorical scale). As in DSCS, they can be applied in the context of both SC and SS methods. Observers attribute a value to each image or image sequence shown, in SS cases, or to the relation between the elements of an assessment pair, in SC cases [38].
Using a continuous scale, the evaluator assigns each image or image sequence (SS) or each connection (SC) to a point on a line drawn between the labels. The scale may include additional reference labels at intermediate points. The distance from one end of the scale line is taken as the index for each condition (SS) or as the value for each condition pair (SC) [17].
In discrete scale form, the evaluator assigns each image or image sequence (SS) or each connection (SC) a number that reflects its judged quality level in a specified dimension (e.g., image sharpness or the difference in quality). The range of numbers used may be limited, either previously defined or not. The assigned number may describe the relation in absolute terms (without direct reference to the level of any other image or image sequence as in some forms of magnitude estimation) or in terms of a standard pair [17].
![Figure 1.1: ROI application on neuroimaging: MRI, PET and the obtained mask [15].](https://thumb-eu.123doks.com/thumbv2/123dok_br/18635605.911414/33.892.217.726.631.832/figure-roi-application-neuroimaging-mri-pet-obtained-mask.webp)
![Figure 2.1: ITU-R quality and impairment scales [17].](https://thumb-eu.123doks.com/thumbv2/123dok_br/18635605.911414/47.892.287.643.397.573/figure-itu-r-quality-impairment-scales.webp)
![Figure 2.3: DSIS method structure: (a) Variant I, (b) Variant II (c) pattern for the stimulus presentation [40] [17]](https://thumb-eu.123doks.com/thumbv2/123dok_br/18635605.911414/53.892.172.784.324.998/figure-method-structure-variant-variant-pattern-stimulus-presentation.webp)
![Figure 2.4: Rating scales of DSCQS and DSIS [16].](https://thumb-eu.123doks.com/thumbv2/123dok_br/18635605.911414/56.892.297.581.798.966/figure-rating-scales-dscqs-dsis.webp)
![Figure 3.1: A 2D computational model of attention [11].](https://thumb-eu.123doks.com/thumbv2/123dok_br/18635605.911414/61.892.264.701.586.833/figure-d-computational-model-attention.webp)
![Figure 3.2: Respective schemes of the depth-weighting and depth-saliency VA models [21]](https://thumb-eu.123doks.com/thumbv2/123dok_br/18635605.911414/62.892.199.723.665.883/figure-respective-schemes-depth-weighting-depth-saliency-models.webp)