Processamento auditivo e audiometria de altas freqüências
em escolares de São Paulo***
Auditory processing and high frequency audiometry in students
of São Paulo
*Fonoaudióloga. Mestre em Distúrbios da Comunicação Humana
pela Universidade Federal de São Paulo - Escola Paulista de Medicina (Unifesp - EPM). Aluna do Programa de Pós-Graduação em Distúrbios da Comunicação Humana da Unifesp -EPM.
**Fonoaudióloga. Doutora em Distúrbios da Comunicação Humana pela Unifesp - EPM. Professora Adjunto da Disciplina dos Distúrbios de Audição da Unifesp - EPM.
***Trabalho Realizado na Unifesp-EPM.
Artigo de Pesquisa
Artigo Submetido a Avaliação por Pares
Conflito de Interesse: não
Recebido em 15.01.2004.
Revisado em 23.03.2004; 28.09.2004; 18.01.2005; 17.03.2005; 9.05.2005. Aceito para Publicação em 22.04.2005.
Cristina Silveira Ramos* (ramoscri@hotmail.com) Liliane Desgualdo Pereira**
Abstract
Background: auditory processing and auditory sensibility to high frequency sounds. Aim: to characterize the localization processes, temporal ordering, hearing patterns and detection of high frequency sounds, looking for possible relations between these factors. Method: 32 hearing fourth grade students, born in city of São Paulo, were submitted to: a simplified evaluation of the auditory processing; duration pattern test; high frequency audiometry. Results: three (9,4%) individuals presented auditory processing disorder (APD) and in one of them there was the coexistence of lower hearing thresholds in high frequency audiometry. Conclusion: APD associated to an auditory sensibility loss in high frequencies should be further investigated.
Key Words: Hearing; Auditory Central Diseases; Students.
Resumo
Tema: processamento auditivo e sensibilidade auditiva para altas freqüências. Objetivo: caracterizar os processos de localização, ordenação temporal, padrões auditivos e detecção de tons de altas freqüências, procurando relações entre elas. Método: 32 ouvintes, paulistanos, escolares (quarta série), submetidos à avaliação simplificada do processamento auditivo, teste de padrão de duração, audiometria de alta freqüência. Resultados: três (9,4%) indivíduos mostraram transtorno do processamento auditivo (TPA), e em um coexistiu o rebaixamento auditivo em altas freqüências. Conclusão: TPA associado à perda da sensibilidade auditiva em altas freqüências deve ser esclarecido em novas pesquisas.
Palavras-Chave: Audição; Doenças Auditivas Centrais; Estudantes.
Introduction
The central auditory nervous system (CANS) is a complex system of neural pathways that may be affected by several developmental and pathological factors. The central auditory evaluation had its start in the decade of 50 and, since then, several tests were developed aiming at a better understanding of the central auditory system’s function and its disorders.
For years, there were controversies regarding the meaning of the term central auditory processing. In 1996, ASHA defined the Auditory Processing Disorder (APD) as the alteration in one, or more, of the necessary mechanisms or processes of the auditory system responsible for the following behavioral phenomena: sound localization and lateralization; auditory discrimination; auditory pattern recognition; temporal aspects of audition, including temporal resolution, temporal masking, temporal integration and temporal time ordering; auditory performance in the presence of competing acoustic signals and auditory performance with degraded acoustic signals.
The auditory processing is related, then, to what we do with what we hear (Katz et al., 1992). Therefore, having normal hearing thresholds is not enough. It is necessary that the acoustic signal is analyzed and interpreted in a meaningful message. The APD is an specific dysfunction of the auditory process, but it can also be associated to language, memory and attention deficits, among others.
Individuals with peripherical hearing loss will probably have low performance in the auditory processing tests. However, this is not a sine qua non fact. There are people who even presenting
peripherical hearing loss (mild to moderate degree) present normal auditory processing.
The majority of studies correlating hearing loss with auditory processing disorders concern the hearing losses in the frequencies from 250 to 8000Hz (Abel et al, 1990; Marotta et al, 2002; Neyenhuis et al, 2004). A few studies correlate hearing loss in high frequencies with auditory processing.
This happens because the high frequencies audiometry, that can be done through air or bone conduction and that evaluates the frequencies from 8000 to 18000Hz, is a relatively recent procedure and very little used in the clinical audiologic practice.
Some studies show that high frequencies are important for the consonantal discrimination and to the speech recognition, and that people with a
hearing loss in those frequencies have difficulty to distinguish the signal from the noise (figure-ground), presenting alteration of the understanding in noisy places (Skinner and Miller, 1983).
The aim of this study is to characterize the processes of localization, temporal time ordering, auditory pattern and high frequencies tones detection in school children, searching for possible correlations between them. This study may contribute with the reflection about the use of the simplified auditory processing evaluation in school children as well as about a possible co-existence between increased hearing thresholds and auditory processing disorders.
Method
This research was approved by the Research Ethics Committee of the Federal University of São Paulo (protocol number 514/01). The school and the children’s parents authorized the conduction of the research, signing the Informed Consent Term. Thirty two children, 16 male and 16 female, aged between 9 and 10 years old, regularly enrolled in the 4th grade of a private school located in the south zone of São Paulo city, were evaluated.
The evaluations were accomplished in three stages in a silent class of the school. The first and third evaluation stages were carried out individually and the second one, in groups of four children, since the evaluation procedure allowed the group evaluation. Each stage lasted approximately 15 minutes.
Nine to ten years old children were chosen and two procedures were completed in order to select the children: the cochleopalpebral reflex test – in which the child should present the reflex; and hearing screening in the frequencies of 500, 1000, 2000 e 4000 Hz, using a Pediatric audiometer PA-2 – in which the child should respond to a 20dB stimuli in all tested frequencies.
Children were submitted individually to the simplified auditory processing evaluation, proposed by Pereira (1993). The following auditory abilities were tested: sound localization in five directions; verbal and non-verbal sequential memory, corresponding to the processes of localization and temporal time ordering.
direction where the sound came from. The following positions were tested: above, in front, behind, right and left sides of the head.
In order to analyze the non-verbal sequential memory, the following instruments were used: rattle, bell, agogo and black-black. Before starting the evaluation, the sounds produced by the four instruments were presented to the child in order for him to be able to identify them. Furthermore, a demonstration was carried out with the child positioned in front of the instruments; he was asked to point the correct order in which the instruments were presented. Then three different sequences of four instruments were presented to the child sitting with his back to the instruments and in the end of the sounds presentation, the child was asked to point them in the order he judged correct.
The verbal sequential memory evaluation was conducted with the syllable “pa”, “ta”, “ca” and “fa” sorted in three different sequences. To ensure that all children were able to produce these syllables, they were produced isolated and the children were asked to repeat them. Subsequently, the three sequences of four syllables were presented, without visual cues, and the children were requested to reproduce them orally.
The cochleopalpebral reflex test was done using a musical instrument called agogo. It was observed the presence or absence of the reflex during the percussion of the instrument.
Each child’s responses were registered in a standard individual protocol.
The analysis criteria used were based on Pereira (1993). Each ability was analyzed isolated using the subsequent criteria:
· Sound localization (SL): normal – 4 to 5 correct responses; altered – 0 to 3 correct responses; · Non-verbal sequential memory (NVSM): normal – 2 to 3 correct responses; altered – 0 to 1 correct response;
· Verbal sequential memory (VSM): normal – 2 to 3 correct responses; altered – 0 to 1 correct response; · Cochleopalpebral reflex: normal – present; altered - absent.
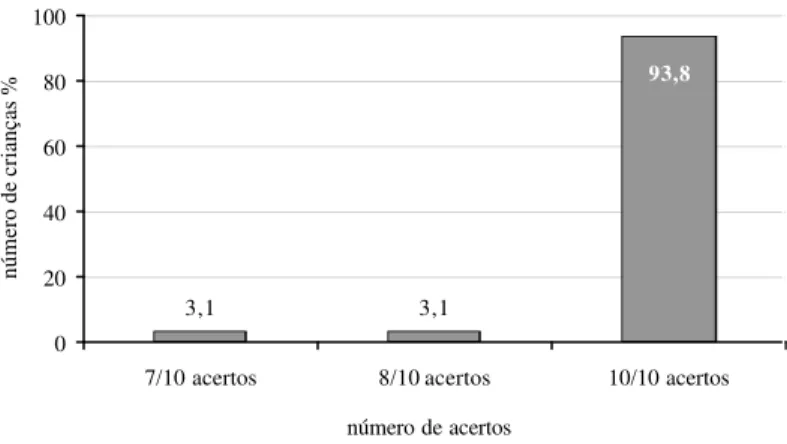
The second stage of the evaluation comprised the Sound Duration Pattern of 3 and 4 elements, proposed by Lizarro (1999). To ensure the uniformity of the stimuli presentation, a CD recording of the test was used (with sounds produced by a transversal flute). The sound stimuli produced present a frequency of 4000Hz, varying only the presentation duration. Two different sound
stimuli are presented – a short sound (lasting 59 ms) and a long sound (161 ms) – arranged in 10 different sequences of three sounds and 10 of four sounds. This procedure allows the evaluation of the auditory pattern recognition process.
The evaluation was performed in groups of four children each, selected randomly. In order to standardize the applications, the same sound device was used in all of the evaluations; and all chairs were positioned facing the sound blaster, at approximately one meter distantly.
Every child received an answer sheet and was requested to represent the long sound with a long line ( ) and a short sound with a short line ( ). Afterwards, the instructions were given and a demonstration was performed to ensure the children’s comprehension. The instructions were for the child to pay attention to the sequence and, only after its presentation, to mark the answer in the sheet in the order that they judged the correct one.
The analysis criteria of the results was proposed by Rezende (2000). Thus, it was considered a normal performance when a child presented 10 correct answers for the 10 items presented in the Sound Duration Pattern test with 3 sounds, and 9 correct answers for the 10 items in the Sound Duration Pattern test with four sounds. The third stage of the evaluation was the high frequencies audiometry, that tests the hearing thresholds in frequencies from 8000 to 18000Hz (obtained in dBSPL) using the psychoacoustic method of limits. In this procedure, the limit between hearing and not hearing the pure tones is searched. Thus, the intensity level is decreased in steps of 5 dB until the sound is no longer detected by the individual. In this moment, the sound intensity level is increased until the individual refers that is detecting it; this value corresponds to the hearing threshold for the sound frequency tested. The intensity level values vary from zero to 110 dB sound pressure level (P0re = 20microPascal). This evaluation was performed individually in a free-field, using the Audiometer Interacoustics
AS10HF with ear phones Koos HV-1A/PRO. The
child was asked to put the ear phones and listen carefully to the sounds, raising his hand whenever hearing them. The air conduction thresholds for the right and left ears were tested, in the frequencies of 8, 9, 10, 11, 12, 13, 14, 15, 16, 17 and 18 kHz. The data were registered in individual, standard sheets.
FIGURE 1. Children distribution according to the correct responses in the sound localization test.
69
31
0 20 40 60 80 100
4/5 acertos 5/5 acertos número de acertos
número de crianças %
número de crianças %
Evaluation (SAPE) and in the Sound Duration Pattern Test of three and four syllables (SDPT3 and 4) were analyzed statistically. Children who presented responses below the expected in the SAPE and SDPT3 and 4 were re-evaluated, once these procedures may be distorted due to the difficulty in controlling the child’s attention.
Only the tasks that the child presented difficulties were re-evaluated and, then, all data were analyzed again. The children were divided into two groups:
· Group 1: compose d by children who presented performance within the normalratings, in the SAPE and in the SDPT3 and 4;
· Group 2: composed by children who presented performance below the normal ratings in at least one of the procedures;
As follows, the data were submitted to statistical study making possible the quantitative and qualitative analysis.
Statistical Methods:
The results were analyzed using the Student’s t-Test and the Regression Model with Repeated Measure (or General Linear Model) and the significance level adopted was 0,05 or 5%.
Results
Figure 1 shows the children distribution according to the number of correct responses in the Sound Localization Test; Figure 2 shows the children distribution according to the number of correct responses in the Non-verbal Sequential Memory Test; Figure 3 shows the children distribution according to the number of correct responses in the Verbal Sequential Memory Test; Figure 4 shows the children distribution according to the number of correct responses in the Sound Duration Pattern Test of 3 sounds and Figure 5, the children distribution according to the number of correct responses in the Sound Duration Pattern Test of 4 sounds.
Based on these results, the sample was gathered in two groups: group I comprised by children who presented performance within the normal standards, in the SAPE and in the SDPT3 and 4; and group II: composed by children who presented performance below the normal standards in at least one of the procedures. Table
1 shows the children distribution according to groups I and II.
Table 2 displays the statistical test values calculated to compare the high frequencies audiometry thresholds according the variables ear (right and left) and gender (male and female).
0
5 6 4 4
0 2 0 4 0 6 0 8 0 100
1/3 acertos 2/3 acertos 3/3 acertos
número de acertos
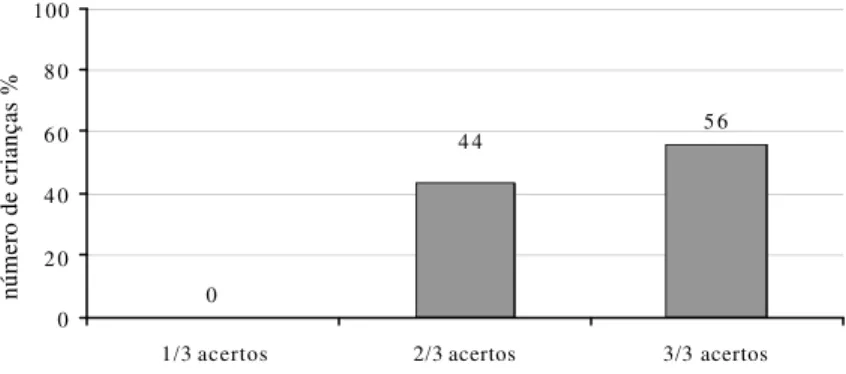
FIGURE 2. Children distribution according to the correct responses in the non-verbal sequential memory test.
FIGURE 3. Children distribution according to the correct responses in the verbal sequential memory test.
34
63
3 0
20 40 60 80 100
1/3 acertos 2/3 acertos 3/3 acertos número de acertos
TABLE 2. Statistical test values of the comparison of high frequencies audiometry thresholds according the variables ear (right and left) and gender (male and female)
Freqüências Sonoras (kHz)
8 9 10 11 12 13 14 15 16 17 18
M x FOD 0,643 0,468 0,358 0,381 0,261 0,303 0,741 0,687 0,184 0,193 0,652
M x FOE 0,799 0,727 0,123 0,108 0,269 0,208 0,167 0,506 0,102 0,034* 0,092
OD x OE 0,248 0,225 0,143 0,222 0,415 0,296 0,506 0,537 0,512 0,219 0,524 P < 0,05
Legenda: M - masculino; F - feminino; OD - orelha direita; OE - orelha esquerda.
Since there was no statistical difference regarding the variables described above, the individuals of each group were gathered by gender and ear.
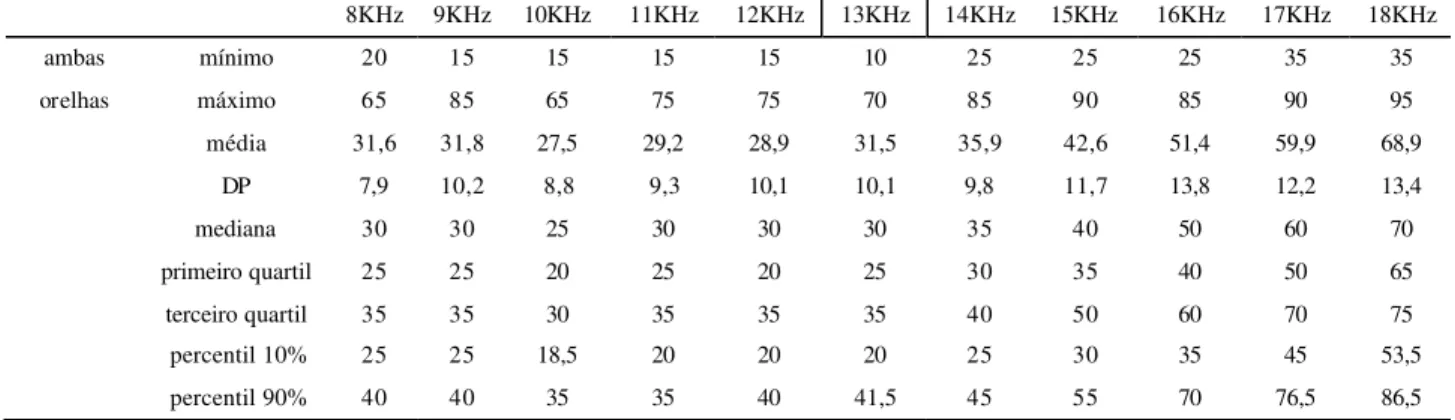
Table 3 and figure 6 present the maximum, minimum and average thresholds, the standard deviation, the median, the 1st and 3rd quartiles and the percentiles 10 and 90% observed in the high frequencies audiometry for children in group I. Figure 7 demonstrates a second degree curve built for the hearing thresholds of the tested acoustics. Once group II was composed only by 3 children, the descriptive measures mentioned above couldn’t be studied.
This way, in figures 9, 10 and 11 the hearing thresholds obtained in the high frequencies audiometry for each child are compared to the descriptive measures obtained for the hearing thresholds of children from group I.
Discussion
Before discussing the results themselves, we will comment on the inclusion criteria used for the selection of this study’s sample.
Ten years old children were chosen to compose the sample since it is known that the auditory abilities develop according to the increase of age (Koay, 1992), and that children tend to reach the adult’s performance in auditory processing test when they are around ten or eleven years old (Baran & Musiek, 2001). Furthermore, some studies demonstrate that small children don’t have good a performance in the high frequencies hearing evaluations; that the onset of high frequencies hearing loss is around ten years old (Schochat et al., 2000); that with the increase of age, there is an increase of the high frequencies hearing thresholds (Queiroz et al., 1999; Abel et al., 2000; Rosa et al., FIGURE 4. Children distribution according to the correct responses in the
duration pattern test with 3 sounds.
3,1 3,1
93,8
0 20 40 60 80 100
7/10 acertos 8/10 acertos 10/10 acertos
número de acertos
número de crianças %
FIGURE 5. Children distribution according to the correct responses in the duration pattern test with 4 sounds.
número de crianças % 6,2 3,1
21,7
69
0 20 40 60 80 100
5/10 acertos 8/10 acertos 9/10 acertos 10/10 acertos número de acertos
TABLE 1. Children distribution according to the groups.
Grupo I Grupo II Total
masculino 16 0 16
feminino 13 3 16
TOTAL 29 3 32
FIGURE 7. Adjustment of the average profile of the high frequencies hearing thresholds of group I
0 10 20 30 40 50 60 70 80 90 100
8 9 10 11 1 2 13 14 15 16 17 18
freqüência (khz)
limiar (dB)
mod empírico
TABLE 3. Reference values for the high frequencies hearing thresholds of children from group I.
Limiares Auditivos (dB)
8KHz 9KHz 10KHz 11KHz 12KHz 13KHz 14KHz 15KHz 16KHz 17KHz 18KHz
ambas mínimo 20 15 15 15 15 10 25 25 25 35 35
orelhas máximo 65 85 65 75 75 70 85 90 85 90 95
média 31,6 31,8 27,5 29,2 28,9 31,5 35,9 42,6 51,4 59,9 68,9 DP 7,9 10,2 8,8 9,3 10,1 10,1 9,8 11,7 13,8 12,2 13,4
mediana 30 30 25 30 30 30 35 40 50 60 70
primeiro quartil 25 25 20 25 20 25 30 35 40 50 65
terceiro quartil 35 35 30 35 35 35 40 50 60 70 75
percentil 10% 25 25 18,5 20 20 20 25 30 35 45 53,5
percentil 90% 40 40 35 35 40 41,5 45 55 70 76,5 86,5
FIGURE 6. Reference values for the high frequencies hearing thresholds – percentile 10%, 1st quartile, average, median, 3rd quartile and
percentile 90%– for both ears and genders – group I.
0 10 20 30 40 50 60 70 80 90 100
8 9 10 11 12 13 14 15 16 17 18
freqüência (khz)
limiar (dB)
FIGURE 9. Hearing thresholds of children 17 compared to the reference values for the high frequencies hearing thresholds.
0 10 20 30 40 50 60 70 80 90 100
8 9 10 11 12 13 14 15 16 17 18
freqüência (khz)
limiar (dB)
Percentil 10% Percentil 90% c17
FIGURE 10. Hearing thresholds of children 28 compared to the reference values for the high frequencies hearing thresholds
0 10 20 30 40 50 60 70 80 90 100
8 9 10 11 12 13 14 15 16 17 18
freqüência (khz)
limiar (dB)
Percentil 10% Percentil 90% c28
FIGURE 8. Hearing thresholds of children 3 compared to the reference values for the high frequencies hearing thresholds.
0 10 20 30 40 50 60 70 80 90 100
8 9 10 11 12 13 14 15 16 17 18
freqüência (khz)
limiar (dB)
2001); and that the best auditory sensitivity, above 14 kHz, was observed in ten years old children (Burén et al., 1992). This way, it is believed that evaluating ten years old children may exclude the possibility of the beginning of the high frequencies auditory sensitivity deterioration process and the immaturity to respond to the test. Nevertheless, the auditory abilities development, in this age, is considered in the final phase of maturation and children are able to respond adequately to the auditory processing tests proposed.
The second inclusion criterion was the presence of cochleopalpebral reflex. Azevedo (1993) suggests that the presence of this reflex is an indication of normal hearing. Initially children were screened for the presence or absence of the cochleopalpebral reflex and afterwards, the normal auditory sensitivity was confirmed by obtaining the minimal response levels using the Pediatric Audiometer AP-2. It shall be stressed that all children presented cochleopalpebral reflex and had normal auditory sensitivity, presenting minimal response levels in 20 dB for all sound frequencies evaluated. This confirms the concordance of these procedures as indicative of good capacity to detect pure tones of frequencies from 500 to 4000Hz.
The auditory processing of information is essential for the language comprehension and for learning, and the identification of the nature of the auditory damage contributes for the intervention direction (Bellis & Ferre, 1999). Moreover, the literature points that there is a relation between speech and language acquisition and development and the performance in the abilities of localization, verbal and non-verbal sequential memory of the auditory processing (Befi & Carvallo, 1998; Schochat (1999); Garcia, 2001; Gil et al., 2002). The Simplified Auditory Processing Evaluation was used in order to observe possible auditory processing alteration in school age children, to observe its interrelations with learning difficulties and to counsel parents and teachers (Sacaloski et al, 2000; Zanchetta et al., 2000).
Concerning the sound localization test (figure 1), 100% of the children presented results according to the expected.
In the non-verbal sequential memory test (figure 2), 100% of the children presented two or more corrected responses, being considered within the normal standards. This data disagrees with another study (Silva et al., 1993) that observed that this test was the one with the greatest number of alterations. In the verbal sequential memory test (figure 3), the percentage of children who presented
results according to the expected was 97%.One children, therefore didn’t present satisfactory performance in this test.
However, there are other auditory processing abilities that are not assessed in this screening and that contribute for the language learning, such as, for example, the sound pattern identification (Pereira, 2001). The adequate perception of non-verbal sound patterns, of frequency and duration, contribute to the processing of the speech acoustic characteristics. The adequate reception of the acoustic aspects of speech contributes for the adequate understanding in the language acquisition and development phase, since it facilitates the prosody, the rhythm and the speech intonation appreciation (Musiek, 1999). Furthermore, the duration and frequency pattern tests are sensitive to identify auditory processing disorders (Musiek et al., 1990).
In this study, we chose to complement the auditory processing evaluation by adding a sound duration pattern test with 3 and 4 sounds (Lizarro, 1999). This test may be performed in free field and its importance and efficacy had already been demonstrated in other studies (Rezende, 2000; Dibi, 2000; Rezende et al., 2001). For the analysis criterion , we used the values proposed by Rezende (2000).
Regarding the number of correct responses for the duration pattern test with 3 sounds (figure 4), the percentage of performances below the expected was 6,2%. With 4 sounds (figure 5) we observed that 9,4% of the children presented unsatisfactory performance.
were pointed by the school director as having academic learning difficulties. Also, these children’s parents received a feedback and were guided to perform some tasks at home, aiming at improving some auditory abilities, and to reevaluate the auditory processing of the child in six months.
Skinner & Miler (1983) affirmed that the high frequencies sounds would be necessary for the consonantal discrimination and speech recognition and that, apparently, people with high frequencies hearing losses would have difficulties to detach the signal from the noise and to listen in noisy ambient. The high frequencies audiometry is not a very used exam in the clinical routine and there are only a few studies conducted in Brazil. (Fouquet, 1997; Pedalini et al., 2000). The data obtained in the evaluations were analyzed statistically and descriptive measures were calculated for the hearing thresholds (table 3 and figure 6). The studies of Humes and Col. (1996) and Dibi et al. (1999) show that the performance in the frequency and duration pattern tests is not influenced by the presence of hearing loss in the frequencies from 250 to 500Hz. Therefore, hearing impaired people resulting from barriers in the peripheral hearing system could or could not present good capacity of temporal processing of information.
The statistical analysis correlated the hearing thresholds considering the variables: right and left ears and male and female genders. No significant statistical differences were observed regarding the variable ear. Concerning the variable gender, there was significant difference only in the frequency of 17kHz. Due to these findings, data were grouped by gender and ear. Stelmachowicz et al. (1989) suggest, however, that there are differences between hearing thresholds regarding gender and ear.
As reported by Queiroz et al. (1999), there was a decrease of auditory sensitivity with the increase of the frequency. Kenna et al. (1993) suggest that the hearing thresholds substantially increase from 13 or 14kHz. In this study the hearing thresholds increased from 14kHz, agreeing with the literature. Based on the obtained data, a second degree curve was built for the sample’s hearing thresholds (figure 7), where it is possible to observe the increasing of the thresholds from the frequency of 13kHz. We verified that the high frequencies auditory sensitivity was similar for the frequencies from 8 to 12kHz (around 35dB), progressively getting worse in approximately 5 dB after 13kHz.
The group II data, composed by only three children, couldn’t be analyzed statistically.
Therefore, the high frequencies audiometry result of each child was compared, separately, to the reference values established for the sample. There were two children whose high frequencies hearing thresholds were very close to the average thresholds of the sample (figures 8 and 9). Nevertheless, all sound frequencies thresholds were within the calculated reference values (percentile 10%, 1º quartile, median, 2º quartile and percentile 90%).
The third child presented higher hearing thresholds than the sample’s average thresholds. Furthermore, his hearing thresholds were above the percentile 90% in several frequencies.
These data reveal that there might be a correlation between the auditory processing difficulties and the high frequencies auditory sensitivity. However, it is early to affirm that this relation exists, once the number of children with auditory processing difficulties was very low. We believe that new researches should be carried out in order to clarify the possible association between the Auditory processing Disorder and the increased thresholds in the high frequencies audiometry.
Conclusion
Based on the evaluation of 32 ten years old children enrolled in the 4th grade of a private school in São Paulo city, we can conclude that:
· 90,6% of the children presented normal processes of sound localization, temporal time ordering and recognition of sound duration pattern;
· The high frequencies auditory sensitivity decreased with the increase of the sound frequency, and was similar in both ears. The thresholds intensity level varied between 25 to 70dBSPL in median values for the sound frequencies from 8 to 18kHz;
References
AMERICAN SPEECH-LANGUAGE-HEARING ASSOCIATION (ASHA) - Central auditory processing: current status of research and implications for clinical practice. Am. J. Audiol., v. 5, n. 2, p. 41-54, 1996. ABEL, S. M.; KREVER, E. M.; ALBERTI, P. W. Auditory detection, discrimination and speech processing in ageing, noise-sensitive and hearing-imparied listeners. Scan. Audiol., v. 19, n. 1, p. 43-54, 1990.
ABEL, S. M.; SASS-KORTSAK, A.; NAUGLER. The role of high-frequency hearing in age-related speech understanding deficits. Scan. Audiol., v. 29, n. 3, p. 131-138, 2000.
AZEVEDO, M. F. Desenvolvimento auditivo de crianças normais e de alto-risco. 1993. Tese 329 f. (Doutorado em Distúrbios da Comunicação Humana) - Universidade Federal de São Paulo - Escola Paulista de Medicina, São Paulo. BARAN, J. A.; MUSIEK, F. E. Avaliação comportamental do sistema nervoso auditivo central. In: MUSIEK, F. E.; RINTELMANN, W. F. Perspectivas atuais em avaliação auditiva. Barueri: Manole, 2001. p. 371-409.
BÉFI, D.; CARVALLO, R. M. M. Processamento auditivo central em alterações do desenvolvimento da linguagem. Pró-Fono Revista de Atualização Científica, v. 10, n. 2, p. 47-50, 1998.
BELLIS, T. J.; FERRE, J. M. Multidimensional approach to the differential diagnosis of central auditory processig disorders in children. J. Am. Acad. Audiol., v. 10, n. 6, p. 319-328, 1999.
BURÉN, M.; SOLEM, B. S.; LAUKLI, E. Threshold of hearing (0,125-20kHz) in children and youngsters. Br. J. Audiol., v. 26, n. 1, p. 23-31, 1992.
DIBI, V. G. Teste de padrão tonal de duração e freqüência sonora e habilidades grafo-fônicas. 2000. Tese 94 f. (Mestrado em Distúrbios da Comunicação Humana) -Universidade Federal de São Paulo - Escola Paulista de Medicina, São Paulo.
DIBI, V. G.; PELA, S.; NOGUEIRA, J.; IÓRIO, M. C. M.; PEREIRA, L. D. Processamento auditivo central em indivíduos com deficiência profunda - estudo preliminar. In: CONGRESSO INTERNACIONAL DE FONOAUDIOLOGIA, 4.; 1999, São Paulo. Anais... São Paulo: [s.n], 1999. p. 90.
FOUQUET, M. L. Limiar de audibilidade nas freqüências ultra-altas de 4 a 18kHz em adultos de 18 a 30 anos. 1997. 68 f. Monografia (Especialização em Distúrbios da Comunicação Humana) - Universidade Federal de São Paulo - Escola Paulista de Medicina, São Paulo.
GARCIA, V. L. Avaliação do processamento auditivo em
crianças com e sem distúrbios de aprendizagem. 2001.
313 f. Tese (Doutorado em Distúrbios da Comunicação Humana) - Universidade Federal de São Paulo - Escola Paulista de Medicina, São Paulo.
GIL, D.; BORGES, A. C. C.; SEGAL, S. Triagem auditiva e avaliação simplificada do processamento auditivo na escola. In: ENCONTRO INTERNACIONAL DE AUDIOLOGIA, 17., 2002, São Paulo. Anais... São Paulo: [s.n.], 2002. p. 56. HUMES, L. E.; COUGHLIN, M.; TALLEY, L Evaluation of the use of a new compact disc fpr auditory perceptaul assessment in the elderly. J. Am. Acad. Audiol., v. 7, n. 6, p. 419-427, 1996.
KATZ, J.; STECKER, N. A.; HENDERSON, D. Central auditory processing: a transdisciplinary view. St. Louis: Mosby Ear Book, 1992.
KENNA, M. A.; VENTO, B.; SABO, D. High frequency and ultra high frequency in a normal pediatric population. In: ANNUAL MEETING OF SOCIETY FOR EAR, NOSE AND THROAT ADVANCES IN CHILDREN, 21., 1993, Pittsburg. Resumos... Pittsburg: [s.n.], 1993.
KOAY, M. E. T. Speech and speech disorders: implications for central auditory processing. In: KATZ, J.; STECKER, N. A.; HENDERSON, D. Central auditory processing: a transdiciplinary view. St. Louis: Mosby Ear Book, 1992. p. 187-198.
LIZARRO, M. B. T. Processos temporais auditivos em
músicos de Petrópolis. 1999. 76 f. Monografia
(Especialização) Universidade Federal de São Paulo -Escola Paulista de Medicina, São Paulo.
MAROTTA, R. M. B.; QUINTERO, S. M.; MARONE, S. A. M. Avaliação do processamento auditivo por meio do teste SSW em indivíduos com audição normal e ausência do reflexo acústico contralateral. Rev. Brás. Otorrinolaringoçl., v. 68, n. 2, p. 254-261, mar.-abr. 2002.
MUSIEK, F. E.; BARAN, J. A.; PINHEIRO, M. L. Duration pattern recognition in normal subjects and patients with cerebreal and cochlear lesions. A u d i o l o g y, v. 29, n. 6, p. 304-313, 1990.
MUSIEK, F. E. Habilitation and management of auditory processing disorders: overview of selected procedures. J. Am. Acad. Audiol., v. 10, n. 6, p. 329-342, 1999. NEIJENHUIS, K.; TSCHUR, H.; SNIK, A. The effect of mild hearing impairment on auditoty processing tests. J. Am. Acad. Audiol., v. 15, n. 1, p. 6-16, jan. 2004. PEDALINI, M. E. B.; SANCHEZ, T. G.; D´ANTONIO, A.; D´ANTONIO, W.; BALBANI, A.; HACHIYA, A.; LIBERMAN, S.; BENTO, R. F. Média dos limiares tonais na audiometria de alta freqüência em indivíduos normais de 4 a 60 anos. Pró-Fono Revista de Atualização Científica, v. 12, n. 2, p. 17-21, 2000.
PEREIRA, L. D. Processamento auditivo. Temas sobre Desenvolvimento, v. 12, n. 11, p. 7-14, 1993.
PEREIRA, L. D. Processamento auditivo: discussão de casos. In: CONGRESSO BRASILEIRO DE FONOAUDIOLOGIA, 9., 2001, Espírito Santo, Anais... Espírito Santo: [s.n.], 2001.
QUEIROZ, M. S.; SALVADOR, R. C. O.; BRANCO, F. A. C.; SCHARLACH, R. C. Audiometria de altas freqüências em indivíduos ouvintes normais. In: CONGRESSO INTERNACIONAL DE FONOAUDILOGIA, 4., 1999, São Paulo. Anais... São Paulo: [s.n], 1999. p. 263.
REZENDE, A. G. Padrões temporais auditivos em escolares da 4ª série do ensino fundamental. 2000. 67 f. Tese (Mestrado em Distúrbios da Comunicação Humana) -Universidade Federal de São Paulo - Escola Paulista de Medicina, São Paulo.
ROSA, A. H. O.; FOIADELLI, F; CARVALLO, R. M. M.; LITCHTIG, I.; COUTO, M. I. V. Audição em altas freqüências e emissões otoacústicas em familiares de portadores de deficiência auditiva. In: CONGRESSO BRASILEIRO DE FONOAUDIOLOGIA, 9., 2001, Espírito Santo. Anais... Espírito Santo: [s.n], 2001.
SACALOSKI, M.; ALAVARSI, E.; GUERRA, G. R. Fonoaudiólogo e professor: a parceria fundamental. In: SACALOSKI, M.; ALAVARSI, E.; GUERRA, G. R.
Fonoaudiologia na escola. São Paulo: Lovise, 2000,
p. 19-26.
SCHOCHAT, E. Avaliação do processamento auditivo central em crianças com dificuldades de aprendizagem. In: CONGRESSO INTERNACIONAL DE FONOAUDIOLOGIA, 4., 1999, São Paulo. Anais... São Paulo: [s.n], 1999. p. 349.
SCHOCHAT, E.; RABELO, C. M.; SANFINS, M. D. Processamento auditivo central: testes tonais de padrão de freqüência e duração em indivíduos normais de 7 a 16 anos de idade. Pró-Fono Revista de Atualização Científica, v. 12,
n. 2, p. 1-7, 2000.
SILVA, F.; COELHO, J. C.; ORTIZ, K. Z. Correlação entre o processamento auditivo e a produção gráfica em escolares da 3ª série do 1º grau. Pró-Fono Revista de Atualização Científica, v. 11, n. 1, p. 42-46, 1999.
SKINNER, M. W.; MILLER, J. D. Amplification bandwidth and intelligibility of speech in quiet and noise for listeners with sensorioneural hearing loss. Audiology, v. 22, p. 253-279, 1983.
STELMACHOWICZ, P. G.; BEAUCHAINE, K. A.; KALBERER, A.; JESTEADT, W. Normative thresholds in the 8 to 20Hz range as a function of age. J. Acoustic. Soc. Am., v. 86, n. 4, p. 1384-1391, 1989.
ZANCHETTA, S.; TAZINAZZIO, T. G.; COLON, J. C.; RODRIGUES, P. M. T. A triagem do processamento auditivo central como instrumento de identificação de alterações auditivas em pré-escolares. Temas Desenvolv., v. 9, n. 50, p. 28-32, 2000.
Endereço para correspondência: Cristina Silveira Ramos