Postharvest quality changes in fresh-cut watercress stored under
conventional and inert gas-enriched modified atmosphere packaging
José Pinelaa,b, João C.M. Barreiraa,b, Lillian Barrosa, Amilcar L. Antonioa, Ana Maria Carvalhoa, M. Beatriz P.P. Oliveirab, Isabel C.F.R. Ferreiraa,*
a
Mountain Research Centre (CIMO), ESA, Polytechnic Institute of Bragança, Campus
de Santa Apolónia, 1172, 5301-855 Bragança, Portugal
b
REQUIMTE/LAQV, Faculty of Pharmacy, University of Porto, Rua Jorge Viterbo
Ferreira, nº 228, 4050-313 Porto, Portugal
* Author to whom correspondence should be addressed (Isabel C.F.R. Ferreira; e-mail:
Abstract
The effect of modified atmosphere packaging (MAP) on the postharvest quality of
fresh-cut watercress (Nasturtium officinale R. Br.) stored at 4 ºC for 7 d was studied. A
portion of watercress was immediately analyzed (non-stored control) and the remaining
fresh material was stored packaged under atmospheres enriched with N2, Ar, air, or
vacuum. The analyzed parameters included colour, total soluble solids, pH,
macronutrients, the individual profiles of sugars, organic acids, tocopherols and fatty
acids, and total phenolics and flavonoids. Furthermore, four in vitro assays were
performed to evaluate the antioxidant activity. After assessing the effect on individual
quality parameters, it was possible to conclude that air was the less efficient atmosphere
in preserving quality attributes of the non-stored control samples during cold storage. In
turn, Ar-enriched MAP was the most suitable choice to preserve the overall postharvest
quality. The present study also highlighted the nutritional and antioxidant properties of
watercress, as well as the interest of its inclusion in human diets.
Keywords: Nasturtium officinale, fresh-cut watercress, conventional packaging,
1. Introduction
As a response to consumers' demand for fresh, healthy and easy-to-prepare food
products, conjoint with consumer lifestyle changes, with little time to prepare a
convenient meal and to have a balanced diet, a wide variety of minimally processed
vegetables has been developed (Ramos et al., 2013). Among them, watercress
(Nasturtium officinale R. Br.) stands out due to its consumption since ancient times.
This perennial species of the Brassicaceae family grows in and around water and is
highly appreciated in the Mediterranean cuisine, being eaten raw in salads, soups and
other recipes (Carvalho and Morales, 2013). Apart from its interesting nutritional value
(Manchali et al., 2012; Pereira et al, 2011), this vegetable has medicinal and therapeutic
properties (Alwi et al., 2010; Casanova and Carballo, 2011; Freitas et al., 2013; Hecht et
al., 1995; Manchali et al., 2012; Sadeghi et al., 2014), mainly due to its high content in
bioactive molecules.
A limiting factor that reduces watercress consumption is its perishable nature,
characterized by a reduced shelf-life after harvest of approximately seven days (Cruz et
al., 2009; Silveira et al., 2014). The main symptoms of quality loss are surface
dehydration, softening of tissues and loss of green colour. Most conventional
postharvest treatments can’t control all parameters necessary to extend produce
shelf-life, without compromising its quality (Pinela and Ferreira, 2015). Additionally,
consumers are looking for safe food products that suffer minimal processing with high
quality retention (Ramos et al., 2013). To satisfy these requirements, it is necessary to
design appropriate and more sustainable postharvest treatments, aiming to preserve the
quality and extend the shelf-life of fresh vegetables including watercress. For this
as modified atmosphere packaging (MAP) combined with cold storage (Pinela and
Ferreira 2015).
MAP is an economical and effective technology that involves altering the air
surrounding the product in the package to another composition. Using this method, the
initial fresh state of the product may be prolonged by reducing the metabolic activity
and chemical oxidation, thus retarding compositional changes associated with
maturation and senescence, reducing microorganism growth and retaining all attributes
that consumers consider as freshness markers (Murcia et al., 2009; Niemira and Fan,
2014). Recently, the use of non-conventional argon (Ar)- and nitrogen (N2)-enriched
atmospheres has gained a considerable interest (Artés et al., 2009; Char et al., 2012). Ar
is biochemically active, probably due to its enhanced solubility in water, and appears to
interfere with enzymatic oxygen receptor sites, thus reducing metabolic activity of the
food product (Char et al., 2012). This gas has also been reported to reduce microbial
growth and to improve quality of fresh produce (Jamie and Saltveit, 2002). Regarding
N2, it has a low solubility in water and other food constituents and does not support the
growth of aerobic microbes, thereby inhibiting the growth of aerobic spoilage (Sandhya,
2010). When properly used, this technology may preserve and extend the quality of
food, allowing a longer period for commercialisation. Even so, the application of MAP
to a specific food product, such as watercress, requires further research.
A previous study demonstrated the effectiveness of non-conventional MAP in
preserving some quality attributes of fresh-cut watercress (Silveira et al., 2014).
However, no clear effect of the studied gases on colour, total polyphenols, microbial
growth, or sensory parameters was verified. In this study we explored and compared the
effects of conventional and non-conventional MAP enriched with inert gases on quality
2. Materials and methods
2.1.Standards and reagents
Acetonitrile 99.9%, n-hexane 95% and ethyl acetate 99.8% were of HPLC grade from
Fisher Scientific (Lisbon, Portugal). The fatty acids methyl ester (FAME) reference
standard mixture 37 (standard 47885-U), other individual fatty acid isomers,
tocopherols (α-, β-, and γ-isoforms), sugars (D(–)-fructose, D(+)-glucose anhydrous,
D(+)-melezitose hydrate, D(+)-sucrose), organic acids (citric, malic, oxalic and fumaric
acids), trolox (6-hydroxy-2,5,7,8-tetramethylchroman-2-carboxylic acid), gallic acid
and catechin standards were purchased from Sigma (St. Louis, MO, USA). Racemic
tocol, 50 g L-1, was purchased from Matreya (PA, USA). 2,2-Diphenyl-1-picrylhydrazyl (DPPH•) as obtained from Alfa Aesar (Ward Hill, MA, USA). All other chemicals and solvents were of analytical grade and purchased from common sources. Water was
treated in a Milli-Q water purification system (Millipore, model A10, Billerica, MA,
USA).
2.2.Sampling and samples preparation
Watercress (Nasturtium officinale R. Br.) is claimed to have nutritional and healing
properties when gathered in the proper season and phenological stage (Carvalho, 2010;
Carvalho and Morales, 2013). Therefore, wild specimens were gathered in February
2014 in a local stream in the Bragança region (Trás-os-Montes, North-eastern Portugal),
considering local consumers' sites, criteria and preferences. Subsequently, healthy and
undamaged aerial parts (stalk and leaves) were selected, rinsed in tap water and drained
to eliminate excess water. A portion of watercress was immediately analyzed
described below and analyzed in the end of the storage period. A voucher specimen was
deposited in the Herbarium of the School of Agriculture of Bragança.
2.3.Samples packaging and storage
Approximately 20 g of watercress were placed in 11.5 cm × 15 cm sterilized packages
made of low-density polyethylene film (black LDPE resin, thickness of 63 µm, the O2
transmission rate was 7.99 × 10⁻⁷ L m-2 s-1 at 25 ºC and standard pressure and the CO2
transmission rate was 2.91 × 10⁻⁶ L m-2 s-1 at the same temperature and pressure conditions (VWR, Lisbon, Portugal); the headspace volume inside the packages was
approximately 0.5 L) and packaged under four different atmospheres: (1) atmospheric
air (control in passive MAP); (2) vacuum (no atmosphere); (3) N2- enriched
atmosphere; and (4) Ar-enriched atmosphere. Briefly, air-packaging consisted of sealing
without eliminating the air in the package (20.8% O2 and <0.1% CO2) and
vacuum-packaging was performed by eliminating the air with a domestic vacuum-vacuum-packaging
machine. For non-conventional MAP, the headspace air in the packages was first
eliminated and then the target gas (100% N2 or Ar) was injected.
A total of 40 packages were prepared, 10 for each treatment, and stored in the dark at 4
ºC for 7 d.
2.4.Headspace gas analysis
The O2, CO2, and N2 concentrations inside the packages were monitored using a
portable gas analyzer (model Oxybaby 6.0, WITT, Denmark) previously calibrated by
sampling atmospheric air. Ar concentration in the packages was calculated according to
the equation: 100 - ([O2] + [CO2] + [N2]). Values were expressed as a percentage.
2.5.Physical and physicochemical analysis
For colour measurement, samples were placed on a black surface to reduce external
interferences and data were collected on nine randomly selected leaves (adaxial surface)
with a colorimeter (model CR-400; Konica Minolta Sensing Inc., Japan) previously
calibrated using the standard white plate. Using illuminant C and the diaphragm
opening of 8 mm, the CIE L*a*b* colour space values were registered through the
computerized system using a colour data software “Spectra Magic Nx” (version
CM-S100W 2.03.0006). Average values were considered to determine the colour
coordinates, where L* represents lightness, a* represents chromaticity on a green (–) to
red (+) axis, and b* represents chromaticity on a blue (–) to yellow (+) axis.
For total soluble solids (TSS) and pH determination, fresh tissue was ground and the
grinding paste was subsequently filtered through Whatman No. 4 paper. The TSS
content in the squeezed juice was measured with a digital hand refractometer (model HI
96801, Hanna Instruments, Woonsocket, RI, USA) and expressed as percentage (%).
The pH was measured with a digital pH-meter (model pH 211, Hanna Instruments,
Woonsocket, RI, USA) in the same juice.
2.6.Chemical composition analysis
Samples were analysed for moisture, proteins, fat, ash and carbohydrates using the
AOAC procedures (AOAC, 2005). Briefly, the crude protein content (N × 6.25) was
estimated by the macro-Kjeldahl method, using an automatic distillation and titration
unit (model UDK152; VELP Scientifica, Italy); the crude fat was determined by
extracting a known weight of powdered sample with petroleum ether, using a Soxhlet
carbohydrates were calculated by difference. The results were expressed as g per kg of
fresh weight. The total energy was calculated according to the equation: 4 × (mproteins +
mcarbohydrates) + 9 × (mfats) and further converted to kJ per kg of fresh weight.
Free sugars and tocopherols were determined by high performance liquid
chromatography (HPLC) coupled to a refraction index detector (RI) or to a fluorescence
detector (FP-2020; Jasco), respectively. Procedures and equipment were previously
described by Pereira et al. (2011). The identification was made by chromatographic
comparisons with authentic standards. Quantification was performed using the internal
standard method, wherein melezitose was used as internal standard for free sugars and
tocol for tocopherols. The results were expressed in mg per kg of fresh weight.
Organic acids were analyzed by ultra fast liquid chromatography (UFLC) coupled to a
photodiode array detector (PDA) according to Pereira et al. (2013). Briefly, fresh tissue
(9 g) was ground and the grinding paste was subsequently extracted by stirring with 25
mL of meta-phosphoric acid (25 ºC at 150 rpm) for 45 min and subsequently filtered
through Whatman No. 4 paper. Before analysis, samples were filtered through 0.2 µm
nylon filters. The organic acids found were quantified by comparison of the area of their
peaks recorded at 215 nm or 245 nm (for ascorbic acid) with calibration curves obtained
from commercial standards of each compound. The results were expressed in mg per kg
of fresh weight.
Fatty acids were determined by gas-liquid chromatography with flame ionization
detection (GC-FID)/capillary column. Procedures and equipment were described by
Pereira et al. (2011). The identification was made by comparing the relative retention
times of FAME peaks from samples with standards. The results were recorded and
processed using CSW 1.7 software (DataApex 1.7) and expressed in relative percentage
2.7.In vitro bioactive properties evaluation
Watercress extracts were prepared according to Pereira et al. (2011), using a mixture of
methanol:water (80:20, v/v) as extraction solvent. Briefly, a fine dried powder (20
mesh; ~1 g) was stirred (150 rpm) with 50 mL of extraction solvent for 1 h at 25 ºC.
The supernatant was filtered through Whatman No. 4 paper and the residue was
re-extracted with an additional portion of solvent (50 mL). The combined extracts were
then evaporated at 35 ºC under reduced pressure (Free Zone 4.5, Labconco; Kansas
City, MO, USA), redissolved in the same solvent (final concentration 5 g L-1) and successively diluted to different concentrations to evaluate their antioxidant activity and
the total phenolic and flavonoid content.
Four different in vitro assays were performed to evaluate the hydromethanolic extracts
antioxidant activity (Pinela et al., 2015): DPPH• scavenging activity, reducing power (measured by ferricyanide Prussian blue assay), β-carotene blanching inhibition, and
thiobarbituric acid reactive substances (TBARS) formation inhibition. Briefly, the
DPPH• scavenging activity and the reducing power assays were performed using an ELX800 Microplate Reader (Bio-Tek Instruments, Inc; Winooski, VT, USA). The
reduction of DPPH• was determined by measuring the absorbance at 515 nm and calculated as a percentage of DPPH• discolouration using the equation: [(ADPPH -
AS)/ADPPH] × 100, where ADPPH is the absorbance of the DPPH• solution and AS is the
absorbance of the solution containing the sample extract. The reducing power was
evaluated by the capacity to convert Fe3+ into Fe2+, measuring the absorbance at 690 nm. The β-carotene bleaching inhibition was evaluated by measuring the capacity to
neutralize linoleate free radicals, which was monitored at 470 nm in a Model 200
(AβT2/AβT0) × 100, where AβT2 is the absorbance of the emulsion after 2 h of incubation
at 50 ºC and AβT0 is the initial absorbance. The TBARS formation inhibition was
evaluated in porcine (Sus scrofa) brain homogenates (brains were obtained from official
slaughtered animals). The colour intensity of the malondialdehyde-thiobarbituric acid
(MDA-TBA) complex formed during heating at 80 ºC for 20 min was measured at 532
nm, and the inhibition ratio calculated using the equation: [(A - B)/A] × 100%, where A
and B correspond to the absorbance of the control and the sample solution, respectively.
All results were expressed in EC50 values (g L-1), i.e., sample concentration providing
50% of antioxidant activity or 0.5 of absorbance in the reducing power assay. Trolox
was used as positive control.
Total phenolic (Wolfe et al., 2003) and flavonoid (Jia et al., 1999) contents were
quantified according to the authors in the hydromethanolic extracts concentrated at
0.625 or 1.25 g L-1 by reading the absorbance at 765 nm or 510 nm, respectively. The standard curves were calculated using gallic acid (for phenolics) and catechin (for
flavonoids), and the results were respectively expressed as g of gallic acid equivalents
(GAE) or catechin equivalents (CE) per kg of extract.
2.8.Statistical analysis
Samples of the 10 replicates of each treatment were divided into three batches and
independently analyzed in triplicate for each quality parameter. Data were expressed as
mean±standard deviation. All statistical tests were performed at a 5% significance level
using SPSS Statistics software (IBM SPSS Statistics for Windows, Version 22.0.
Armonk, NY: IBM Corp.).
The differences among treatments were analyzed using one-way analysis of variance
distribution of the residuals and the homogeneity of variance, was tested by means of
the Shapiro Wilk’s and the Levene’s tests, respectively. All dependent variables were
compared using Tukey’s honestly significant difference (HSD) or Tamhane’s T2
multiple comparison tests, when homoscedasticity was verified or not, respectively.
Furthermore, a linear discriminant analysis (LDA) was used to evaluate the effect of the
different packaging atmospheres on the overall postharvest quality of watercress
samples. A stepwise technique, using the Wilks’ λ method with the usual probabilities
of F (3.84 to enter and 2.71 to remove), was applied for variable selection. This
procedure uses a combination of forward selection and backward elimination processes,
where the inclusion of a new variable is preceded by ensuring that all variables selected
previously remain significant (Maroco, 2003). With this approach, it is possible to
determine which of the independent variables account most for the differences in the
average score profiles of the different treatments. To verify the significance of canonical
discriminant functions, the Wilks’ λ test was applied. A leaving-one-out
cross-validation procedure was carried out to assess the model performance.
3. Results and discussion 3.1.Headspace gas composition
The initial levels of N2 and Ar inside the non-conventional packaging systems reached
values of above 98 and 95%, respectively. After 7 d of refrigerated storage, the N2
concentration inside the N2-enriched MAP decreased approximately 23%, while this gas
evolved within the Ar-enriched MAP (constituting 27% of the headspace composition).
In both MAP, the final content of CO2 and O2 were less than 16 and 9% for N2- and
Ar-enriched MAP, respectively. The final headspace gas composition of air-packaged
O2 were approximately 15 and 12%, respectively. The observed changes can be
attributed to the plant respiration and diffusion of gases through the LDPE film (Choi et
al., 2014).
3.2.Physical and physicochemical parameters
The green colour is an important attribute for the perception of watercress freshness.
Based on the one-way ANOVA p-values it is possible to conclude that the assayed
packaging atmospheres induced significant changes on L* and a* colour values, TSS
and pH; but had no effect on b* value (Table 1). Thus, the tested packaging
atmospheres did not induce watercress yellowing. The a* value was only significantly
different in samples packaged in Ar-enriched atmospheres, which reveal the highest
values, corresponding to an increased redness. Samples stored under Ar-enriched
atmospheres showed also the highest lightness (L*) values, followed by N2-enriched
MAP, air-packaging and vacuum-packaging, which showed similar values to the
non-stored control. A slight increase of lightness in watercress samples non-stored under
different non-conventional MAP was also reported by Silveira et al. (2014), but no clear
effect of the tested non-conventional gases on colour parameters was reported. Slight
increases were also found in fresh-cut red chard (Beta vulgaris var. cycla) baby leaves
as a general trend for all treatments during storage at 5 ºC for 8 d (Tomás-Callejas et al.
2011). Similarly, Char et al. (2012) also recorded an increase in lightness with the
storage time (8 d at 5 ºC) in ready-to-eat arugula (Eruca vesicaria Mill.) salads,
suggesting incipient yellowing of leaves.
The TSS content in plant tissues is mainly related to the presence of soluble sugars and
also smaller amounts of organic acids, vitamins and proteins. Table 1 shows that the
samples. On the other hand, a significant reduction in TSS index was verified in
vacuum-packaged and Ar-enriched MAP samples, probably related with
over-maturation or senescence. The utilization of free sugars in various metabolic processes
could also cause the decrease of TSS contents.
A decrease in pH values was observed in packaged samples compared to non-stored
control (Table 1). This acidification was more marked in N2-enriched MAP samples,
while air-packaging was the most appropriate treatment to maintain the initial pH value.
These results could be related to the increase of organic acids, namely malic acid, and
reduced glucose levels, probably due to fermentative processes.
3.3.Chemical composition
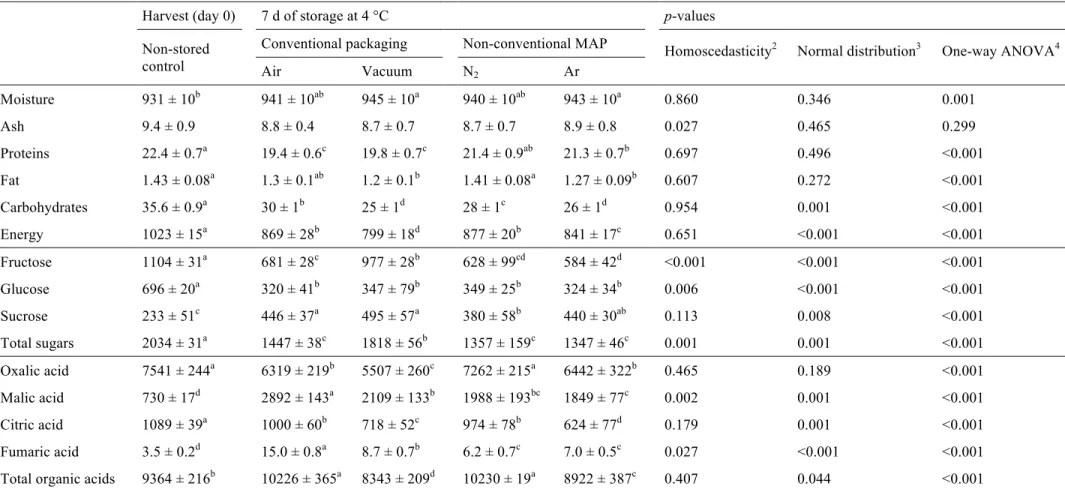
The nutritional value and the sugars profiles obtained for the different packaging
atmospheres are presented in Table 2. As it can be concluded from the one-way ANOVA p-values, the assayed packaging atmospheres induced significant changes in
all nutritional parameters and quantified sugars. The single component with similar
values for all packaging atmospheres was the ash content. In general, the moisture
content increased in packaged samples, especially in those under vacuum and
Ar-enriched atmospheres (it should be noticed that before packaging the samples were
sprayed with water). Non-conventional MAP was the best treatment to retain the protein
levels, while N2 and air atmospheres seem to be suitable choices to preserve fat content
and energetic value along storage time.
The nutritional value of watercress was already described. Pereira et al. (2011) reported
described in this study (~1023 kJ kg-1) for non-stored control samples. Other work describes a higher protein (30 g kg-1) and fat (10 g kg-1) content, but much lower values for carbohydrates (3.5 g kg-1) (Manchali et al., 2012). Nevertheless, the protein and fat contents described in this work for the non-stored control samples are very similar to
those present in the USDA National Nutrient Database for Standard Reference (23 and
1 g kg-1, respectively) (USDA, 2011). These small differences in the reported values may be explained by the use of different analytical procedures and slight differences in
the phenological stage of watercress in the collection period, as well as variations on
soil characteristics and annual climatic conditions of the locations where the samples
were collected, which may affect the plant composition during the growing season
(Nikolopoulou et al., 2007).
Fructose, glucose and sucrose were identified in watercress samples, being fructose the
most abundant. Fructose, glucose and total sugars gave the highest values in control
samples, while sucrose was higher in packaged samples, especially in those stored
under conventional packaging systems. Among treatments, vacuum-packaging retained
the highest levels of fructose, sucrose and total sugars. No significant statistical
differences were found among treatments for glucose. The decrease of fructose and
glucose contents in stored samples can be related to its use by the plant to produce the
energy required to its metabolism, once reducing sugars are the main substrates in the
respiration process. Similar results were found by Workneh et al. (2012) which reported
lower levels of glucose and an increase in the sucrose content on tomatoes during the
first 8 days of storage at 13 °C, after disinfection treatments and packaging in
micro-perforated packages. Besides these sugars, Pereira et al. (2011) also reported the
presence of trehalose and raffinose in wild samples of watercress; being sucrose the
of our non-stored control (~2034 mg kg-1), analysed immediately after harvest, was similar to that described by other authors, i.e., 2099 mg kg-1 (Pereira et al., 2011) and 2000 mg kg-1 (USDA, 2011).
Likewise, the organic acids content was also affected by the tested packaging
atmospheres. Oxalic, malic, citric and fumaric acids were detected (Table 2), being oxalic acid the most abundant. Levels of this organic acid were higher in the non-stored
control and samples stored under N2-enriched atmospheres. Citric acid was also found
in higher amounts in non-stored control samples. Regarding malic and fumaric acids,
their values were higher in air-packaged samples. In general, air-packaging and N2
-enriched MAP increased the total organic acid levels while vacuum-packaging and
Ar-enriched MAP showed lower values than the non-stored control.
Contrarily to some available results, reporting the presence of ascorbic acid in
watercress (Cruz et al., 2008 and 2009; Gonçalves et al., 2009; Pereira et al., 2011), this
vitamin was not detected in our samples or in those previously analyzed by Pereira et al.
(2013).
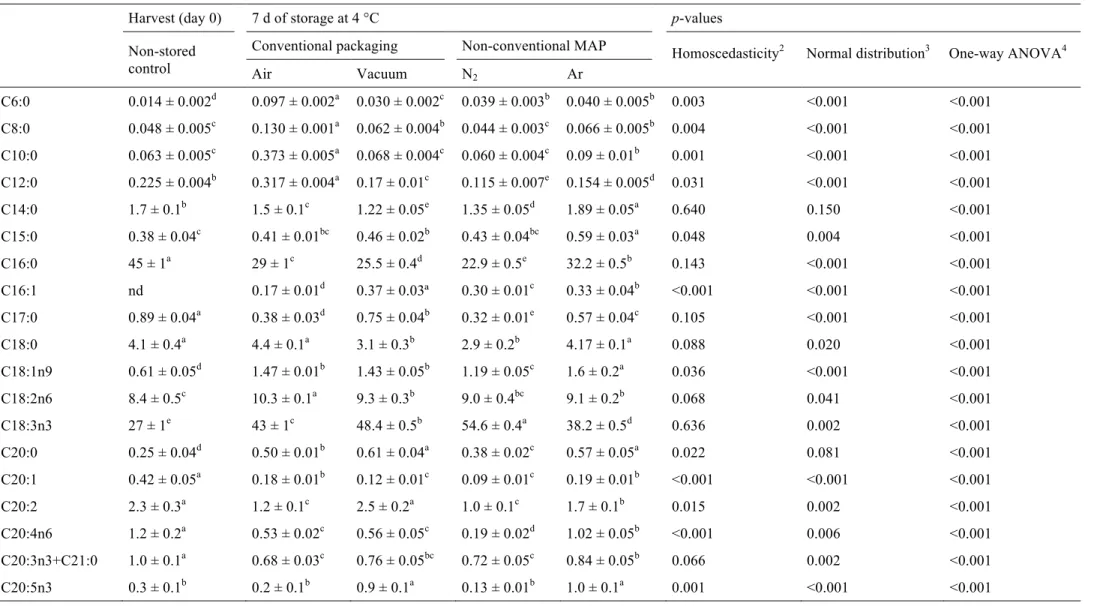
The results for fatty acids composition, total saturated fatty acids (SFA),
monounsaturated fatty acids (MUFA), polyunsaturated fatty acids (PUFA), and the
ratios of PUFA/SFA and n-6/n-3 are shown in Table 3. From the one-way ANOVA
p-values, we can conclude that the assayed packaging atmospheres induced significant
changes in the detected fatty acids and given ratios. Up to 23 fatty acids were detected
in most of the samples, being palmitic (C16:0) and α-linolenic (C18:3n3) acids the most
abundant, in agreement to Pereira et al. (2011). Palmitic acid gave lower values in
stored samples, while α-linolenic acid increased under the same conditions. Other
abundant fatty acids were linoleic (C18:2n6), stearic (C18:0), lignoceric (C24:0) and
only detected in samples submitted to refrigerated storage. SFA (~56.8%) levels were
higher than MUFA (~1.03%) and PUFA (~42.2%) in control samples. All the assayed
packaging atmospheres induced positive effects, namely an increase in MUFA and
PUFA contents and PUFA/SFA ratios, and decreased SFA levels and n-6/n-3 ratios, as
recommended for a “good nutritional quality” (Guil et al., 1996). N2-packaged samples
reveal the lowest SFA (~31.4%) content and the highest values of PUFA (~66.1%), as
well as the highest PUFA/SFA ratios (~2.11) and lowest n-6/n-3 polyunsaturated fatty
acid ratios (~0.19).
The assayed treatments induced also significant changes in the tocopherols content
(Tables 3), with the lowest values being recorded in control samples. α-Tocopherol was always the most abundant isoform, followed by γ-tocopherol and β-tocopherol, in
accordance with the results previously reported by Pereira et al. (2011). Air-packaged
samples reveal the highest content of α- and β-tocopherol, and total tocopherols content.
The highest values for γ-tocopherol were shown by the vacuum-packaged samples. In
general, non-conventional MAP was able to maintain similar levels of β- and γ-
isoforms, comparatively with the non-stored control, whilst vacuum-packaging
presented the closest ones regarding the total tocopherols content. According to the
literature, stress conditions can induce an increase in the total tocopherol levels (
Munné-Bosch, 2005; Yusuf et al., 2010). In these situations, there is an increase in tocopherol
synthesis, followed by a net tocopherol loss. The initial enhanced tocopherol levels
contribute to tissue protection by reducing reactive oxygen species levels and inhibiting
lipid peroxidation, thus avoiding oxidative damage (Munné-Bosch, 2005). Additionally,
α-tocopherol plays a major role in the alleviation of stress, and its levels change
significantly under stress (such as that induced by the different packaging conditions),
(Munné-Bosch, 2005). Thus, tocopherol increases verified in this work can be related to
the assayed packaging atmosphere incapacity to maintain favourable preservation
conditions to watercress. Nevertheless, the observed increase contributes to a higher
bioactivity.
3.4.In vitro bioactive properties
Table 4 presents the values for antioxidant activity and total phenolic and flavonoid contents of the watercress extracts. From the one-way ANOVA p-values, it can be
concluded that the assayed packaging atmospheres induced significant changes in these
parameters. Non-stored control samples showed the highest DPPH• scavenging activity, reducing power and β-carotene blanching inhibition capacity. Regarding the assayed
packaging atmospheres, Ar-enriched MAP were the best treatment to preserve the
DPPH• scavenging activity and β-carotene blanching inhibition capacity, showing also an increase in the total phenolics content. In turn, samples under N2-enriched MAP
present lower lipid peroxidation inhibition capacity, despite the high levels of total
phenolics and flavonoids. The TBARS formation inhibition capacity was improved by
conventional packaging relatively to the non-stored control samples. However,
air-packaging gave the highest EC50 values (corresponding to the lowest antioxidant
activity) in the DPPH• and reducing power assays.
Similar phenolic (96-97 g GAE kg-1 extract) and higher flavonoid (62-63 g CE kg-1 extract) contents were reported by Yazdanparast et al. (2008) and Bahramikia and
Yazdanparast (2010) in hydro-ethanolic extracts of a watercress sample from Iran, as
well as analogous TBARS inhibition properties (0.27 g L-1). On the other hand, the study conducted by Pereira et al. (2011) reported lower values for phenolics (~50.42 g
kg-1 extract) in methanolic extracts. Regarding its antioxidant performance, assessed using the same in vitro methodologies, only the DPPH• scavenging capacity gave better results (~0.13 g L-1) in comparison with our hydromethanolic extracts (except for the N2-packaged sample which showed a higher EC50 value in the TBARS assay).
Regarding the effect of non-conventional MAP on the total polyphenols content of
watercress, Silveira et al. (2014) reported initial contents of ~2 g GAE kg-1 extract (obtained after homogenizing 1 g of frozen watercress with 3 mL of methanol/water
(4:1, v/v)), where the lowest value corresponded to the samples packaged in N2
-enriched atmospheres. They also found maintenance on polyphenol levels during 13
days of storage, with the same trend observed at the beginning of the experiment, and
higher levels in air-packaged and Ar-enriched MAP samples. An antioxidant activity
increase was verified in He and N2O packaged samples at the end of the storage period.
Tomás-Callejas et al. (2011) reported an increase of 61% in the polyphenol content of
red chard stored under N2-enriched MAP for 6 d and attributed this behavior to the
wound-induced phenomenon in phenolic metabolism.
3.5.Overall postharvest quality assessment using LDA
After evaluating the effects on individual quality parameters, a LDA was applied to
obtain a complete perspective about the effects of MAP on the overall postharvest
quality of fresh-cut watercress. The basic purpose of this discriminant analysis was
finding the packaging atmosphere (categorical dependent variable) that maintained
physicochemical, nutritional and antioxidant profiles (set of quantitative independent
variables) of the non-stored control samples throughout the storage time. The significant
according to the Wilks’ λ test. Only variables with a statistically significant
classification performance (p < 0.05) were kept in the analysis.
The discriminant model selected 4 significant functions, which included 100.0% of the
observed variance. The graph representation (Figure 1) of the three first functions
(function 1: 67.7%, function 2: 19.0%, function 3: 8.0%) showed the complete
individualization of markers corresponding to each packaging atmosphere. Function 1,
mainly correlated with C18:3 and β-carotene bleaching inhibition, as deduced from the
canonical discriminant functions standardized coefficients, separated primarily
air-packaged and N2-enriched MAP samples, which were also placed far from the
non-stored control samples through function 2 (more correlated to capric acid (C10:0) and
C18:3). Function 3, more powerfully correlated with TBARS formation inhibition and
MUFA content, clarified that air-packaged samples were those with the most dissimilar
chemical and antioxidant profiles, in comparison to the non-stored control samples. The
complete individualization of the four packaging atmospheres (100.0% of the assayed
species for the originally grouped cases as well as for the cross-validated cases)
indicates their lack of effectiveness in maintaining the original quality attributes of the
non-stored watercress samples during refrigerated storage.
4. Conclusions
None of the tested packaging atmospheres induced watercress yellowing. In general,
sucrose levels increased with refrigerated storage, especially in samples under
conventional packaging; while vacuum-packaging preserved the highest levels of
fructose and total sugars. Tocopherols also increased in stored samples, being the
highest levels of α-, β- and total tocopherols recorded in air-packaged samples, which
MUFA and PUFA contents and PUFA/SFA ratios and lower SFA levels and n-6/n-3
ratios. Furthermore, Ar-enriched MAP was the best option to preserve the DPPH• scavenging activity and β-carotene blanching inhibition capacity, as well as to increase
the total phenolic content. Based on the LDA, it was possible to conclude that
air-packaged samples were those that presented the most dissimilar profiles from the
non-stored control samples, followed by those non-stored under N2-enriched MAP. In turn,
Ar-enriched MAP was the most suitable choice to preserve the overall postharvest quality
of fresh-cut watercress. The present study also highlights the nutritional and
health-promoting composition of these wild watercress samples, as well as the interest of its
inclusion in traditional and modern diets. Despite these findings, further studies are of
interest to evaluate other quality attributes as well as physiological parameters.
Acknowledgements
The authors are grateful to the Foundation for Science and Technology (FCT, Portugal)
for financial support to CIMO (PEst-OE/AGR/UI0690/2014), REQUIMTE
(UID/QUI/50006/2013), J. Pinela (SFRH/BD/92994/2013), J.C.M. Barreira
(SFRH/BPD/72802/2010) and L. Barros (“Compromisso para a Ciência 2008”
References
Alwi, S.S.S., Cavell, B.E., Telang, U., Morris, M.E., Parry, B.M., Packham, G., 2010.
In vivo modulation of 4E binding protein 1 (4E-BP1) phosphorylation by
watercress: a pilot study. Br. J. Nutr. 104, 1288-1296.
AOAC, 2005. Official methods of analysis of AOAC international, 18th ed. AOAC International, Gaithersburg, MD, USA.
Artés, F., Gómez, P., Aguayo, E., Escalona, V., Artés-Hernández, F., 2009. Sustainable
sanitation techniques for keeping quality and safety of fresh-cut plant
commodities. Postharvest Biol. Tec. 51, 287-296.
Bahramikia, S., Yazdanparast, R., 2010. Antioxidant efficacy of Nasturtium officinale
extracts using various in vitro assay systems. J. Acupunct. Meridian Stud., 3,
283-290.
Carvalho, A.M., 2010. Plantas y sabiduría popular del Parque Natural de Montesinho.
Un estudio etnobotánico en Portugal. Biblioteca de Ciencias nº. 35. Consejo
Superior de Investigaciones Científicas, Madrid, España.
Carvalho, A.M., Morales, R., 2013. Persistence of wild food and wild medicinal plant
knowledge in a North-Eastern region of Portugal, in Pardo de Santayana, M.,
Pieroni, A., Puri, R. (Eds.), Ethnobotany in the New Europe: People, health and
wild plant resources, Berghahn Books, Oxford, UK, pp. 147-171.
Casanova, N.A., Carballo, M.A., 2011. Antigenotoxic activity of watercress extract in
an in vitro mammalian system using comet assay. Phytother. Res. 25, 1743-1746.
Char, C., Silveira, A.C., Inestroza-Lizardo, C., Hinojosa, A., Machuca, A., Escalona,
V.H., 2012. Effect of noble gas-enriched atmospheres on the overall quality of
Cruz, R.M.S., Vieira, M.C., Silva, C.L.M., 2009. Effect of cold chain temperature
abuses on the quality of frozen watercress (Nasturtium officinale R. Br.). J. Food
Eng. 94, 90-97.
Cruz, R.M.S., Vieira, M.C., Silva, C.L.M., 2008. Effect of heat and thermosonication
treatments on watercress (Nasturtium officinale) vitamin C degradation kinetics.
Innov. Food Sci. Emerg. Technol. 9, 483-488.
Freitas, E., Aires, A., Santos Rosa, E.A., Saavedra, M.J., 2013. Antibacterial activity
and synergistic effect between watercress extracts, 2-phenylethyl isothiocyanate
and antibiotics against 11 isolates of Escherichia coli from clinical and animal
source. Lett. Appl. Microbiol. 57, 266-273.
Gonçalves, E.M., Cruz, R.M.S., Abreu, M., Brandão, T.R.S., Silva, C.L.M., 2009.
Biochemical and colour changes of watercress (Nasturtium officinale R. Br.)
during freezing and frozen storage. J. Food Eng. 93, 32-39.
Guil, J.L., Torija, M.E., Giménez, J.J., Rodríguez, I., 1996. Identification of fatty acids
in edible wild plants by gas chromatography. J. Chromatogr. A 719, 229-235.
Hecht, S.S., Chung, F.-L., Richie, J.P. Jr, Akerkar, S.A., Borukhova, A., Skowronski,
L., Carmella, S.G., 1995. Effects of watercress consumption on metabolism of a
tobacco-specific lung carcinogen in smokers. Cancer Epidemiol. Biomarkers
Prev. 4, 877-884.
Jamie, P., Saltveit, M.E., 2002. Postharvest changes in broccoli and lettuce during
storage in argon, helium, and nitrogen atmospheres containing 2% oxygen.
Postharvest Biol. Tec. 26, 113-116.
Jia, Z., Tang, M., Wu, J., 1999. The determination of flavonoid contents in mulberry
Koseki, P.M., Villavicencio, A.L.C.H., Brito, M.S., Nahme, L.C., Sebastião, K.I., Rela,
P.R., Almeida-Muradian, L.B., Mancini-Filho, J., Freitas, P.C.D., 2002. Effects
of irradiation in medicinal and eatable herbs. Radiat. Phys. Chem. 63, 681-684.
Manchali, S., Murthy, K.N.C., Patil, B.S., 2012. Crucial facts about health benefits of
popular cruciferous vegetables. J. Funct. Foods 4, 94-106.
Maroco, J., 2003. Análise Estatística, com utilização do SPSS. Edições Sílabo, Lisboa,
Portugal.
Martins, C.G., Behrens, J.H., Destro, M.T., Franco, B.D.G.M., Vizeu, D.M., Hutzler,
B., Landgraf, M., 2004. Gamma radiation in the reduction of Salmonella spp.
inoculated on minimally processed watercress (Nasturtium officinale). Radiat.
Phys. Chem. 71, 87-91.
Munné-Bosch, S., 2005. The role of α-tocopherol in plant stress tolerance. J. Plant
Physiol. 162, 743-748.
Murcia, M.A., Jiménez-Monreal, A.M., García-Diz, L., Carmona, M., Maggi, L.,
Martínez-Tomé, M., 2009. Antioxidant activity of minimally processed (in
modified atmospheres), dehydrated and ready-to-eat vegetables. Food Chem.
Toxicol. 47, 2103-2110.
Niemira, B.A., Fan, X., 2014. Fruits and vegetables: Advances in processing
technologies to preserve and enhance the safety of fresh and fresh-cut fruits and
vegetables, in Batt, C.A., Tortorello, M.L. (Eds.), Encyclopedia of Food
Microbiology, 2nd ed., Academic Press, USA, pp. 983-991.
Nikolopoulou, D., Grigorakis, K., Stasini, M., Alexis, M.N., Iliadis, K., 2007.
Differences in chemical composition of field pea (Pisum sativum) cultivars:
Pereira, C., Barros, L., Carvalho, A.M., Ferreira, I.C.F.R., 2011. Nutritional
composition and bioactive properties of commonly consumed wild greens:
Potential sources for new trends in modern diets. Food Res. Int. 44, 2634-2640.
Pereira, C., Barros, L., Carvalho, A.M., Ferreira, I.C.F.R., 2013. Use of UFLC-PDA for
the analysis of organic acids in thirty-five species of food and medicinal plants.
Food Anal. Method. 6, 1337-1344.
Pinela, J., Ferreira, I.C.F.R., 2015. Non-thermal physical technologies to decontaminate
and extend the shelf-life of fruits and vegetables: Trends aiming at quality and
safety. Crit Rev Food Sci Nutr. DOI:10.1080/10408398.2015.1046547
Pinela, J., Antonio, A.L., Barros, L., Barreira, J.C.M., Carvalho, A.M., Oliveira,
M.B.P.P., Santos-Buelga, C., Ferreira, I.C.F.R., 2015. Combined effects of
gamma-irradiation and preparation method on antioxidant activity and phenolic
composition of Tuberaria lignosa. RSC Adv. 5, 14756-14767.
Ramos, B., Miller, F.A., Brandão, T.R.S., Teixeira, P., Silva, C.L.M., 2013. Fresh fruits
and vegetables - An overview on applied methodologies to improve its quality
and safety. Innov. Food Sci. Emerg. Technol. 20, 1-15.
Sadeghi, H., Mostafazadeh, M., Sadeghi, H., Naderian, M., Barmak, M.J.,
Talebianpoor, M.S., Mehraban, F., 2014. In vivo anti-inflammatory properties of
aerial parts of Nasturtium officinale. Pharm. Biol. 52, 169-174.
Sandhya, 2010. Modified atmosphere packaging of fresh produce: Current status and
future needs. LWT - Food Sci. Technol. 43, 381-392.
Silveira, A.C., Araneda, C., Hinojosa, A., Escalona, V.H., 2014. Effect of
non-conventional modified atmosphere packaging on fresh cut watercress (Nasturtium
Tomás-Callejas, A., Boluda, M., Robles, P.A., Artés, F., Artés-Hernández, F., 2011.
Innovative active modified atmosphere packaging improves overall quality of
fresh-cut red chard baby leaves. LWT - Food Sci. Technol. 44, 1422-1428.
Trigo, M.J., Sousa, M.B., Sapata, M.M., Ferreira, A., Curado, T., Andrada, L., Botelho,
M.L., Veloso, M.G., 2009. Radiation processing of minimally processed
vegetables and aromatic plants. Radiat. Phys. Chem. 78, 659-663.
USDA, 2011. USDA, National Nutrient Database for Standard Reference, Beltsville,
USA. Release 27. Available at: http://ndb.nal.usda.gov/ndb/foods/show/3294.
Accessed 5 January 2015.
Wolfe, K., Wu, X., Liu, R.H., 2003. Antioxidant activity of apple peels. J. Agr. Food
Chem. 51, 609-614.
Workneh, T.S., Osthoff, G., Steyn, M., 2012. Effects of preharvest treatment,
disinfections, packaging and storage environment on quality of tomato. J. Food
Sci. Tec. 49, 685-694.
Yazdanparast, R., Bahramikia, S., Ardestani, A., 2008. Nasturtium officinale reduces
oxidative stress and enhances antioxidant capacity in hypercholesterolaemic rats.
Chem.-Biol. Interact. 172, 176-184.
Yusuf, M.A., Kumar, D., Rajwanshi, R., Strasser, R.J., Tsimilli-Michael, M.,
Govindjee, Sarin, N.B., 2010. Overexpression of γ-tocopherol methyl transferase
gene in transgenic Brassica juncea plants alleviates abiotic stress: Physiological
and chlorophyll a fluorescence measurements. Biochim. Biophys. Acta, 1797,
Figure captions
Table 1Colour parameters, TSS (%) and pH values for fresh-cut watercress samples stored under conventional and inert gas-enriched MAP.1
Harvest (day 0) 7 d of storage at 4 °C p-values
Non-stored control Conventional packaging Non-conventional MAP Homoscedasticity2 Normal distribution3 One-way ANOVA4
Air Vacuum N2 Ar
L* 39 ± 3c 45 ± 2b 41 ± 2c 46 ± 3ab 49 ± 4a 0.t002 0.390 <0.001
a* -17 ± 2b -18 ± 1b -17 ± 2b -17 ± 1b -14 ± 2a 0.720 0.033 <0.001
b* 27 ± 2 31 ± 4 27 ± 3 30 ± 3 31 ± 5 0.204 0.016 0.050
TSS 3.4 ± 0.1a 3.2 ± 0.1b 2.9 ± 0.1c 3.5 ± 0.1a 3.0 ± 0.1c 0.253 0.011 <0.001
pH 5.49 ± 0.04a 5.40 ± 0.05b 5.36 ± 0.04c 5.23 ± 0.03d 5.32 ± 0.04c 0.575 0.484 <0.001
1
The results are presented as the mean±SD. 2Homoscedasticity among packaging systems was tested by the Levene test: homoscedasticity, p>0.05; heteroscedasticity, p<0.05. 3Normal distribution of the residuals was evaluated using Shapiro-Wilk test. 4p<0.05 indicates that the mean value of the evaluated parameter of at least one packaging atmosphere differs from the others (in this case multiple comparison tests were performed). For each storage condition, means within a row with different letters differ significantly (p<0.05).
Table 2 Proximate composition (g kg-1
), energetic value (kJ kg-1), individual sugars (mg kg-1) and organic acids (mg kg-1) for fresh-cut watercress samples stored under conventional and inert gas-enriched MAP.1
Harvest (day 0) 7 d of storage at 4 °C p-values
Non-stored
control
Conventional packaging Non-conventional MAP
Homoscedasticity2 Normal distribution3 One-way ANOVA4
Air Vacuum N2 Ar
Moisture 931 ± 10b 941 ± 10ab 945 ± 10a 940 ± 10ab 943 ± 10a 0.860 0.346 0.001
Ash 9.4 ± 0.9 8.8 ± 0.4 8.7 ± 0.7 8.7 ± 0.7 8.9 ± 0.8 0.027 0.465 0.299
Proteins 22.4 ± 0.7a 19.4 ± 0.6c 19.8 ± 0.7c 21.4 ± 0.9ab 21.3 ± 0.7b 0.697 0.496 <0.001
Fat 1.43 ± 0.08a 1.3 ± 0.1ab 1.2 ± 0.1b 1.41 ± 0.08a 1.27 ± 0.09b 0.607 0.272 <0.001
Carbohydrates 35.6 ± 0.9a 30 ± 1b 25 ± 1d 28 ± 1c 26 ± 1d 0.954 0.001 <0.001
Energy 1023 ± 15a 869 ± 28b 799 ± 18d 877 ± 20b 841 ± 17c 0.651 <0.001 <0.001
Fructose 1104 ± 31a 681 ± 28c 977 ± 28b 628 ± 99cd 584 ± 42d <0.001 <0.001 <0.001
Glucose 696 ± 20a 320 ± 41b 347 ± 79b 349 ± 25b 324 ± 34b 0.006 <0.001 <0.001
Sucrose 233 ± 51c 446 ± 37a 495 ± 57a 380 ± 58b 440 ± 30ab 0.113 0.008 <0.001
Total sugars 2034 ± 31a 1447 ± 38c 1818 ± 56b 1357 ± 159c 1347 ± 46c 0.001 0.001 <0.001
Oxalic acid 7541 ± 244a 6319 ± 219b 5507 ± 260c 7262 ± 215a 6442 ± 322b 0.465 0.189 <0.001
Malic acid 730 ± 17d 2892 ± 143a 2109 ± 133b 1988 ± 193bc 1849 ± 77c 0.002 0.001 <0.001
Citric acid 1089 ± 39a 1000 ± 60b 718 ± 52c 974 ± 78b 624 ± 77d 0.179 0.001 <0.001
Fumaric acid 3.5 ± 0.2d 15.0 ± 0.8a 8.7 ± 0.7b 6.2 ± 0.7c 7.0 ± 0.5c 0.027 <0.001 <0.001
Total organic acids 9364 ± 216b 10226 ± 365a 8343 ± 209d 10230 ± 19a 8922 ± 387c 0.407 0.044 <0.001
1
Table 3Fatty acids (relative percentage) and tocopherols (mg kg-1
) for fresh-cut watercress samples stored under conventional and inert gas-enriched MAP.1
Harvest (day 0) 7 d of storage at 4 °C p-values
Non-stored
control
Conventional packaging Non-conventional MAP
Homoscedasticity2 Normal distribution3 One-way ANOVA4
Air Vacuum N2 Ar
C6:0 0.014 ± 0.002d 0.097 ± 0.002a 0.030 ± 0.002c 0.039 ± 0.003b 0.040 ± 0.005b 0.003 <0.001 <0.001
C8:0 0.048 ± 0.005c 0.130 ± 0.001a 0.062 ± 0.004b 0.044 ± 0.003c 0.066 ± 0.005b 0.004 <0.001 <0.001
C10:0 0.063 ± 0.005c 0.373 ± 0.005a 0.068 ± 0.004c 0.060 ± 0.004c 0.09 ± 0.01b 0.001 <0.001 <0.001
C12:0 0.225 ± 0.004b 0.317 ± 0.004a 0.17 ± 0.01c 0.115 ± 0.007e 0.154 ± 0.005d 0.031 <0.001 <0.001
C14:0 1.7 ± 0.1b 1.5 ± 0.1c 1.22 ± 0.05e 1.35 ± 0.05d 1.89 ± 0.05a 0.640 0.150 <0.001
C15:0 0.38 ± 0.04c 0.41 ± 0.01bc 0.46 ± 0.02b 0.43 ± 0.04bc 0.59 ± 0.03a 0.048 0.004 <0.001
C16:0 45 ± 1a 29 ± 1c 25.5 ± 0.4d 22.9 ± 0.5e 32.2 ± 0.5b 0.143 <0.001 <0.001
C16:1 nd 0.17 ± 0.01d 0.37 ± 0.03ª 0.30 ± 0.01c 0.33 ± 0.04b <0.001 <0.001 <0.001
C17:0 0.89 ± 0.04a 0.38 ± 0.03d 0.75 ± 0.04b 0.32 ± 0.01e 0.57 ± 0.04c 0.105 <0.001 <0.001
C18:0 4.1 ± 0.4a 4.4 ± 0.1a 3.1 ± 0.3b 2.9 ± 0.2b 4.17 ± 0.1a 0.088 0.020 <0.001
C18:1n9 0.61 ± 0.05d 1.47 ± 0.01b 1.43 ± 0.05b 1.19 ± 0.05c 1.6 ± 0.2a 0.036 <0.001 <0.001
C18:2n6 8.4 ± 0.5c 10.3 ± 0.1a 9.3 ± 0.3b 9.0 ± 0.4bc 9.1 ± 0.2b 0.068 0.041 <0.001
C18:3n3 27 ± 1e 43 ± 1c 48.4 ± 0.5b 54.6 ± 0.4a 38.2 ± 0.5d 0.636 0.002 <0.001
C20:0 0.25 ± 0.04d 0.50 ± 0.01b 0.61 ± 0.04a 0.38 ± 0.02c 0.57 ± 0.05a 0.022 0.081 <0.001
C20:1 0.42 ± 0.05a 0.18 ± 0.01b 0.12 ± 0.01c 0.09 ± 0.01c 0.19 ± 0.01b <0.001 <0.001 <0.001
C20:2 2.3 ± 0.3a 1.2 ± 0.1c 2.5 ± 0.2a 1.0 ± 0.1c 1.7 ± 0.1b 0.015 0.002 <0.001
C20:4n6 1.2 ± 0.2a 0.53 ± 0.02c 0.56 ± 0.05c 0.19 ± 0.02d 1.02 ± 0.05b <0.001 0.006 <0.001
C20:3n3+C21:0 1.0 ± 0.1a 0.68 ± 0.03c 0.76 ± 0.05bc 0.72 ± 0.05c 0.84 ± 0.05b 0.066 0.002 <0.001
C22:0 1.3 ± 0.1a 0.9 ± 0.1b 0.90 ± 0.05b 0.85 ± 0.03b 1.26 ± 0.05a 0.006 <0.001 <0.001
C22:2 1.6 ± 0.1a 0.57 ± 0.01b 0.18 ± 0.01d 0.34 ± 0.03c 0.53 ± 0.05b <0.001 <0.001 <0.001
C24:0 2.8 ± 0.2a 2.6 ± 0.1a 1.7 ± 0.1b 2.0 ± 0.1b 2.7 ± 0.2a 0.368 0.065 <0.001
C24:1 nd 0.8 ± 0.1c 0.93 ± 0.05bc 1.02 ± 0.05b 1.21 ± 0.05a <0.001 <0.001 <0.001
SFA 57 ± 1a 40 ± 1c 34.6 ± 0.5d 31.4 ± 0.3e 44 ± 1b 0.218 <0.001 <0.001
MUFA 1.0 ± 0.1d 2.6 ± 0.2c 2.85 ± 0.05b 2.59 ± 0.05c 3.3 ± 0.1a 0.002 <0.001 <0.001
PUFA 42 ± 1e 57 ± 1c 63 ± 1b 66 ± 1a 52 ± 1d 0.280 <0.001 <0.001
PUFA/SFA 0.74 ± 0.02e 1.41 ± 0.05c 1.81 ± 0.04b 2.11 ± 0.03a 1.18 ± 0.03d 0.163 0.003 <0.001
n-6/n-3 0.47 ± 0.03a 0.28 ± 0.01c 0.25 ± 0.01d 0.19 ± 0.01e 0.31 ± 0.01b 0.001 <0.001 <0.001
α-tocopherol 5.0 ± 0.3d 12.4 ± 0.8a 7.9 ± 0.1c 11.2 ± 0.8b 10.7 ± 0.1b <0.001 0.001 <0.001
β-tocopherol 0.11 ± 0.01b 0.18 ± 0.02a 0.10 ± 0.01bc 0.09 ± 0.01c 0.09 ± 0.01c 0.073 <0.001 <0.001
γ-tocopherol 0.38 ± 0.03d 0.63 ± 0.04b 0.70 ± 0.05a 0.51 ± 0.05c 0.43 ± 0.03d 0.306 0.017 <0.001
Total tocopherols 5.5 ± 0.4d 13.2 ± 0.8a 8.7 ± 0.1c 11.8 ± 0.8b 11.2 ± 0.1b <0.001 0.001 <0.001
1
The results are presented as the mean±SD. 2Homoscedasticity among packaging systems was tested by the Levene test: homoscedasticity, p>0.05; heteroscedasticity, p<0.05. 3Normal distribution of the residuals was evaluated using Shapiro-Wilk test. 4p<0.05 indicates that the mean value of the evaluated parameter of at least one storage atmosphere differs from the others (in this case multiple comparison tests were performed). For each storage condition, means within a row with different letters differ significantly (p<0.05).
Table 4Antioxidant activity (EC50 values, g L-1
) and total phenolics (g GAE kg-1 extract) and flavonoids (g CE kg-1 extract) for fresh-cut watercress samples stored under conventional and inert gas-enriched MAP.1
Harvest (day 0) 7 d of storage at 4 °C p-values
Non-stored
control
Conventional packaging Non-conventional MAP
Homoscedasticity2 Normal distribution3 One-way ANOVA4
Air Vacuum N2 Ar
DPPH• scavenging activity 0.49 ± 0.01e 0.81 ± 0.01a 0.65 ± 0.01c 0.67 ± 0.02b 0.61 ± 0.02d 0.001 0.002 <0.001
Reducing power 0.38 ± 0.01e 0.48 ± 0.01a 0.43 ± 0.01d 0.46 ± 0.01c 0.47 ± 0.01b <0.001 <0.001 <0.001
β-carotene blanching inhibition 0.33 ± 0.02e 0.62 ± 0.01b 0.50 ± 0.02c 0.75 ± 0.01a 0.42 ± 0.01d 0.008 0.007 <0.001
TBARS formation inhibition 0.27 ± 0.01b 0.21 ± 0.01d 0.24 ± 0.01c 0.43 ± 0.01a 0.26 ± 0.01b 0.001 <0.001 <0.001
Total phenolics 87 ± 2c 97 ± 2b 99 ± 4b 108 ± 2a 105.8 ± 0.3a <0.001 0.008 <0.001
Total flavonoids 36 ± 1a 25 ± 1c 25 ± 1c 28 ± 1b 26 ± 1c <0.001 <0.001 <0.001
1
The results are presented as the mean±SD. 2Homoscedasticity among packaging systems was tested by the Levene test: homoscedasticity, p>0.05; heteroscedasticity, p<0.05. 3Normal distribution of the residuals was evaluated using Shapiro-Wilk test. 4p<0.05 indicates that the mean value of the evaluated parameter of at least one packaging atmosphere differs from the others (in this case multiple comparison tests were performed). For each storage condition, means within a row with different letters differ significantly (p<0.05).