ENGINEERING STUDENTS
PERFORMANCE FROM ACADEMIC DATA
⋆M. Dom´ınguez1
, R. Vilanova2
, M.A. Prada1
, J. Vicario2
, M. Barbu3
, M. J.
Varanda4
, M. Podpora5
, U. Spagnolini6
, P. Alves4
, and A. Paganoni6
1
Universidad de Le´on (SPAIN)
{manuel.dominguez, mapram}@unileon.es
2
Universitat Aut`onoma de Barcelona (SPAIN)
{Ramon.Vilanova, Jose.Vicario}@uab.cat
3
University Dun˘area de Jos, Galat¸i (ROMANIA)
4
Instituto Politecnico de Bragan¸ca (PORTUGAL)
{mjoao,palves}@ipb.pt
5
Opole University of Technology (POLAND)
6
Politecnico di Milano (ITALY)
{Umberto.Spagnolini,anna.paganoni}@polimi.it
Abstract. This paper presents the steps conducted to design and de-velop an IT Tool for Visual Data Analysis within the SPEET (Student Profile for Enhancing Engineering Tutoring) ERASMUS+ project. The proposed goals are to provide insight into student behaviours, to iden-tify patterns and relevant factors of academic success, to facilitate the discovery and understanding of profiles of engineering students, and to analyse the differences across European institutions. For that purpose, the concepts and methods used for the visual analysis of educational data are reviewed and a tool is proposed, which implements approaches based on visual interaction.
Keywords: Visual Analytics·Academic Data·Dimensionality Reduc-tion.
1
Introduction
The vast amount of data collected by higher education institutions and the grow-ing availability of analytic tools, makes it increasgrow-ingly interestgrow-ing to apply data analysis in order to support educational or managerial goals. The SPEET (Stu-dent Profile for Enhancing Engineering Tutoring) project aims to determine and categorise the different profiles for engineering students across Europe, in order to improve tutoring actions so that this can help students to achieve better re-sults and to complete the degree successfully [2]. For that purpose, it is proposed
to perform an analysis of student record data, obtained from the academic offices of the Engineering Schools/Faculties.
The application of machine learning techniques to provide a, somewhat au-tomatic, analysis of academic data is a common approach in the fields of Educa-tional Data Mining (EDM) and Learning Analytics (LA). Nevertheless, it is also often interesting to involve the human analyst in the task of knowledge discov-ery [10, 14]. Indeed, visual analysis approaches have been used to analyze multi-dimensional data from on-line educational environments, such as performance in exams or assignments, behaviour patterns, access to resources, tutor-student interaction, etc. [11].
Visual analytics, understood as a blend of information visualisation and ad-vanced computational methods, is useful for the analysis and understanding of complex processes, especially when data are nonhomogeneous or noisy [6]. The reason is that taking advantage of the ability of humans to detect structure in complex visual presentations, as well as their flexibility and ability to apply prior knowledge, facilitates the process aimed to understand the data, to identify their nature, and to create hypotheses [7].
For that purpose, visual analytics uses several strategies, such as pre-attentive processing and visual recall, that reduce cognitive load [15]. But a key feature is the interactive manipulation of resources, which is used to drive a semi-automated analytical process that enables a dialogue between the human and the tool. During this human-in-the-loop process, analysts iteratively update their understanding of data, to meet the evidence discovered through exploration [4]. The joint display of several interconnected visualisations is known to be in-teresting for visual analytics [7]. On the other hand, dimensionality reduction [8] is an unsupervised learning approach that is commonly used for multivariate data visualisation. Since it aims at representing high-dimensional data in low-dimensional spaces, while preserving most of its structure, the resulting
projec-tion can be visualised as a scatterplot. By means of thespatialisation principle,
which assumes that closeness in the representation can be assimilated to high similarity in the original space, an intuitive recognition of salient patterns in that scatterplot is possible [4, 13].
This paper presents the conceptualisation of a practical tool for visual data
analysis within the SPEET7
ERASMUS+ project. The goals are to provide sup-port to the staff involved in tutoring, facilitating the exploratory analysis of performance-related student data to discover and understand student profiles. For that purpose, the tool is based on the combination of visualisation, interac-tion and machine learning techniques.
For the implementation details and validation of the tool, a data set has been proposed. It only includes variables present in a typical student record, such as the details of the student (such as, for example, age, geographical information, previous studies and family background), school, degree, courses undertaken, scores, etc. Although the scope of this data set is limited, similar data structures
7
have recently been used in developments oriented to the prediction of perfor-mance and detection of drop-outs or students at risk [12].
The paper discusses the suitability of visual analytics for the exploration of academic data, presents the background of this endeavour, describes the ap-proaches proposed for the analysis of the available data, and outlines the key elements of the implementation.
2
Background
2.1 The SPEET Project
SPEET is an European project funded under the ERASMUS+ programme as a Strategic Partnership for higher education. The partnership includes universities from Spain, Portugal, Italy, Poland and Romania:
– Spain: Universitat Aut`onoma de Barcelona (UAB) and Universidad de Le´on
(ULEON)
– Romania: University Dun˘area de Jos, Galat¸i (GALATI)
– Portugal: Instituto Politecnico de Bragan¸ca (IPB)
– Poland: Opole University of Technology (OPOLE)
– Italy: Politecnico di Milano (POLIMI)
The final aim of this project is to determine and categorise the different profiles for engineering students across Europe. The main rationale behind this proposal is the observation that students’ performance seems to follow some classification according to their behaviour while conducting their studies. Also the observation that this knowledge would be a valuable help for tutors to better know their students and improve counselling actions. On the basis of this sce-nario, an opportunity emerges from the synergy among (a) the great amount of academic data currently available at the academic offices of faculties and schools, and (b) the growing availability of data science approaches to analyse data and to extract knowledge.
Therefore, the main objective of this project is to apply data analysis al-gorithms to process these data in order to identify and to extract information about student profiles. In this scope, the considered profiles are, e.g., students that will finish degree on time, students that are blocked on a certain set of subjects, students that will leave degree earlier, etc.
One of the characteristics of the SPEET project is its transnational nature, aimed to identify common characteristics on engineering students coming from different EU institutions. For that purpose, it is proposed to conduct an analysis both at country and at transnational level. The comparison of results across EU countries improves the understanding of similarities and differences among coun-tries. If discrepancies arise, a more detailed country-wise analysis can be carried out to expose the details and the potential causes behind those differences.
understanding of profiles of engineering students, and to analyse the differences across European institutions.
2.2 Data Set
Due to the transnational nature of the SPEET project, it is necessary to choose appropriate variables and representation to cover the differences in course or-ganisation at a country level. Additionally, the dataset must include students’ information while complying with privacy regulations of the European Union (e.g., the General Data Protection Regulation (GDPR) (EU) 2016/679).
For that reason, the proposed dataset uses variables obtained from the ad-ministrative records of the students, such as anonymised indicators about the socio-economic and educational environment, courses undertaken, and previous or current academic performance. It is well known that this information only covers in part the external factors of academic success [2]. But the hypothesis is that these indicators are enough to at least identify, in a first instance, the students at risk. Furthermore, it is possible to augment the data set with other potentially useful additional data sources.
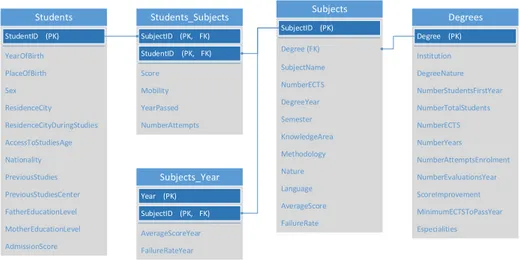
Figure 1 shows the initial, minimum core data set, proposed to perform the analysis. From an interpretation perspective, variables can be defined as explanatory or performance-related. Among the variables that the core data set comprises, there are numerical (discrete and continuous) and categorical data (and, in particular, spatial data).
Subjects
Students Students_Subjects Degrees
Subjects_Year Degree (FK) NumberECTS DegreeYear Semester KnowledgeArea Methodology FailureRate AverageScore Language Nature YearOfBirth PlaceOfBirth Sex ResidenceCity ResidenceCityDuringStudies AccessToStudiesAge Nationality PreviousStudies AdmissionScore MotherEducationLevel FatherEducationLevel PreviousStudiesCenter (PK) StudentID (PK, FK) StudentID (PK, FK) SubjectID (PK) SubjectID Institution DegreeNature NumberStudentsFirstYear NumberTotalStudents NumberECTS NumberYears NumberAttemptsEnrolment Especialities MinimumECTSToPassYear ScoreImprovement NumberEvaluationsYear (PK) Degree Score Mobility YearPassed NumberAttempts (PK) Year (PK, FK) SubjectID AverageScoreYear FailureRateYear SubjectName
3
Methods
This section describes two methods oriented to achieve the aforementioned goals, which can materialise in a set of questions that are interesting to address:
1. Is it possible to establish hypotheses about the relation between explanatory variables and academic performance?
2. Can we detect clear trends in the score distribution grouped with respect to another variable?
3. Are there clear differences among the different institutions/degrees? 4. Can we visually verify the findings obtained by means of the automatic
analysis?
5. Can we distinguish a clear data structure and is this structure explainable in relation to a certain variable?
One of the proposed method relies strongly on interaction, whereas the other one is an example of the natural integration of machine learning in the visual analytics process.
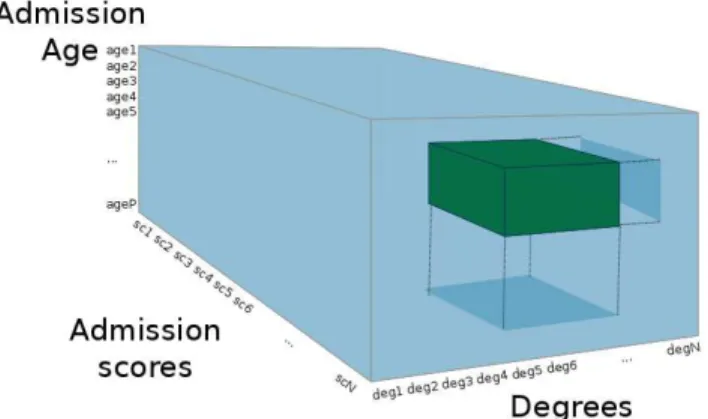
3.1 Data hypercube for coordinated views of data
This approach is based on the connection of visualisations and their coordination, in order to provide a global view of the data set that facilitates the exploration of correlations between variables. For that purpose, the data set should be viewed as a multi-dimensional array where each variable is a dimension, being possible to interpret it as a data (hyper-)cube [3] (see Fig. 2). This abstraction resembles that of On-Line Analytical Processing (OLAP) in the field of business intelli-gence, which enables the data analysis by means of four basic operations: roll-up (aggregation), drill-down (disaggregation), slicing (selection in one dimension) and dicing (selection in more than one dimension).
With this structure, it is possible to build a visualisation based on the joint and simultaneous view of coordinated histograms or bar charts in the same dashboard. The usefulness of this view can be increased if users are allowed to filter one or several factors and those filters trigger a fluid update of the distributions of the other charts. This way, users can explore the distributions of the variables and establish links between them [3]. Furthermore, since the visualisation works with the original data instead of a model based on certain assumptions, a higher reliability of the insight acquired with this approach is expected.
3.2 Dimensionality reduction
Dimensionality reduction is a common approach in multivariate data visuali-sation [8]. It takes advantage of the fact that it is generally possible to ap-proximate data using a fewer number of features while preserving most of the variability of data, because high-dimensional data tend to lie on an embedded low-dimensional manifold. This reduction might be useful as a previous step to other machine learning techniques in order to alleviate the generalisation prob-lems. However, for visualisation purposes, the aim is just to project data onto a 2- or 3-dimensional space that can be visualised by means of, e.g., a scatter plot. Many alternative techniques can be used for this purpose [8]. Some of them rely on strong assumptions, such as PCA (Principal Component Analysis) for linear data. Other ones, such as the manifold learning algorithms, are power-ful non-linear techniques with strong performance in many data sets, although sometimes they fail to retain both local and global structure of real data.
Among the manifold learning techniques, comparisons available in the pre-vious literature[9] show that t-SNE (t-distributed Stochastic Neighbour Em-bedding) generally produces, in general, better visualisations. The technique is a variation of Stochastic Neighbour Embedding (SNE) [5], an algorithm that computes conditional probabilities (representing similarities) from the pairwise high-dimensional and low-dimensional Euclidean distances and aims to find the data projection that minimises the mismatch between these probabilities. The t-SNE technique alleviates some problems of SNE by using a symmetric version of the SNE cost function with simpler gradients and a Student-t distribution to compute similarities in the low-dimensional space [9]. As a result, t-SNE is easier to optimise, do not accumulate data points in the centre of the visualisation and it is able to reveal structure at different scales. For that reason, t-SNE is selected as the dimensionality reduction algorithm for the visualisations.
4
Results
4.1 Coordinated view
The visualisation of coordinated histograms that can be interactively filtered by one or more variables is very useful for the proposed application, because it allows, in real time, to validate or refine the hypotheses an expert might develop about a set of students. Thus, with the appropriate filtering and aggre-gation operations, it would be possible to visualise the average distribution of a performance-oriented variable grouped by an exploratory one, or to analyse the distribution of all variables when we only consider a restricted group of values for one or several allegedly interesting dimensions.
The histograms are used to display the distribution of items from a contin-uous variable, which is previously partitioned into groups/bins. From a visual point of view, they use an encoding with aligned bars ordered by bins, where the size of the rectangles along the other axis is determined by a count aggregation. A similar bar chart representation can be used for categorical variables, but in this case each group is defined by a category. Although their usefulness to discover the distribution of a certain variable is obvious, the value of histograms and bar charts for the analysis of a whole multi-dimensional data set is improved when different variables are juxtaposed and coordinated or when interactive filtering is performed through a fluid selection of ranges.
Although roll-up and drill-down operations might potentially be used to work with a certain variable at different levels of aggregation, it seems that there is not any intuitive application for the student data set. On the contrary, other user-defined aggregations of a performance-related variable with respect to (i.e., grouped by) an exploratory variable would be more informative. On the other hand, the selection of subsets of groups in variables is, in any case, very
inter-esting for exploration. These selections are often calleddicing (when the groups
cover more than one variable) andslicing (when the groups are selected from a
single variable) [3]. Visualisation of count/frequency of each interval/category in the histograms or bar charts is generally interesting. On the other hand, group-ing between two variables seems more useful when the aggregated variable is the ’score’ and the variable by which it is grouped is explanatory.
Since the application of this approach does not require further processing than the sorting, grouping and reducing needed to recompute the histograms, the main factor to consider is that its implementation should be efficient enough to allow fluid filtering. Efficiency can be achieved through the used of sorted indexes and incremental updates [1].
4.2 Data projection through dimensionality reduction techniques
to provide an easy way to find and interpret groups of data, as well as the in-fluence of certain variables in the performance, through the visual proximity of the points and the changes due to user interaction.
Apart from the spatial position channels used to convey information about the data structure, additional visual channels can be used to show values of other variables from the original high-dimensional data. In fact, the radius, shape and colour of the points are useful for this purpose because their changes are easily perceived. For that reason, they need to be included in the proposed tool to ease the detection of salient patterns. On the other hand, it is appropriate to enable customisation of charts and interaction with data, in terms of the selection of a data sample to obtain further details and the modification of weights. The customisation of charts can be driven by usual visual control such as sliders, whereas interaction is more easily understood if it is embedded in the visualisation.
There are at least two interesting visualisations that might be obtained by means of the dimensionality reduction approach:
– The projection of a common data set of students, represented by their
de-scriptive variables and the average score for each academic year, in order to analyse data from a global perspective, that aims at understanding common characteristics of the institutions.
– The projection of several data sets (for each degree/institution) of students,
represented by their descriptive variables and the scores of all the subjects, with potentially missing data. The usefulness of this visualisation resides in the analysis of the groups found for each degree. Specifically, it would be interesting to determine if clearly separated groups of students can be found, if they gather students with different performance (high/low scores or graduated/dropout), and whether the explanatory variables that are not considered in the projection can provide some interpretation of the groups. In this case, for the training of t-SNE, a custom metric is used, which is essentially a pairwise Euclidean distance where missing components (i.e., scores of subjects that have not been taken by both students) are ignored.
In both cases, for the training of the t-SNE algorithm, a PCA initialisation is performed. The perplexity hyper-parameter, which drives the balance between local and global focus, is chosen heuristically.
4.3 Implementations
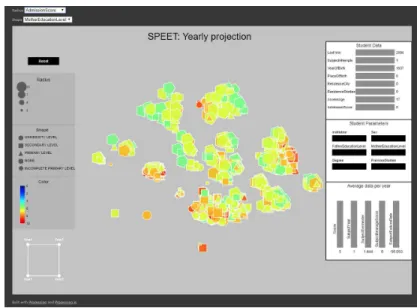
Fig. 4.Screenshot of the ’yearly projection’ visualisation tool.
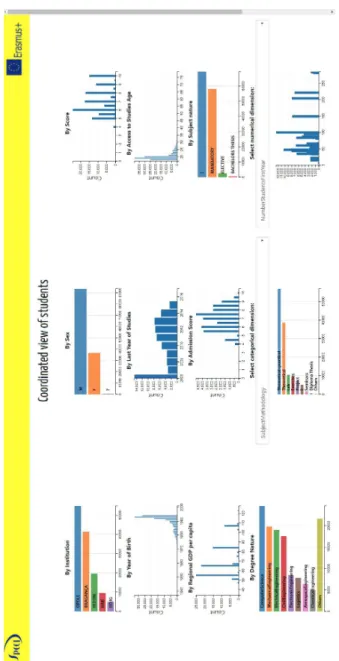
records binned by intervals. In the charts of the categorical variables, the groups are distributed along the vertical axis, whereas in the numerical variables the bins are represented along the horizontal axis. Nevertheless, it is also possible to visualise other variables in a customisable chart associated to a dropdown menu. Additionally, a histogram of the score grouped by another explanatory variable is included. Finally, for the ’ResidenceCity’ variable, which is geographic, a choro-pleth map of the European Union has been used, aggregated at the NUTS2 region (i.e., state) level. Figure 3 shows an example of the results provided by this tool.
The second visualisation tool is an interactive dimensionality reduction of the students’ data, where data are projected onto a 2D scatterplot and some parameters of the projection can be interactively adjusted. Two prototypes have been developed following this idea:
– In the first case, data has been organised by year, so that each point
repre-sents a student and its graphical properties (colour, shape, size) are linked to the value of a certain variable, which can be customised. An example of this kind of visualisation can be seen in Figure 4.
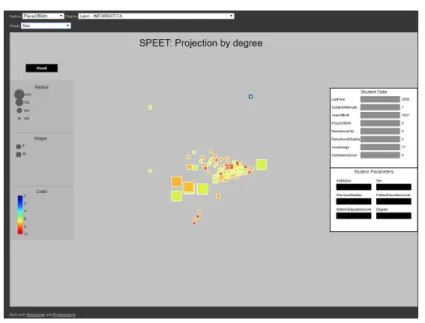
– In the second case, a different visualisation is provided for each
degree-institution combination, as seen in Figure 5. The projected data is essen-tially constituted by the scores of every course for each student. The pair-wise distance measure used to perform the dimensionality reduction is only computed with respect to the coinciding courses.
Fig. 5.Screenshot of the ’projection by degree’ visualisation tool.
process has been iterative because feedback has been gathered from partners in order to delimit the specific needs for the tools to be developed.
5
Discussion
This paper has presented an approach proposed within the SPEET project for the visual analysis of automatic data. The work has resulted in the implementa-tion of prototypes that leverage the proposed methods: coordinated histograms and interactive dimensionality reduction.
The main qualities of the coordinated view of data are the joint display of interconnected visualisations, the fluid reaction to user actions and the absence of further assumptions or imposed models on the data. These features made it valuable for the validation or refinement of hypotheses. For instance, it has been seen that the application of filters allows to confirm educators’ preconcep-tions about the influence of the nature (mandatory/elective) and methodology (theoretical/practical) of courses or the mobility in the score distributions.
6
Acknowledgements
The work presented in this paper has been co-funded by the Erasmus+ Pro-gramme of the European Union. The European Commission support for the production of this publication does not constitute an endorsement of the con-tents, which reflects the views only of the authors, and the Commission cannot be held responsible for any use which may be made of the information therein.
References
1. Crossfilter. fast multidimensional filtering for coordinated views.
http://square.github.io/crossfilter/ (2012)
2. Barbu, M., Vilanova, R., Vicario, J.L., Varanda, M., Alves, P., Podpora, M., Prada,
M., Mor´an, A., Torrebruno, A., Marin, S., Tocu, R.: Data mining tool for
aca-demic data exploitation. literature review and first architecture proposal. Tech. rep., ERASMUS + KA2 / KA203 SPEET Project (2017)
3. Blanco, I.D., Vega, A.A.C., L´opez, D.P., Gonz´alez, M.D., Castro, S.A., Medrano,
M. ´A.P.: Energy analytics in public buildings using interactive histograms. Energy
and Buildings134, 94–104 (2017)
4. Endert, A., Ribarsky, W., Turkay, C., Wong, B.W., Nabney, I., Blanco, I.D., Rossi, F.: The state of the art in integrating machine learning into visual analytics. In: Computer Graphics Forum. vol. 36, pp. 458–486. Wiley Online Library (2017) 5. Hinton, G.E., Roweis, S.T.: Stochastic neighbor embedding. In: Advances in neural
information processing systems. pp. 857–864 (2003)
6. Keim, D., Andrienko, G., Fekete, J.D., G¨org, C., Kohlhammer, J., Melan¸con, G.:
Visual analytics: Definition, process, and challenges. In: Information visualization, pp. 154–175. Springer (2008)
7. Keim, D.A.: Information visualization and visual data mining. IEEE transactions
on Visualization and Computer Graphics8(1), 1–8 (2002)
8. Lee, J., Verleysen, M.: Nonlinear Dimensionality Reduction. Springer (2007) 9. Maaten, L.v.d., Hinton, G.: Visualizing data using t-sne. Journal of machine
learn-ing research9(Nov), 2579–2605 (2008)
10. Romero, C., Ventura, S.: Educational data mining: A survey from 1995 to 2005.
Expert systems with applications33(1), 135–146 (2007)
11. Romero, C., Ventura, S.: Educational data mining: a review of the state of the art. IEEE Transactions on Systems, Man, and Cybernetics, Part C (Applications and
Reviews)40(6), 601–618 (2010)
12. Rovira, S., Puertas, E., Igual, L.: Data-driven system to predict academic grades
and dropout. PLoS one12, 1–21 (2017)
13. Sacha, D., Zhang, L., Sedlmair, M., Lee, J.A., Peltonen, J., Weiskopf, D., North, S.C., Keim, D.A.: Visual interaction with dimensionality reduction: A structured literature analysis. IEEE transactions on visualization and computer graphics
23(1), 241–250 (2017)
14. Tervakari, A., Silius, K., Koro, J., Paukkeri, J., Pirttila, O.: Usefulness of information visualizations based on educational data. In: 2014 IEEE Global Engineering Education Conference (EDUCON). IEEE (apr 2014). https://doi.org/10.1109/educon.2014.6826081