UNIVERSIDADE NOVA DE LISBOA
FACULDADE DE CIÊNCIAS E TECNOLOGIADEPARTAMENTO DE QUÍMICA
JORGE MAIÃO PERES TEIXEIRA DIAS
NOBLE METAL NANOPARTICLES
–
Au AND Ag
–
FOR BIODETECTION
Dissertation submitted for obtainment of the Master’s Degree in
Biotechnology, by the Universidade Nova de Lisboa, Faculdade de
Ciências e Tecnologia
Supervisor:
Prof. Doutor Pedro Viana Baptista (FCT/UNL)
Co-supervisor:
Prof. Doutor Ricardo Franco (FCT/UNL)
CAPARICA
nº de arquivo
UNIVERSIDADE NOVA DE LISBOA
FACULDADE DE CIÊNCIAS E TECNOLOGIADEPARTAMENTO DE QUÍMICA
JORGE MAIÃO PERES TEIXEIRA DIAS
NOBLE METAL NANOPARTICLES
–
Au AND Ag
–
FOR BIODETECTION
Dissertation submitted for obtainment of the Master’s Degree in
Biotechnology, by the Universidade Nova de Lisboa, Faculdade de
Ciências e Tecnologia
Supervisor:
Prof. Doutor Pedro Viana Baptista (FCT/UNL)
Co-supervisor:
Prof. Doutor Ricardo Franco (FCT/UNL)
CAPARICA
Acknowledgments
Thinking that a simple thank you would to the trick, I left this chapter for last. Instead it is turning out to be the hardest chapter to be written.
I would like to thank my supervisors Professor Pedro Baptista and Professor Ricardo Franco for their expertise, inspiration and more importantly, for their patiencealong this thesis.
For showing me the alchemy side of inorganic synthesis and for the patience to bear with me throughout my 2.3x10⁸ attempts to synthesize nanoparticles, thank you Professor Ricardo.
For the opportunity to make real science, to experience how it feels when things just do not work, to know and work with a spectacular group of people, for showing me that it is possible to have fun and still get the work done and most of all, for the trust in my capabilities that helped me achieve more than I ever thought I could, my sincere thank you, Professor Pedro. Late night science guys cannot forget you, André, Gonçalo, and João. A special gratitude is due to Gonçalo for all the guidance (you are the greatest!).
For all the friends that helped and bear with me this long year and to Catarina, for all the love and inspiration, a special thank you.
My final words have to go to my family. I thank my brother and my nephew (sorry for
Resumo
Devido ao seu tamanho, forma e composição, as nanopartículas metálicas possuem propriedades ópticas, químicas e magnéticas únicas. Aproveitando estas propriedades, novos biossensores têm sido desenvolvidos utilizando, principalmente, nanopartículas de ouro. As nanopartículas de prata, devido a um coeficiente de extinção da plasmónica de ressonância mais elevado, são uma alternativa para uso como marcadores em biodetecção. No entanto, contrariamente às nanopartículas de ouro, para a derivativação com oligonucleotídeos tiolados das nanopartículas de prata é necessário recorrer a protocolos morosos e complexos. Uma forma de contornar esta limitação é a utilização de nanopartículas mistas ouro-prata na forma de liga, permitindo aproveitar a fácil derivatização das nanopartículas de ouro e o maior coeficiente de extinção da plasmónica de ressonância das partículas de prata.
Abstract
Metal nanoparticles possess unique optical, chemical and magnetic properties due to their size, shape and composition. Taking advantage of these properties, new biosensors have been developed using, mainly, gold nanoparticles. Silver nanoparticles, due to its enhanced surface plasmon resonance extinction coefficient are alternate candidates as labels to biodetection. However, unlike gold nanoparticles, silver nanoparticle derivatization with thiol-modified oligonucleotides requires cumbersome and time-consuming protocols. To circumvent this limitation, an approach is the use of gold-silver alloy nanoparticles, taking advantage of the ease of derivatization of gold nanoparticles and the enhanced surface plasmon resonance extinction coefficient of silver nanoparticles.
List of abbreviations
Ag-nanoprobes Thiol-ssDNA modified silver nanoparticles
AgNPs Silver nanoparticles
AuAg-alloy-nanoprobes Thio-ssDNA modified gold-silver nanoparticles AuAg-coreshell-NPs Gold-silver core-shell nanoparticles
AuAgNPs Gold-silver alloy nanoparticles
Au-nanoprobe Thiol-ssDNA modified gold nanoparticles
AuNPs Gold nanoparticles
Bp Base pairs
DLS Dynamic Light Scattering
DNA Deoxyribonucleic acid
ICP Inductively Coupled Plasma
LB Luria-Bertani; Broth
MTB Mycobacterium tuberculosis
NPs Metal nanoparticles
OD Ultraviolet optical density
SPR Surface plasmon resonance
ssDNA Single-stranded deoxyribonucleic acid
Index
1. Introduction... 1
1.1. Nanobiotechnology ... 1
1.1.1. Nanodiagnostics ... 2
1.1.2. Metal nanoparticles ... 2
1.1.2.1. Gold nanoparticles... 3
1.1.2.1.1. DNA-functionalized gold nanoparticles ... 4
1.1.2.2. Silver nanoparticles ... 5
1.1.2.3. Bimetallic nanoparticles ... 5
1.2. Tuberculosis - etiology, relevance and nanodiagnostics ... 7
2. Materials and methods... 8
2.1. Reagents ... 8
2.1.1. Chemical reagents ... 8
2.1.2. Biological reagents ... 8
2.2. DNA oligonucleotides... 9
2.3. Buffers ... 9
2.4. Instrumentation ... 10
2.5.1. Gold nanoparticles synthesis according to the Turkevich method... 10
2.5.2. Alloy Gold-Silver nanoparticles synthesis: ... 11
2.5.2.1. Link, Wang and El-Sayed method ... 11
2.5.2.2. Alloy Gold-Silver nanoparticles suitable for functionalization with thiol-ssDNA [Dias et al– in preparation] ... 11
2.5.3. Inductively Coupled Plasma (ICP), Dynamic Light Scattering (DLS) and Transmission Electron Microscopy (TEM) measurements... 11
2.5.3.1. Inductively Coupled Plasma (ICP) ... 11
2.5.3.2. Dynamic Light Scattering ... 12
2.5.3.3. Transmission Electron Microscopy ... 12
2.5.4. Metal nanoparticles functionalization ... 12
2.5.5. Plasmid DNA isolation ... 13
2.5.6. PCR amplification ... 14
2.5.7. Hybridization assays ... 15
2.5.7.1. PCR product DNA ... 16
2.5.7.2. Plasmid DNA ... 16
3. Results and discussion ... 17
3.1. Summary ... 17
3.2. Gold-Silver alloy Nanoparticles ... 17
3.2.1. Link, Wang and El-Sayed method... 17
3.2.1.2. Gold-Silver alloy nanoparticles functionalization ... 21
3.2.2. Dias method ... 22
3.2.2.1. Synthesis and characterization ... 23
3.2.2.2. Dias method set functionalization ... 28
3.3. AuAg-alloy-nanoprobes characterization: ... 32
3.3.1. Effect of ionic strength and temperature ... 32
3.3.2 Utilization of AuAg nanoprobes in the detection of synthetic oligonucleotides ... 34
3.3.2.1. AuAg-alloy-nanoprobes sensitivity ... 36
3.3.3. Utilization of AuAg nanoprobes in detection of biological samples ... 37
4. Conclusion ... 39
5. References ... 41
6. Annex ... 49
6.1. UV-Visible spectra... 49
6.2. Calculation of the elemental composition ... 52
6.2.1. AuAgNPs – Link, Wang and El-Sayed method ... 52
6.2.2. AuAgNPs –Dias method ... 53
6.3. Calculation of molar extinction coefficients ... 54
6.3.1. AuAgNPs – Link, Wang and El-Sayed method ... 54
List of Figures
Figure 1: UV-Visible spectrum of the AuAgNPs. ...18
Figure 2: Size distribution (radius, nm) by intensity percentage of the AuAgNPs determined by
dynamic light scattering. The average hydrodynamic NPs radius was determined to be 29.4 nm. ...18
Figure 3: TEM image of the AuAgNPs (A). Size histogram corresponding to measurements of
approximately 100 AuAgNPs from 5 micrographs (B). The average radius was determined to be
12.5 nm. ...19
Figure 4: AuAgNPs stability against salt-induced aggregation. Visible spectra of AuAgNPs (0.25 nM) in
10 mM phosphate buffer pH 8, at room temperature, for different NaCl concentrations. ...21
Figure 5: AuAgNPs and AuAg-alloy-nanoprobes before and after functionalization. Visible spectra of
AuAgNPs before (—) and after (∙∙∙) functionalization with a 1 OD / 2 mL AuAgNPs ratio. ...22
Figure 6: Size distribution (radius, nm) by intensity percentage of the Dias method set determined by
dynamic light scattering. The average hydrodynamic NPs radius was determined to be 34 nm. ...23
Figure 7: TEM image of the AuAgNPs (A). Size histogram corresponding to measurements of
approximately 100 AuAgNPs from 5 micrographs (B). The average radius was determined to be 21
nm...24
Figure 8: Visible spectrum of the AuAgNPs obtained by the Dias method. ...25
Figure 9: AuAgNPs stability against salt-induced aggregation.Visible spectra of AuAgNPs (14 ρM) in 10
mM phosphate buffer pH 8, room temperature, at different salt (NaCl) concentrations. ...26
Figure 10: AuAgNPs stability against salt-induced aggregation.Absorbance ratio of AuAgNPs (14 ρM) in
a 10 mM phosphate buffer pH 7 (A), or pH 8 (B), at room temperature (squares) and 95 oC
(diamonds), at different ionic strength concentrations (NaCl). ...27
Figure 11: AuAgNPs stability against salt-induced aggregation.Absorbance ratio of AuAgNPs (14 ρM) in
a 10 mM phosphate buffer pH 7 (A), or pH 8 (B), at room temperature (squares) and 95 oC
(diamonds), at different ionic strength concentrations (MgCl2). ...28
Figure 12: AuAgNPs and AuAg-alloy-nanoprobes before and after salt-induced aggregation. Visible
spectra of AuAgNPs (14 ρM ) (− ∙ −) and AuAg-alloy-nanoprobes (14 ρM) (−−) before and AuAg-alloy-nanoprobes (∙∙∙) and AuAgNPs (—) after addition of NaCl to a final concentration of 2 M. AuAg-alloy-nanoprobes were functionalized with a 1 OD/2 mL AuAgNPs ratio. ...29
Figure 13: AuAg-alloy-nanoprobes functionalized with several oligonucleotide/AuAgNPs ratios. Visible
spectra of AuAg-alloy-nanoprobes (22 ρM); ratio 1 OD/3.8 ml AuAgNPs (∙∙∙); ratio 1 OD/2.8 ml
AuAgNPs (—) and ratio 1 OD / 2 ml AuAgNPs (−−). ...30
Figure 14: Detection of specific nucleic acids sequence with AuAg-alloy-nanoprobe. Absorbance ratio
of AuAg-alloy-nanoprobes (14 ρM) functionalized with the 1 OD/2.8 ml AuAgNPs ratio (A) and 1
OD/2 ml AuAgNPs ratio (B) alone - Blank; in the presence of a complementary target (23.3 ρmol) –
mM phosphate buffer pH 7 and a NaCl final concentration of 2.5 M (A). Orange bars represent
non-aggregated nanoprobes and grey bars represent aggregation of the nanoprobes. ...34
Figure 15: Detection of specific nucleic acids sequence with AuAg-alloy-nanoprobe. Absorbance ratio
from visible spectra of AuAg-alloy-nanoprobes (5 ρM) alone - Blank; in the presence of a
complementary target (23.3 ρmol) – MycoPOS; and in the presence of a non-complementary target (23.3 ρmol) – MycoNEG; in a 10 mM phosphate buffer pH 7 (A) or pH 8 (B) and a NaCl final
concentration of 2 M. Orange bars represent non-aggregated nanoprobes and grey bars represent
aggregation of the nanoprobes. ...35
Figure 16: Detection of specific nucleic acids sequence with AuAg-alloy-nanoprobe. Visible spectra of
AuAg-alloy-nanoprobes (5 ρM) alone – Blank (−−); in the presence of a complementary target (23.3 ρmol) – MycoPOS (—); and in the presence of a non-complementary target (23.3 ρmol) – MycoNEG (∙∙∙); in a 10 mM phosphate buffer pH 7 (A) or 8 (B) and a NaCl final concentration of 2 M. ...35
Figure 17: Detection of specific nucleic acids sequence with AuAg-alloy-nanoprobe and
Au-nanoprobes. Absorbance ratio from visible spectra of AuAg-alloy-nanoprobes (14 ρM) and Au
-nanoprobes (2.5 nM) alone - Blank; in the presence of a complementary target (23.3 ρmol) –
MycoPOS; and in the presence of a non-complementary target (23.3 ρmol) – MycoNEG; in a 10
mM phosphate buffer pH 7 and a MgCl2 final concentration of 0.02 M. Orange bars represent
non-aggregated nanoprobes and grey bars represent aggregation of the nanoprobes
(AuAg-alloy-nanoprobes). Red bars represent non-aggregated nanoprobes and blue bars represent
aggregation of the nanoprobes (Au-nanoprobes). ...36
Figure 18: Detection of specific nucleic acids sequence with AuAg-alloy-nanoprobes and
Au-nanoprobes. Absorbance ratio from visible spectra of AuAg-alloy-nanoprobes (14 ρM) and Au
-nanoprobes (2.5 nM) in a 10 mM phosphate buffer pH 7, in the presence of 70 fmol of MycoPOS, a
NaCl final concentration of 2.5 M (AuAg-alloy-nanoprobes) and a MgCl2 final concentration of 0.02
M (Au-nanoprobe). Orange bars represent non-aggregated nanoprobes and grey bars represent
aggregation of the nanoprobes. Red bars represent non-aggregated nanoprobes and blue bars
represent aggregation of the nanoprobes (Au-nanoprobes). ...37
Figure 19: Detection of specific nucleic acids sequence with AuAg-alloy-nanoprobes and
Au-nanoprobes.A. PCR product: Absorbance ratio from visible spectra of AuAg-alloy-nanoprobes (14
ρM) and Au-nanoprobes (2.5 nM) alone - Blank; in the presence of a complementary target (5 ng/µl of DNA in the form of PCR product) – MycoPOS; and in the presence of a
non-complementary target (5 ng/µl of DNA in the form of PCR product) – MycoNEG; in a 10 mM
phosphate buffer pH 7 and a MgCl2 final concentration of 0.014 M (AuAg-alloy-nanoprobes) and
0.02 M (Au-nanoprobe). B. Plasmid DNA: Absorbance ratio from visible spectra of
non-complementary target (50 µg/µl of plasmid DNA) – MycoNEG; in a 10 mM phosphate buffer pH 7
and a MgCl2 final concentration of 0.014 M (AuAg-alloy-nanoprobes) and 0.02 M (Au-nanoprobe).
Orange bars represent non-aggregated nanoprobes and grey bars represent aggregation of the
nanoprobes. Red bars represent non-aggregated nanoprobes and blue bars represent aggregation
of the nanoprobes (Au-nanoprobes). ...38
Figure 20: AuAgNPs stability against pH variation. Visible spectra of AuAgNPs obtained by Link, Wang
and El-Sayed method in 10 mM phosphate buffer pH 7 (—) and in 10 mM phosphate buffer pH 8 (∙∙∙) at room temperature. ...49
Figure 21: AuAgNps stability against pH-induced aggregation. Visible spectra of AuAgNPs obtained Dias
method at different values of pH, at room temperature. ...49
Figure 22:AuAg-alloy-nanoprobe stability against salt-induced aggregation. Visible spectra of
AuAg-alloy-nanoprobes (5pM; 1 OD/2.8 ml AuAgNPs) in 10 mM phosphate buffer pH 7 (A), or pH 8 (B),
at different salt (NaCl) concentrations. Orange bars represent non-aggregated nanoprobes and
grey bars represent aggregation of the nanoprobes. ...50
Figure 23: AuAg-alloy-nanoprobe stability against salt-induced aggregation. Visible spectra of
AuAg-alloy-nanoprobes (14pM; 1 OD/2.8 ml AuAgNPs) in 10 mM phosphate buffer pH 7 (A), or pH 8 (B),
at different salt (NaCl) concentrations. Orange bars represent non-aggregated nanoprobes and
grey bars represent aggregation of the nanoprobes. ...50
Figure 24: AuAg-alloy-nanoprobe stability against salt-induced aggregation. Visible spectra of
AuAg-alloy-nanoprobes (14pM; ratio oligonucleotide/AuAgNPs: 6.2x10⁴) in 10 mM phosphate buffer pH
7 (A), or pH 8 (B), at different salt (MgCl2) concentrations. Orange bars represent non-aggregated
nanoprobes and grey bars represent aggregation of the nanoprobes...51
Figure 25: Au-nanoprobe stability against salt-induced aggregation. Visible spectra of Au-nanoprobes
(0.25 nM;1 OD/2 ml AuNPs ratio) in 10 mM phosphate buffer pH 7 at different salt (MgCl2)
concentrations. Red bars represent non-aggregated nanoprobes and blue bars represent
aggregation of the nanoprobes. ...51
Figure 26: Calibration curve for molar extinction coefficient calculation. ...55
List of Tables
Table 1: PCR amplification program reaction. ...14
Table 2: Characterization of AuAgNPs. ...20
Table 3: Synthesized AuAgNPs characteristics. ...24
Table 4: Quantification of nanoparticle surface functionalized oligonucleotides. ...31
Table 5: Salt concentration required to promote AuAg-alloy-nanoprobes aggregation for both pH tested. ...33
1.
Introduction
1.1. Nanobiotechnology
The combination of nanoscience and biotechnology originated a growing field of research - nanobiotechnology. Still in its early stages of development, it is often considered one of the key technologies of the 21st century, with areas of research that are still being defined. Currently, nanobiotechnology focus on the utilization of biological systems, such as cells, cellular components, nucleic acids and proteins, combined with organic and inorganic materials for the attainment of functional nanostructured constructs [1].
with the advantage, due to the very small size of the nanoprobe, of doing so in a noninvasive or minimally invasive manner [3].
1.1.1. Nanodiagnostics
Molecular recognition is fundamental for the development of clinical diagnostic tools and therapeutic modalities. Various organic molecules, possessing unique properties, have been used to achieve the recognition of different targets [7].
The intense research on nanomaterials and their properties has provided the capability to develop novel molecular recognition tools. The possibility of combining the ease of handling DNA base modification with the different modification strategies of nanomaterials as showed its applicability in spectroscopy, electrochemistry, magnetism (imaging, purification and detection) and others [8]. The incorporation of nanomaterials in these conjugates (e.g. gold nanoparticles) facilitates signal transduction, as the signal of recognition can be amplified by several orders of magnitude, make recognition more effective. They can be modified according to the function of the designed DNA probe and make application of functional DNA more practical for molecular recognition in medical diagnostics by taking advantage of the unusual interactions between nanomaterials and living systems [9]. This increase in sensitivity and flexibility presents numerous advantages over more traditional procedures, i.e. fluorescence and chemiluminescence technology [10].
Gold nanoparticles (AuNPs) in particular and their application in nanodiagnostics have received a lot of attention from the scientific community [10]. The first report of the DNA hybridization event with thiol-ssDNA modified gold nanoparticles (Au-nanoprobes) was made by Storhoff and co-workers [11], and, since then, several new approaches and applications have been reported (see Section 1.1.2. for further information).
1.1.2. Metal nanoparticles
Noble metal NPs exhibit a strong plasmon resonance band in the visible region. This characteristic has been used in the development of biosensors for use in colorimetric detection of analytes [13,14,15,16,17,18,19].
The light absorption by NPs is related to the incident light interaction with the surface of the nanoparticle. When light of a specific energy interacts with the surface of noble metal NP, an intense localized field is induced. The coupling of the NPs conduction band electrons with the electric field of incident light, at a resonant frequency, generates a localized plasmonic oscillation on the surface of the NPs, designated by surface plasmon resonance (SPR) or LSPR, from Localized SPR [20]. Polarization of the opposite direction in the surrounding medium is consequently induced, thus reducing the restoring force for the electrons, shifting the SPR to a lower frequency. It is then possible to control the SPR wavelength by controlling the dielectric constant of the surrounding medium. The limitation of the electrons to dimensions smaller than the incident light wavelength is also a factor that contributes to the properties of these oscillations [21,22,23].
Several types of NPs of different composition, shapes and sizes can be easily obtained through chemical [24,25,26], photochemical [27] and biological [28] synthesis. Among these approaches, the most commonly used for noble metal nanoparticles has been the chemical reduction of the correspondent salt form with sodium citrate, commonly known as the
“Turkevich method” [26]
.
1.1.2.1. Gold nanoparticles
AuNPs have been the focus of intense research due to the wide variety of molecules that can be used for their stabilization, taking advantage of the well-known chemistry involving thiol adsorption to gold [29].
citrate-reduction present in solution a negative charge impaired by that anion. As charged particles, they are sensitive to changes in solution dielectrics, so with the addition of NaCl the surface charge is shielded leading to a decrease in inter-particle distance and particle aggregation [1]. Reports of the use of AuNPs in immunoassays [30], DNA detection [10], detection and control of microorganisms [31] and targeted delivery of drug [32], can be found in literature.
1.1.2.1.1. DNA-functionalized gold nanoparticles
The direct functionalization of the AuNPs surface with thiol-ssDNA, generating Au-nanoprobes that recognize DNA targets of interest, can be used in highly sensitive and selective DNA detection assays. The probe strand is designed to be complementary to a target of interest and is attached to the AuNPs through chemisorption of the thiol group onto the surface of the AuNPs [33]. The method is based on color change induced by distance dependent surface plasmon absorption of AuNPs [8].
In 1996, Storhoff and co-workers reported the use of Au-nanoprobes for the colorimetric detection of DNA targets based on a cross-linking mechanism. Here, two species of probes are designed in order to each be functionalized with a DNA oligonucleotide complementary to one half of a target oligonucleotide. Thus, upon the addition of target DNA, a polymeric network of Au-nanoprobes is formed, turning the solution from red to blue [11]. Due to the extremely high molar absorptivity of AuNPs, 1000 times higher than that of organic dyes, the DNA biodetection AuNPs-based have high sensitivity, when compared to that of conventional biodetection assays using fluorescence [34].
Following a parallel approach, in 2005 Franco and co-workers reported the colorimetric detection of specific DNA detection based on a non-cross-linking mechanism. Here, Au-nanoprobe aggregation is induced by an increasing salt concentration, the presence of a complementary target preventing aggregation and the solution remains red; non-complementary or mismatched targets do not prevent Au-nanoprobe aggregation and the solution changes color from red to blue [35,36,37].
as little as 0.3 µg of unamplified total RNA [35], 0.5 µg of unamplified total human RNA [38] and specific sequences of unamplified genomic DNA [33].
1.1.2.2. Silver nanoparticles
Silver nanoparticles (AgNPs) have similar properties to their gold counterparts but exhibit a higher efficiency of plasmon excitation [39], as they interact more efficiently with visible light. This interaction is a consequence of the large density of conducting electrons, their size confinement to dimensions smaller than the mean free path, and the unique frequency dependence of the real and imaginary parts of the dielectric function in the metal [40].
Like for their gold counterparts, AgNPs can be synthesized by a variety of methods depending on the nature of the nanoparticle application. The chemical reduction has the drawback of only being able to produce stable nanoparticles with <10 nm in diameter [23]. These AgNPs are not as efficient with light interaction as larger ones, doing it strictly through energy absorption. Nevertheless, they are suitable for catalysis as the main emphasis is on surface-to-volume ratio. On the other hand, the methods that allow the synthesis of larger AgNPs have the disadvantage producing a wide size distribution, lack of particle crystallinity and are costly and of difficult scale-up. However, the plasmon resonances in larger AgNPs have a significant light-scattering component that can be advantageously used in applications that require efficient optical labels, such as in chemical assays [23].
AgNPs functionalized with thiolated ssDNA (Ag-nanoprobes) have shown high sensitivity in specific DNA detection [41]. However, both AgNPs and Ag-nanoprobe are poorly stable and have lengthy, cumbersome synthesis methods, being those the probable reasons why few reports of their application in DNA detection can be found in the literature [41,42,43,44].
1.1.2.3. Bimetallic nanoparticles
Within a single nanoparticle, the optical, electronic and magnetic properties of the bimetallic particles represent an advantageous combination of the properties of both metals. The specific properties depend however, on the arrangement of the metals within the particle, i.e., alloy or core-shell structure [3].
Bimetallic nanoparticles can be prepared via the simultaneous or the successive reduction of two metal ions, through a suitable capping or template stabilization strategy, combating steric hindrance and static-electronic repulsive force. The former is used for the production of homogeneous alloy structures [48] whereas the latter yields core-shell structured nanoparticles [52].
Gold-silver is the most interesting bimetallic system because both metals are miscible in the bulk phase [3]. It has been shown that silver alloy nanoparticles (AuAgNPs) and gold-silver core-shell nanoparticles (AuAg-coreshell-NPs) blue shift with decreasing size and increasing silver content [48,53]. It has also been observed that for this system, for a constant composition, each type of nanostructure - alloy or core-shell - can be distinguished and identified solely by its optical absorbance features [53]. Thus, controlling the nanoparticles size, composition and nanostructure one can create a unique absorbance signature that can be useful in applications where nanoparticles serve as chemical labels or taggants.
So far few reports exist on the use of the gold-silver system in biomolecule detection. Cao and coworkers have reported the use of AuAg-coreshell-NPs, taking advantage of the ease of derivatization of AuNPs and the enhanced SPR extinction coefficient of AgNPs, allowing the application of the common strategies used in Au-nanoprobes assembly [54,55,56]. However, due to the thermally activated process of gold and silver atoms diffusion forming alloy nanoparticles [57], strategies are being developed to optimize their synthesis [52,54], with the disadvantage of adding complexity to an already more complex synthesis, when compared to the gold [26] and silver [58] citrate reduction method.
This work describes the synthesis of AuAgNPs and their functionalization with thiol-ssDNA to generate AuAg-alloy-nanoprobes. The adaptation of these novel nanoprobes to the non-cross-linking detection method previously developed for gold nanoparticles is discussed. 1.2. Tuberculosis - etiology, relevance and nanodiagnostics
Tuberculosis (TB) is the leading cause of death from a bacterial infectious disease affecting 1.8 billion people/year. Mycobacterium tuberculosis (MTB) is the human etiologic agent of tuberculosis and is the best-known member of the Mycobacterium tuberculosis complex, a small closely related group of organisms of the genus Mycobacterium [60].
TB diagnosis requires lengthy and expensive methods. Nowadays MTB detection resorts mainly to three methods: (i) the Ziehl-Neelsen method which can take up to 6 weeks to develop; (ii) the BACTEC system in which MTB growth can be detected in 16 days; and (iii) the Mantoux test in which results can be obtained within 72 hours [60]. Nucleic acid amplification methods (e.g. the enhanced AMPLIFIED MTD® from Gen-Probe and the COBAS® TaqMan® MTB Test from Roche) have been developed allowing the detection of mycobacterial DNA or RNA before culture results are available [61]. Nevertheless, new and even faster detection methods are being developed, namely through gold nanoparticles based biosensors [62].
In the present work, AuAgNPs were used for the synthesis of AuAg-alloy-nanoprobes with the objective of specifically detecting a sequence derived from the RNA polymerase -subunit gene of MTB [62].
This specific target was chosen as proof of concept of these new nanoprobes, for two main reasons:
i) It is crucial the development of faster methods for the detection of a disease that is responsible for more than 2 million deaths annually [62].
2. Materials and methods
2.1. Reagents
2.1.1. Chemical reagents
Chloroauric acid trihydrate (HAuCl4.3H2O)
Sodium citrate tribasic dihydrate 99% (Na3C6H5O7.2H2O) p.a.
Phenol p.a. Cloroform p.a. Silver nitrate p.a. Sodium chloride p.a.
Magnesium chloride hexahydrate p.a. Sodium dodecyl sulfate (SDS) 90% (w/v) p.a. Dithiothreitol(C4H10O2S2 ) 1 M
Sodium hidroxide (NaOH) p.a.
All the reagents used were purchased from Sigma-Aldrich and were of the highest available purity.
2.1.2. Biological reagents
Taq polimerase GelRed®
Agarose electrophoresis grade
DNA ladder GeneRuler™
2.2. DNA oligonucleotides
Designation 5’-3’ sequence Modifications
MycoComplex1 (probe) GGA CGT GGA GGC GAT C 5’ thiol
MycoPOS
(complementary DNA)
GGC CGC TGC GGC GGG GCT CAG ATC GCC TCC ACG TCC
-
MycoNEG (non-complementary DNA)
TGG ATT TAA GCA GAG TTC AAA TCT GTA CTG CAC CCT GGA G
-
pJET1fw (primer) GCC TGA ACA CCA TAT CCA TCC -
pJET1rev (primer) GCA GCT GAG AAT ATT GTA GGA GAT C - Betaglob36 (primer) ACT CCC AGG AGC AGG GAG GGC AGG - 103 (primer) CAG ATC CCC AAA GGA CTC AAA GAA CCT
CTG
-
2.3. Buffers
0.1 M phosphate buffer, pH 8 0.094 M K2HPO4
0.006 M KH2PO4
0.1 M phosphate buffer, pH 7 0.0615 M K2HPO4
0.0385 M KH2PO4
0.1 M phosphate buffer, pH 8, 0.1 M NaCl 0.1 M phosphate buffer, pH 8 4 M NaCl 0.1 M phosphate buffer, pH 8, 2% SDS 0.1 M phosphate buffer, pH 8 10% SDS
TE (pH 8) 0.01 M Tris.HCl (pH 8)
0.001 M EDTA (pH 8)
AL1 0.05 M glucose
0.01 M EDTA 0.025 M Tris-HCl (pH 8)
AL2 1% SDS
AL3 5 M K+ (pH 4.8) 3 M Ac-
2.4. Instrumentation
UVmini-1240 spectrophotometer Shimadzu, Japan;
Varian Cary Eclipse Fluorescence Spectrophotometer, USA; ICP-AES Horiba Jobin-Yvon Modelo Ultima, France;
Malvern Zetasizer Nano ZS, England;
Hitachi H-8100 Electron Microscope, Japan. 2.5. Methods
All glassware was previously treated with aqua regia (HCl:HNO3, 1:3) and washed with milliQ
ultrapure water (18.2 MΩ.cm at 25 °C).
2.5.1. Gold nanoparticles synthesis according to the Turkevich method
This method allows the synthesis of spherical gold nanoparticles.
1. Reflux a solution with a final volume of 250 mL of milliQ ultrapure water (18.2 MΩ.cm a 25 °C) containing 2.5x10⁻⁴ mol of HAuCl4.
2. Add 50 mL of 38.8 mM sodium citrate to the boiling solution, and continue reflux for an additional 30 min.
3. Cool the solution to room temperature, and store in glass container at room temperature, protected from light.
2.5.2. Alloy Gold-Silver nanoparticles synthesis:
2.5.2.1. Link, Wang and El-Sayed method
This method allows the synthesis of alloy gold-silver nanoparticles with a gold molar ratio of 0.5.
1. Reflux a solution with a final volume of 95 mL of milliQ ultrapure water (18.2 MΩ.cm a 25 °C) containing 1.27x10⁻⁵ mol of Au and 1.27x10⁻⁵ mol of Ag.
2. Add 5 mL of 1% sodium citrate to the boiling solution. 3. Reflux the solution for an additional 30 min.
4. Cool the solution to room temperature.
5. Store in glass container at room temperature protected from light.
2.5.2.2. Alloy Gold-Silver nanoparticles suitable for functionalization with thiol-ssDNA
[Dias et al– in preparation]
1. Reflux a solution with a final volume of 250 mL of milliQ ultrapure water (18.2 MΩ.cm a 25 °C) containing 6.35x10⁻⁵ mol of Au and 6.35x10⁻⁵ mol of Ag.
2. Add 25 mL of 1% sodium citrate to the boiling solution. 3. Reflux the solution for an additional 30 min.
4. Cool the solution to room temperature. 5. Centrifuge at 233 g for 20 minutes.
6. Filter through a 0.2 µm nylon filter (Whatman, GE Healthcare, UK). 7. Store in glass container at room temperature, protected from light.
2.5.3. Inductively Coupled Plasma (ICP), Dynamic Light Scattering (DLS) and Transmission
Electron Microscopy (TEM) measurements
2.5.3.1. Inductively Coupled Plasma (ICP)
with 1.00 m (sequential), an AS500 autosampler and data acquisition software. The measured samples were diluted 1:2 in aqua regia.
ICP measurements were made at CQFB, FCT-UNL, Caparica, Portugal.
2.5.3.2. Dynamic Light Scattering
The hydrodynamic diameter of the citrate capped AuAgNPs was determined by Dynamic Light Scattering (DLS) using the Zetasizer Nano ZS system. A 4 mWHe-Ne laser (633 nm) was used with a fixed 173◦ scattering angle. A total volume of 500 µL of 14 ρM AuAgNP was first stabilized for 15 min at 25 oC and then measured in automatic mode. DLS measurements were made at ITQB-UNL, Oeiras, Portugal.
2.5.3.3. Transmission Electron Microscopy
The AuAgNPs morphology and diameter were determined by Transmission Electron Microscopy (TEM). Samples for TEM analysis were prepared by depositing 10 µL of the as-prepared colloidal suspensions in carbon copper grids, washing twice with 10 µL of Milli-Q water, and air dried. TEM was performed with a HITACHI H-8100 microscope operated at 200 kV. Histograms of the NP size distribution were generated in Excel; and are based on the counting of approximately 100 AuAgNPs. TEM measurements were made at ICEMS, IST, Portugal.
2.5.4. Metal nanoparticles functionalization
The nanoprobes, i.e. thiol-ssDNA functionalized nanoparticles, were synthesized according to a modification of the method described by Hurst et al[63].
1. Resuspend the thiol modified oligonucleotide in 0.1 M DTT followed by three extractions with ethyl acetate, followed by purification with a NAP-5 column (GE HealthCare, United Kingdom) according to the manufacturer’s instructions.
3. Allow the oligonucleotide/gold nanoparticle solution to incubate at room temperature for 20 min.
4. Increase NaCl concentration to 0.05 M using 0.01 M phosphate buffer 1.5 M NaCl 0.01% SDS pH 8, followed by 20 min incubation at room temperature. This process is repeated once with an increment of 0.05 M NaCl, and thereafter for every 0.1 M NaCl increment until a concentration of 0.3 M NaCl is reached.
5. Incubate at room temperature for 16 hours.
6. To remove excess oligonucleotides, centrifuge the solution and remove the supernatant. Resuspend the pellet in 0.01 M phosphate buffer 0.1 M NaCl pH 8. Repeat this washing process 5 times.
7. Store at 4 oC protected from light.
2.5.5. Plasmid DNA isolation
1. Inoculate 10 ml of LB broth supplemented with ampicillin from either a single colony or a glycerol stock derived from a single colony. Grow the culture overnight (14 hours) at 37 oC with shaking at 200 rpm.
2. Transfer the cells to 1.5 mL eppendorf tubes and centrifuge at 9500 rpm in a benchtop microfuge. Remove the media and replace it with 150 µl of solution AL1. 3. Gently resuspend the cells and place them in ice.
4. Add 300 µl of AL2 and mix by gentle inversion. Incubate the tube on ice for 5 minutes.
5. Add 225 µl of Al3 and mix by very gentle inversion. Leave the sample on ice from 15 minutes to 4 hours.
6. Centrifuge the sample at 13000 rpm for at least 15 minutes.
7. Remove volumes of 630 µl of the resulting supernatant and place in new tubes. 8. Add 1260 µl of 100% ethanol. Leave the tubes at:
-20 oC 2 hours or -70 oC 45 minutes
11.Add RNAse (1:50 total volume), allow to digest for at least 3 hours at 37 oC. 12.Add an equal volume of phenol and mix by vortexing for 1 minute.
13.Centrifuge the sample at 13000 rpm for 3 minutes. Remove 450 µl of the aqueous phase and add an equal volume of chloroform/isoamyl alcohol (24:1), mix by vortexing for 1 minute.
14.Centrifuge again at 13000 rpm for 3 minutes. Remove 400 µl of the aqueous phase and place in a new tube.
15.Add 1:10 volume of 3 M NaCH3COO pH 7.5 and two volumes of 100% ethanol to the
sample to precipitate the DNA as indicated in step 8.
16.Pellet the DNA at 13000 rpm for 10 minutes, wash with 70% ethanol, dry and resuspend in 40 µl of H2O.
2.5.6. PCR amplification
The following standard premix was prepared for each 25 µL.
Table 1: PCR amplification program reaction.
Component Final concentration
Ultrapure miliQ water autoclaved (pH 7.0) -
PCR buffer 10x 1x
dNTPs mix (25 mM each nucleotide) 200 µM (each dNTP) primer mix (25 pmoles/µL each primer) 0.4 µM (each primer)
Taq DNA polymerase 1 U/25 µL
For MycoPOS samples the amplification parameters were as follows: Initial denaturation 95 oC 5 minutes
Denaturation 95 oC 30 seconds
35 cycles Primer annealing 58 oC 30 seconds
Extension 72 oC 45 seconds Final extension 72 oC 7 minutes
For MycoNEG samples the amplification parameters were as follows: Initial denaturation 95 oC 5 minutes
Denaturation 95 oC 30 seconds
30 cycles Primer annealing 51 oC 30 seconds
Extension 72 oC 45 seconds Final extension 72 oC 7 minutes
2.5.7. Hybridization assays
2.5.7.1. PCR product DNA
The PCR products, with 384 bp in length, were obtained by PCR (Section 2.5.6) and purified after gel band excision. This purification is needed so as to remove the ions present in the reaction media that could hamper the nanoprobe assay. The presence of the complementary sequence to the AuAg-alloy-nanoprobes in the sample that tested positive for M. tuberculosis was confirmed by DNA sequencing. A sample containing an unrelated PCR product with approximately the same base pair number (400 bp) was used as negative control, and its size was confirmed by gel electrophoresis.
2.5.7.2. Plasmid DNA
3.
Results and discussion
3.1. Summary
Gold-silver alloy nanoparticles with a molar ratio of 50% Ag and 50% Au were successfully synthesized and characterized via inductively coupled plasma (ICP), dynamic light scattering (DLS) and transmission electron microscopy (TEM). These nanoparticles were subsequently functionalized with thiol-linked ssDNA to yield AuAg-nanoprobes. These novel AuAg-alloy-nanoprobes were used in a non-cross-linking based colorimetric detection of specific DNA sequences from Mycobacterium tuberculosis.
3.2. Gold-Silver alloy Nanoparticles
Gold-silver alloy nanoparticles can be synthesized with different ratios of each metal, where increasing molar fractions of silver lead to a typical blue-shift of the SPR peak [48]. This study focused on a ratio of 50% Ag and 50% Au, taking advantage of the alkyl thiol greater affinity for the gold [54], while containing a sufficient amount of silver to increase the NPs’ extinction coefficient [39,41].
3.2.1. Link, Wang and El-Sayed method
3.2.1.1. Synthesis and characterization
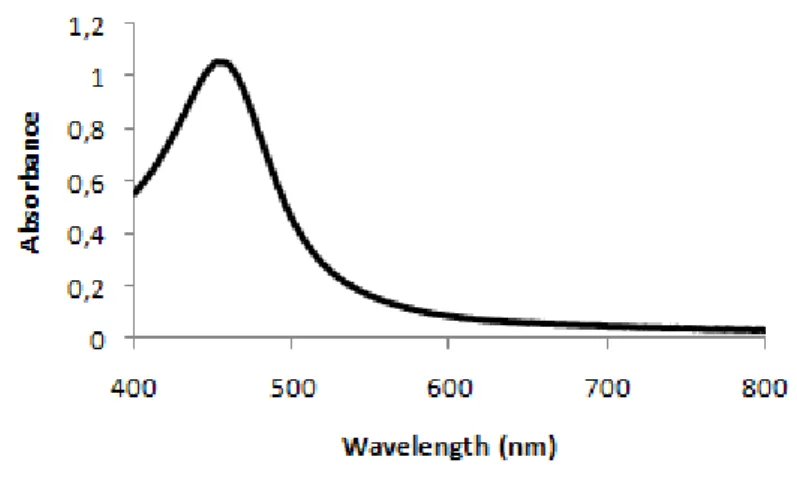
Figure 1: UV-Visible spectrum of the AuAgNPs.
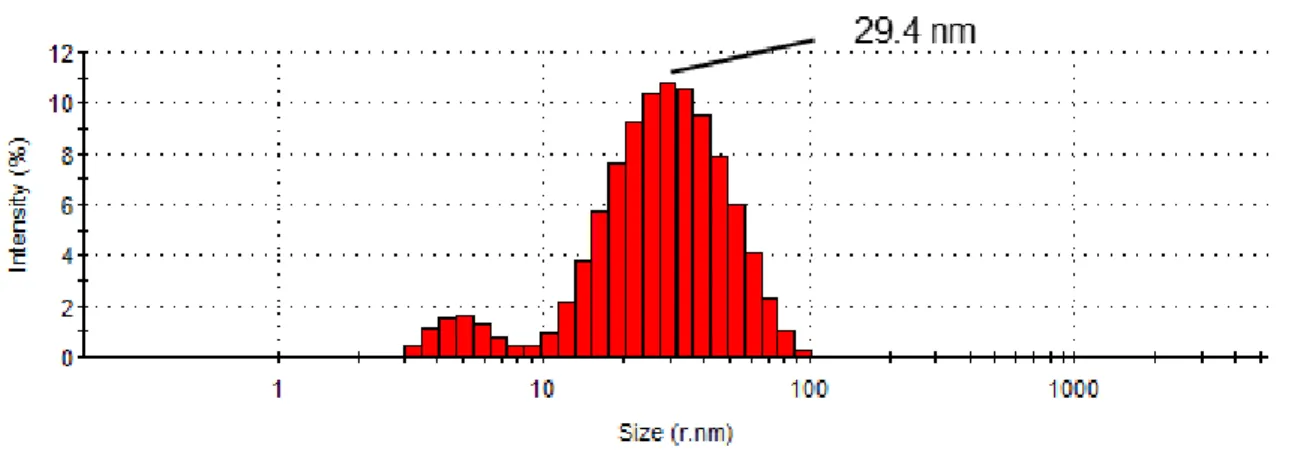
ICP data revealed that the AuAgNPs have an elemental composition of 46% gold and 54% silver (see annex 6.2 for calculation of the elemental composition). DLS data indicated an average hydrodynamic NPs radius of 29.4 nm (Figure 2).
Figure 2: Size distribution (radius, nm) by intensity percentage of the AuAgNPs determined by dynamic light scattering. The average hydrodynamic NPs radius was determined to be 29.4 nm.
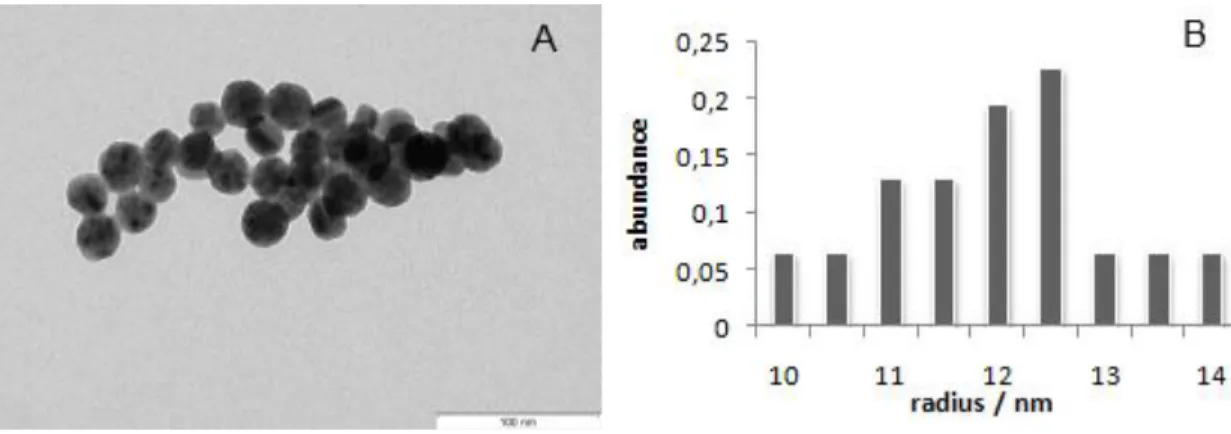
Figure 3: TEM image of the AuAgNPs (A). Size histogram corresponding to measurements of approximately 100 AuAgNPs from 5 micrographs (B). The average radius was determined to be 12.5 nm.
In order to allow a complete UV-Visible spectra analysis (e.g. calculation of the AuAgNPs concentration), the molar extinction coefficient (ε) of the involved species is required. Link et al[48] demonstrated that the Mie theory cannot be applied to AuAgNPs, so, ε was calculated for the synthesized NPs using the data obtained from ICP and TEM characterization (see annex 6.3. for calculation of the molar extinction coefficient). DLS measures the hydrodynamic radius of the NPs and the TEM measures the effective radius of the NPs, thus a more accurate calculation of the ε can be obtained using the latter. Therefore, the NPs radius measured by TEM was used for the calculation of the ε.
Table 2: Characterization of AuAgNPs.
Characteristics AuAgNPs in
this work
Link et al [48]
λmax (nm) 450 455
Nanoparticle radius (nm) 12.5 12.5
Hydrodynamic radius (nm) 29.4 -
Gold fraction (xAu) 0.46 0.54
Molar extinction coefficient ε (M-1
cm-1) 1.42x10⁹ 1.8x10⁹
Since the objective of this work was the functionalization of AuAgNPs with thiol-ssDNA, and the protocol adopted to do so described by Hurst et al[64] requires a buffered pH 8 medium, the AuAgNPs stability for different pH values was studied. Extensive aggregation was observed when the NPs solution came in contact with the pH electrode. Thus, using buffered solutions, the variation of the SPR peak profile induced by pH was only studied for pH 7 and pH 8. These two pH values were selected because, as referred, the functionalization protocol requires a buffered pH 8 medium and because in future hybridization assays a buffered pH 7 medium is required for suitable DNA hybridization [11]. At both pH tested the synthesized NPs maintained their characteristic SPR peak profile (see annex 6.1 figure 20).
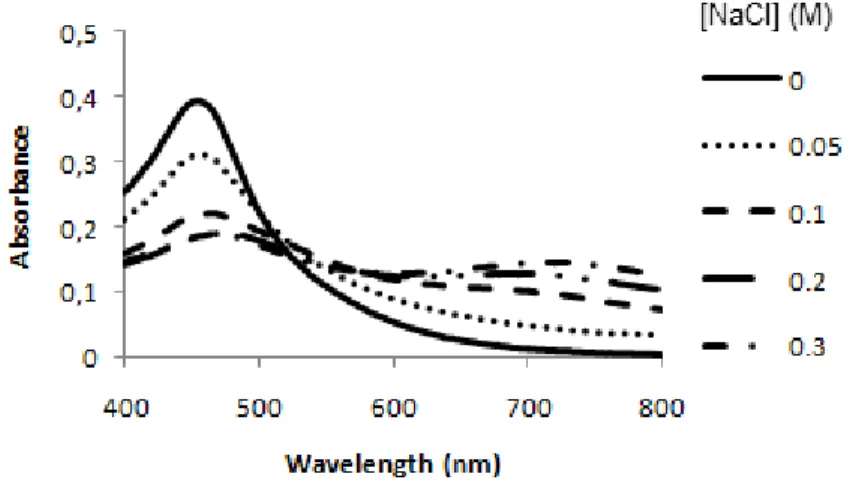
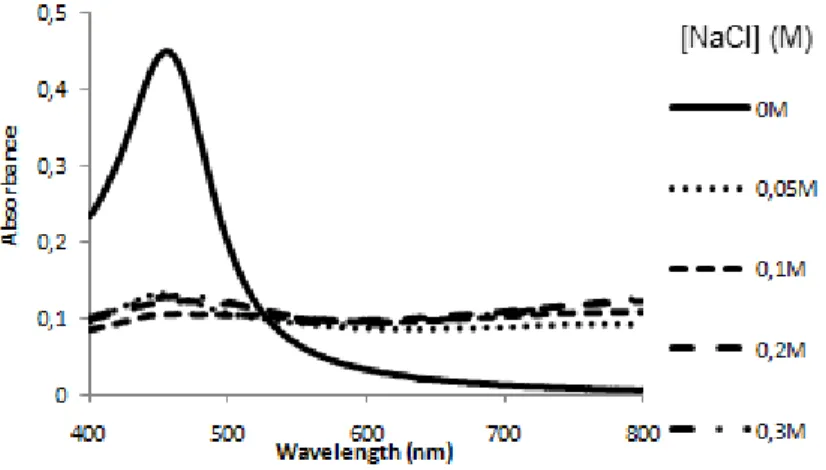
Figure 4: AuAgNPs stability against salt-induced aggregation. Visible spectra of AuAgNPs (0.25 nM) in 10 mM phosphate buffer pH 8, at room temperature, for different NaCl concentrations.
3.2.1.2. Gold-Silver alloy nanoparticles functionalization
The functionalization protocol was adapted from Hurst et al[64] (see Section 2.5.4) Following a similar approach of AuNPs functionalization, AuAg-alloy-nanoprobes were synthesized by derivatizing 2 ml of an aqueous AuAgNPs solution with 1 UV optical density (OD) of
thiol-ssDNA with the sequence 5’ - GGA CGT GGA GGC GAT C –3’, and a salting aging procedure was carried out. It was also considered the need to obtain a final AuAg-alloy-nanoprobes concentration allowing further testing and characterization.
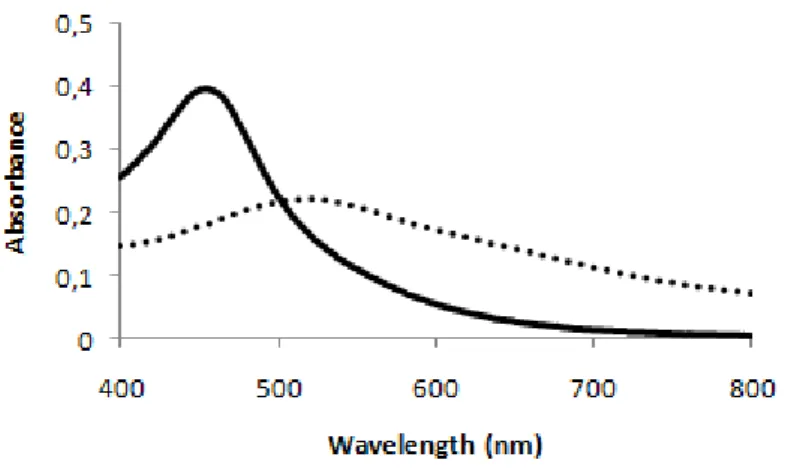
Figure 5: AuAgNPs and AuAg-alloy-nanoprobes before and after functionalization. Visible spectra of AuAgNPs before (—) and after (∙∙∙) functionalization with a 1 OD / 2 mL AuAgNPs ratio.
3.2.2. Dias method
Based on the previous functionalization results, two hypotheses were put forward:
i) Increasing the amount of thiol-ssDNA would allow a ratio of oligonucleotide/NP for which the functionalization of these AuAgNPs is possible.
ii) Decreasing the amount of citrate in the AuAgNPs synthesis would lead to a decrease
in the capping extent with concomitant increase of the nanoparticles’ average diameter. The presence of less citrate molecules and more gold atoms in the surface of each nanoparticle would, in theory, allow a larger number of thiol-ssDNA at the nanoparticle surface.
In spite of the simple concentration adjustment proposed by strategy i), this would not only make the process more costly (increase in amount of oligonucleotide needed) as it would provide small volumes of AuAg-alloy nanoprobes, not sufficient for an efficient characterization and application in hybridization assays.
3.2.2.1. Synthesis and characterization
This new set of AuAgNPs (now herein designated Dias method set) was characterized by ICP, DLS and TEM.
ICP data revealed that the AuAgNPs of the Dias method set have an elemental composition of 49% gold and 51% silver (see annex 6.2 for calculation of the elemental composition).
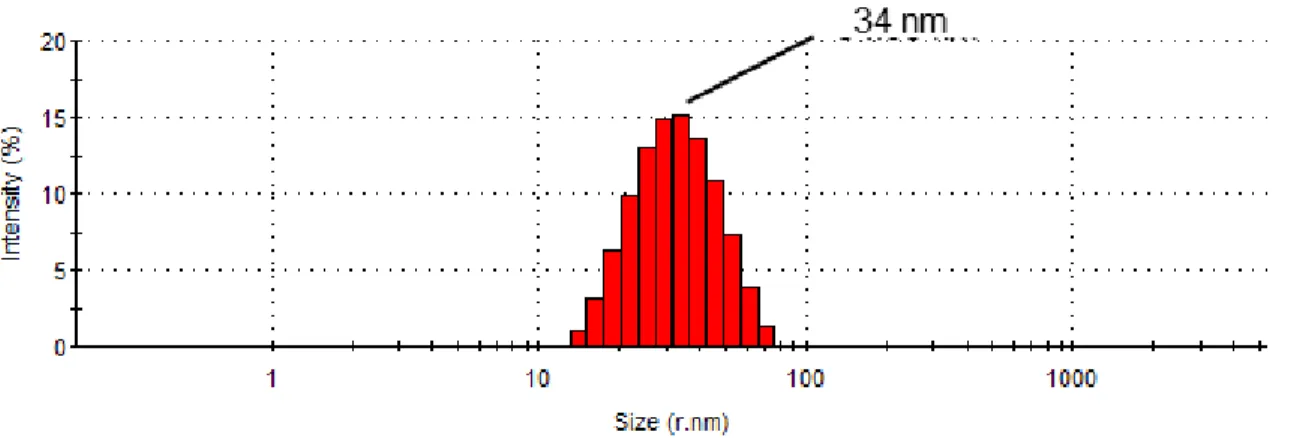
Figure 6: Size distribution (radius, nm) by intensity percentage of the Dias method set determined by
dynamic light scattering. The average hydrodynamic NPs radius was determined to be 34 nm.
DLS data indicated an average hydrodynamic NPs radius of 34 nm (Figure 6).
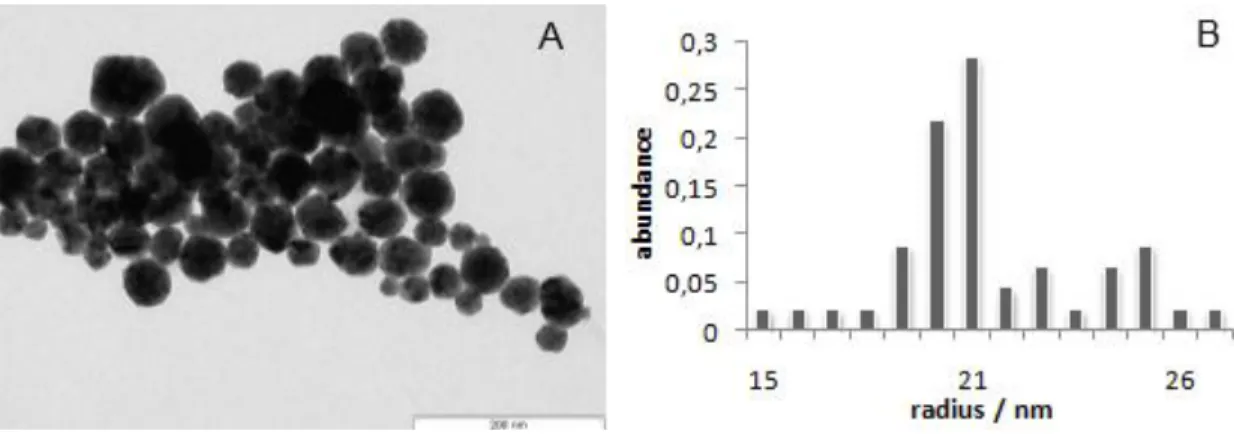
Figure 7A shows a TEM image of the Dias method set. Based on the counting of approximately 100 nanoparticles from 5 micrographs, the average radius of the nanoparticles was determined to be 21 nm (Figure 7B).
Figure 7: TEM image of the AuAgNPs (A). Size histogram corresponding to measurements of approximately 100 AuAgNPs from 5 micrographs (B). The average radius was determined to be 21 nm.
Table 3: Synthesized AuAgNPs characteristics.
AuAgNPs Link, Wang and El-Sayed method set
Dias
method set
λmax (nm) 449 451
Gold fraction (xAu) 0.47 0.49
Hydrodynamic radius (nm) 29.4 34
Nanoparticle radius (nm) 12.5 21
pH - 7.5
ε (M-1
cm-1) 1.42x10⁹ 3.21x10¹⁰
The measurements obtained by analysis of the TEM and DLS data indicate that, possibly, the Dias method set presents a smaller radius of citrate capping (i.e. the difference between hydrodynamic radius and metal radius). Nevertheless, further characterization is needed to confirm these observations.
The obtained AuAgNPs spectra showed only one SPR peak indicating the formation of the desired alloy structure (Figure 8).
Figure 8: Visible spectrum of the AuAgNPs obtained by the Dias method.
The SPR peak profile variations were characterized as function of pH and increasing ionic strength of the medium. The measured pH for the AuAgNPs solution was 7.5. Here, a titration was possible as the nanoparticles did not show aggregation when in contact with the pH electrode. The AuAgNPs solution pH was changed via addition of either NaOH or HCl. The variations induced in the SPR peak profile were followed by UV-Visible spectroscopy (see annex 6.1 Figure 21).
Figure 9: AuAgNPs stability against salt-induced aggregation. Visible spectra of AuAgNPs (14 ρM) in 10 mM phosphate buffer pH 8, room temperature, at different salt (NaCl) concentrations.
The ionic strength assay was performed as already described in section 3.1.1.1.
The SPR peak of the non-aggregated form maintains its characteristic profile, but the intensity of the peak diminishes upon aggregation, when increasing the ionic strength. At NaCl concentrations as low as 0.05 M instantaneous AuAgNPs aggregation occurred - Figure 9.
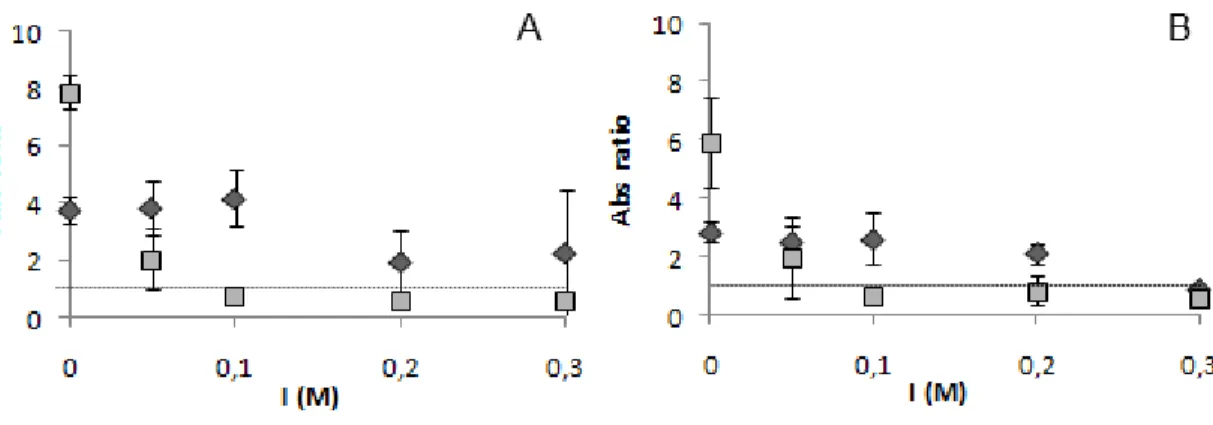
ratio (herein designated Abs ratio) between soluble and aggregated AuAgNPs was calculated. For Abs ratio calculation the fraction of the integrated absorbance peak between 400 nm and 550 nm, and between 550 nm and 700 nm, was used, thus providing a quantitative measure of the NP aggregation extent. Considering the calculated Abs ratio, it is possible to distinguish between the non-aggregated and the aggregated forms using a threshold of 1 (Figure 10).
Figure 10 shows that temperature promotes the diminishing of the Abs ratio at room temperature and 95 oC and at both pH tested. This indicates a significant aggregation of the AuAgNPs.
Figure 10: AuAgNPs stability against salt-induced aggregation. Absorbance ratio of AuAgNPs (14 ρM) in a 10 mM phosphate buffer pH 7 (A), or pH 8 (B), at room temperature (squares) and 95 oC (diamonds), at different ionic strength concentrations (NaCl).
It is also possible to observe that, for the assays carried out at 95 oC, the standard deviation values are higher than those of the assays at room temperature. This indicates that submitting the AuAgNPs to 95 oC before salt addition has effect on the AuAgNPs salt-induced aggregation.
Considering that in hybridization assays it is necessary to use a divalent salt (MgCl2), which
Figure 11: AuAgNPs stability against salt-induced aggregation. Absorbance ratio of AuAgNPs (14 ρM) in a 10 mM phosphate buffer pH 7 (A), or pH 8 (B), at room temperature (squares) and 95 oC (diamonds), at different ionic strength concentrations (MgCl2).
When using MgCl2, all samples showed extensive aggregation(Abs ratio < 1) - Figure 11.
Thus, MgCl2 induces AuAgNPs aggregation at lower values of ionic strength compared to
NaCl. Pacey et al [69] reported that monovalent salts induce a greater broaden of the SPR peak in AuNPs comparatively to the divalent salts. This can be explained with the fact that an increase in ionic strength decreases the Debye length [70]. As the Debye length decreases so does the mean distance of closest approach between nanoparticles, to a point where aggregation occurs. The author showed that despite the concentration effect, the AuNPs were farther apart for divalent cations than for monovalent cations, this indicated that, more than ionic strength, it is the cation surface adsorption that induces nanoparticles’ aggregation. However, this was not verified for the AuAgNPs with NaCl and MgCl2. Thus, the
effect of other monovalent and divalent salts should be studied, as there is no report of the effect on monovalent and divalent salts in AuAgNPs aggregation profile.
3.2.2.2. Dias method set functionalization
Figure 12: AuAgNPs and AuAg-alloy-nanoprobes before and after salt-induced aggregation. Visible spectra of AuAgNPs (14 ρM ) (−∙ −) and AuAg-alloy-nanoprobes (14 ρM) (−−) before and AuAg-alloy-nanoprobes (∙∙∙) and AuAgNPs (—) after addition of NaCl to a final concentration of 2 M. AuAg-alloy-nanoprobes were functionalized with a 1 OD/2 mL AuAgNPs ratio.
The UV-Visible spectrum of the AuAg-alloy-nanoprobes showed that the SPR peak profile was maintained after the functionalization procedure, with a small 7 nm red-shift (Figure 12). This shift can be related to the nanoparticles surface modification, given that the functionalization procedure promotes changes in the nanoparticles diameter and surface charge distribution [22]. It is also possible to observe that at a NaCl concentration of 2 M, the AuAg-alloy-nanoprobes are in their non-aggregated form maintaining their SPR peak profile; whereas the AuAgNPs are in the aggregated form (Figure 12). This suggests that the sodium citrate capping was replaced by thiol-ssDNA, making the AuAg-alloy-nanoprobes more stable than the AuAgNPs at the tested ionic strength. This increase of stability can be related to an increased repulsion between the particles derived from the electrostatic charges of the exposed bases of single stranded DNA, as proposed by Storhoff et al [15] for gold nanoparticle-thiol-ssDNA conjugates.
Having successfully functionalized the AuAgNPs synthesized accordingly to the Dias method, all the subsequent work was performed with this AuAgNPs set.
Figure 13: AuAg-alloy-nanoprobes functionalized with several oligonucleotide/AuAgNPs ratios. Visible spectra of AuAg-alloy-nanoprobes (22 ρM); ratio 1 OD/3.8 ml AuAgNPs (∙∙∙); ratio 1 OD/2.8 ml AuAgNPs (—) and ratio 1 OD / 2 ml AuAgNPs (−−).
All ratios tested yielded stable AuAg-alloy-nanoprobes (Figure 13). The functionalization procedure, for all ratios tested, had an approximate 2% yield.
The batches obtained with the 1 OD/2 ml AuAgNPs and 1 OD/2.8 ml AuAgNPs ratios maintained stability for, at least, three months after synthesis. The batch obtained with the 1 OD/3.8 ml AuAgNPs ratio aggregated during the washing process, thus no further studies were performed with this batch.
viable to characterize the same batch of AuAg-alloy-nanoprobes to a higher final concentration.
The quantification of nanoparticle surface functionalized oligonucleotides was determined using “Quant-iT™ OliGreen® ssDNA reagent and kit” and fluorescence spectroscopy.
Table 4: Quantification of nanoparticle surface functionalized oligonucleotides.
Ratio Yield (%)
Thiol-ssDNA per NP
(ρmol/cm2 )
Thiol-ssDNA strands
per NP
1 OD/ 2 ml AuAgNPs 12 303,9 9638
1 OD/ 2.8 ml AuAgNPs 31,8 590,2 19697
1 OD/ 2.5 ml AuNPs 56,7 26,7 113
Comparing AuAg-alloy-nanoprobes functionalization yields (Table 4), it is evident that with the 1 OD/2.8 ml AuAgNPs ratio one can bind more oligonucleotides per cm2, thus making this ratio the most suitable for AuAg-alloy-nanoprobes.
To be able to compare functionalization efficiency, a gold-nanoprobe was synthesized, following the same protocol as the one used for AuAg-alloy-nanoprobes. The data obtained for the Au-nanoprobe is in concordance with the described for a 20 nm in diameter gold nanoparticle [71].
The difference between Au-nanoprobe and AuAg-alloy-nanoprobes functionalization efficiencies can be explained by the different affinity of the thiol group for silver and gold. The affinity for gold is much higher, and assuming that in AuAgNPs half of the surface is occupied by silver, there will be areas where there was little or no functionalization. The
difference in efficiency can also be explained by the difference of the NPs’ diameter between
AuAgNPs (42 nm) and AuNPs (20 nm). Mirkin et al [72] recently demonstrated for AuNPs that as the nanoparticle diameter increases the surface coverage decreases. This is due to the diminishing nanoparticle curvature as function of diameter increase, causing higher repulsion between ssDNA, thus affecting functionalization yield.
In this work, a C6 spacer between the –SH and oligonucleotide sequence is used. The
reducing steric hindrance within this region. It has been shown that different types of spacers have different impacts in functionalization yields [63]. Therefore, different spacers should be tested in order to study their influence in AuAgNPs functionalization.
3.3. AuAg-alloy-nanoprobes characterization:
3.3.1. Effect of ionic strength and temperature
Considering that the protocol used for specific DNA detection (see section 2.5.7.) is an adaptation of the described for the Au-nanoprobes [35] it is necessary to characterize the AuAg-alloy-nanoprobes ionic strength and temperature induced SPR peak profile variations. A titration was performed both with a NaCl and a MgCl2 concentration gradient in a buffered
medium at pH 7 and pH 8, for a AuAg-alloy-nanoprobes concentration of 5 ρM and 14 ρM. This characterization was performed with a prior incubation step at 95 oC for 10 min, followed by a cooling step at the rate of 0.1 oC/seg and another incubation step at 20 oC for 17 min. After salt addition, the samples are allowed to stand for 20 min at room temperature. This titration was followed by UV-Visible spectroscopy.
The salt concentration that promotes AuAg-alloy-nanoprobes (5 ρM) aggregation (Abs ratio < 1; see annex 6.1 figure 22A) was 1.5 M for NaCl and 0.06 M for MgCl2 at pH 7 (Table 5). At
pH 8 it becomes more difficult to discriminate aggregated from non-aggregated form (see annex 6.1 figure 22B) for the tested salt concentrations. This stabilization may be due to the presence of DNA molecules. At pH 8, DNA is more negatively charged than at pH 7, promoting a higher electrostatic repulsion between DNA molecules, thus conferring a higher stability. The salt concentration required to promote aggregation at 14 ρM AuAg-alloy-nanoprobe concentration was 2 M for NaCl and 0.014 M for MgCl2, for both pH tested (Table
Table 5: Salt concentration required to promote AuAg-alloy-nanoprobes aggregation for both pH tested.
pH
7 8
[AuAg- alloy-nanoprobe]
(ρM)
Oligonucleotide/AuAgNPs
ratio [NaCl]
(M) I
(M) [MgCl2]
(M)
I
(M) [NaCl] (M)
I
(M) [MgCl2]
(M)
I (M)
5 1 OD/2.8 ml AuAgNPs 1.5 1.5 - - - - -
14 1 OD/2.8 ml AuAgNPs 2 2 0.014 0.048 2 2 0.014 0.048
1 OD/2 ml AuAgNPs 2.5 2.5 - - - -
Calculating the ionic strength concentration, given by equation (1), it can be determined that for AuAg-alloy-nanoprobe aggregation to occur using NaCl it is necessary higher values of ionic strength than when using MgCl2.
(1) , where ci represents the molar ion concentration and zi the ion
valence.
This indicates that, besides the variation of ionic strength, other factors must be involved in nanoprobe aggregation induced by these cations, since the counter-anion is common (Cl-). One explanation may be based on the Mg2+ known capacity to interact with DNA phosphate groups [74]. Although sodium ions can also bind to DNA phosphate groups, Mg2+ can coordinate two phosphate groups of different DNA molecules promoting nanoprobe approximation, thus potentiating the ionic strength effect in the aggregation process.
Figure 14: Detection of specific nucleic acids sequence with AuAg-alloy-nanoprobe. Absorbance ratio of AuAg-alloy-nanoprobes (14 ρM) functionalized with the 1 OD/2.8 ml AuAgNPs ratio (A) and 1 OD/2 ml AuAgNPs ratio (B) alone - Blank; in the presence of a complementary target (23.3 ρmol) – MycoPOS; and in the presence of a non-complementary target (23.3 ρmol) – MycoNEG; in a 10 mM phosphate buffer pH 7 and a NaCl final concentration of 2.5 M (A). Orange bars represent non-aggregated nanoprobes and grey bars represent aggregation of the nanoprobes.
Discrimination between MycoPOS and MycoNEG is achieved, being more evident (higher Abs ratio) using the AuAg-alloy-nanoprobe synthesized using a 1 OD/2.8 ml AuAgNPs ratio (Figure 14). This can be explained with the load of ssDNA on the surface of the nanoparticle. The higher surface density of oligonucleotides functionalization for the nanoprobe synthesized with the 1 OD/2.8 ml AuAgNPs allows the hybridization of more complementary DNA molecules per AuAg-alloy-nanoprobe, thus conferring higher stability to a given ionic strength [35].
Further testing continued with the nanoprobe synthesized with the 1 OD/2.8 ml AuAgNPs ratio.
3.3.2 Utilization of AuAg nanoprobes in the detection of synthetic oligonucleotides
Due to the low yield of functionalization, DNA detection was carried out with a smaller AuAg-alloy-nanoprobe concentration (5 ρM) than used before. Hybridization assays were carried out as described in section 2.5.7. All assays were carried out in triplicate.
Figure 15: Detection of specific nucleic acids sequence with AuAg-alloy-nanoprobe. Absorbance ratio from visible spectra of AuAg-alloy-nanoprobes (5 ρM) alone - Blank; in the presence of a complementary target (23.3 ρmol) – MycoPOS; and in the presence of a non-complementary target (23.3 ρmol) – MycoNEG; in a 10 mM phosphate buffer pH 7 (A) or pH 8 (B) and a NaCl final concentration of 2 M. Orange bars represent non-aggregated nanoprobes and grey bars represent aggregation of the nanoprobes.
For a final DNA concentration of 23.3 ρmol and 2 M NaCl, although it is possible to observe discrimination between MycoPOS and MycoNEG, the Abs ratio is very close to 1 (Figure 15), consequence of the low absorbance values - Figure 16, meaning that discrimination is low between aggregated and non-aggregated samples.
Figure 16: Detection of specific nucleic acids sequence with AuAg-alloy-nanoprobe. Visible spectra of AuAg-alloy-nanoprobes (5 ρM) alone – Blank (−−); in the presence of a complementary target (23.3 ρmol) – MycoPOS (—); and in the presence of a non-complementary target (23.3 ρmol) – MycoNEG (∙∙∙); in a 10 mM phosphate buffer pH 7 (A) or 8 (B) and a NaCl final concentration of 2 M.
The AuAg-alloy-nanoprobes efficiency in DNA detection was compared to that of an Au-nanoprobe (see annex 6.1 Figure 25 for Au-Au-nanoprobe characterization). Comparing the Abs ratios (Figure 17), it is possible to observe that the AuAg-alloy-nanoprobes have comparable efficiency to the verified with their gold counterparts.
Figure 17: Detection of specific nucleic acids sequence with AuAg-alloy-nanoprobe and Au-nanoprobes.
Absorbance ratio from visible spectra of AuAg-alloy-nanoprobes (14 ρM) and Au-nanoprobes (2.5 nM) alone - Blank; in the presence of a complementary target (23.3 ρmol) – MycoPOS; and in the presence of a non-complementary target (23.3 ρmol) – MycoNEG; in a 10 mM phosphate buffer pH 7 and a MgCl2 final concentration of 0.02 M. Orange bars represent non-aggregated nanoprobes and grey bars represent aggregation of the nanoprobes (AuAg-alloy-nanoprobes). Red bars represent non-aggregated nanoprobes and blue bars represent aggregation of the nanoprobes (Au-nanoprobes).
3.3.2.1. AuAg-alloy-nanoprobes sensitivity
Figure 18: Detection of specific nucleic acids sequence with AuAg-alloy-nanoprobes and Au-nanoprobes.
Absorbance ratio from visible spectra of AuAg-alloy-nanoprobes (14 ρM) and Au-nanoprobes (2.5 nM) in a 10 mM phosphate buffer pH 7, in the presence of 70 fmol of MycoPOS, a NaCl final concentration of 2.5 M (AuAg-alloy-nanoprobes) and a MgCl2 final concentration of 0.02 M (Au-nanoprobe). Orange bars represent aggregated nanoprobes and grey bars represent aggregation of the nanoprobes. Red bars represent non-aggregated nanoprobes and blue bars represent aggregation of the nanoprobes (Au-nanoprobes).
3.3.3. Utilization of AuAg nanoprobes in detection of biological samples
To test the AuAg-alloy-nanoprobes robustness, following their initial characterization, they were used for detection of M. tuberculosis sequences in PCR amplified fragments derived from clinical samples (Figure 19A) and from plasmid DNA (Figure 19B).
Figure 19: Detection of specific nucleic acids sequence with AuAg-alloy-nanoprobes and Au-nanoprobes.A.
PCR product: Absorbance ratio from visible spectra of AuAg-alloy-nanoprobes (14 ρM) and Au-nanoprobes (2.5 nM) alone - Blank; in the presence of a complementary target (5 ng/µl of DNA in the form of PCR product) – MycoPOS; and in the presence of a non-complementary target (5 ng/µl of DNA in the form of PCR product) – MycoNEG; in a 10 mM phosphate buffer pH 7 and a MgCl2 final concentration of 0.014 M (AuAg-alloy-nanoprobes) and 0.02 M (Au-nanoprobe). B. Plasmid DNA: Absorbance ratio from visible spectra of AuAg-alloy-nanoprobes (14 ρM) and Au-nanoprobes (2.5 nM) alone - Blank; in the presence of a complementary target (50 µg/µl of plasmid DNA) – MycoPOS; and in the presence of a non-complementary target (50 µg/µl of plasmid DNA) – MycoNEG; in a 10 mM phosphate buffer pH 7 and a MgCl2 final concentration of 0.014 M (AuAg-alloy-nanoprobes) and 0.02 M (Au-nanoprobe). Orange bars represent non-aggregated nanoprobes and grey bars represent aggregation of the nanoprobes. Red bars represent non-aggregated nanoprobes and blue bars represent aggregation of the nanoprobes (Au-nanoprobes).
For these assays, AuAg-alloy-nanoprobes aggregation was induced using MgCl2. The
presence of a larger DNA fragment (the synthetic oligonucleotide used previously is only 36 bp in length, the PCR product has 384 bp in length) conferred stability, and a concentration up to 3 M of NaCl did not induce nanoprobe aggregation. This observation can be explained by both the electrostatic interaction between the DNA phosphate groups and the nanoparticles conferring stability to higher ionic strengths and by the steric hindrance against aggregation conferred by the target molecule [35].
hypothesize that for larger DNA sequences double strand renaturing is more favorable than hybridization of the nanoprobe to the target sequence.
4.
Conclusion
The present work describes the modification of the citrate reduction method for the synthesis of gold-silver alloy nanoparticles and their functionalization with thiol-ssDNA. The synthesized AuAgNPs and AuAg-alloy-nanoprobes were chemical and spectroscopically characterized.
To our knowledge, this is the first report of functionalization of alloy gold-silver nanoparticles with thiol-ssDNA and their application in specific DNA detection. With these NPs one can take advantage of both the thiol affinity exhibited by gold and of the enhancement of the Surface Plasmon Resonance extinction coefficient conferred by silver. By modifying the citrate reduction method for AuAgNPs synthesis, it was possible to obtain nanoparticles suitable for functionalization with thiol-ssDNA. The fact that the simple citrate reduction method is used instead of a more elaborated synthetic scheme, is an advantage when compared, e.g., to the complex synthesis for AuAg-coreshell-NPs for biomolecule detection [54,55,56].
The results attained with this work, present a new class of DNA/nanoparticle hybrid materials and assemblies. However, further characterization is needed, namely:
- To study the influence of the sodium citrate concentration used in the NPs synthesis on their final size and composition,
- To assess the effect of the solution’s ionic strength (promoted by other than the salts here tested) on the AuAgNPs SPR peak profile,
- To evaluate the use of thiol-ssDNA of different sequence length and their influence in the functionalization procedure,
- To test different spacers (e.g. amine) in the AuAgNPs functionalization,
- To investigate the possibility of functionalization with biomolecules other than nucleic acids (e.g. proteins).
AuAg-alloy-nanoprobes can in principle be used in a plethora of other methods and applications for nanodiagnostics, which following already described strategies for AuNPs [10] may give rise to new methodologies for biodetection.
![Table 2: Characterization of AuAgNPs. Characteristics AuAgNPs in this work Link et al [48] λ max (nm) 450 455 Nanoparticle radius (nm) 12.5 12.5 Hydrodynamic radius (nm) 29.4 - Gold fraction (x Au ) 0.46 0.54](https://thumb-eu.123doks.com/thumbv2/123dok_br/16476014.732032/34.893.106.818.127.349/table-characterization-auagnps-characteristics-auagnps-nanoparticle-hydrodynamic-fraction.webp)