Article
J. Braz. Chem. Soc., Vol. 29, No. 2, 232-239, 2018. Printed in Brazil - ©2018 Sociedade Brasileira de Química
*e-mail: [email protected]
A Novel Electrochemical Aptamer Biosensor Based on DNAzyme Decorated Au@Ag
Core-Shell Nanoparticles for Hg
2+Determination
Yanling Zhao and Xianmei Xie*
College of Chemistry and Chemical Engineering, Taiyuan University of Technology, 030024 Taiyuan, P.R. China
As a kind of important water pollutant, heavy metal ions have a detrimental effect on the health of human. In this study, Au@Ag core-shell nanoparticles were synthesized by simple reduction of Ag+ around Au nanoparticles and functionalized by DNAzyme. Based on thymine-Hg2+-thymine
binding mode, a sensitive aptamer biosensor was constructed by utilizing functionalized Au@Ag core-shell nanoparticles as labels, and the sensitivity was enhanced by DNAzyme due to the catalysis toward H2O2. Under optimal conditions, square wave voltammetry was carried out to
measure the current derived from Au@Ag nanoparticles labels. The current response of biosensor increased with the increasing of Hg2+ concentration, which presented linear relation in the range of
0.002-20 µg L-1 with limit of detection of 0.006 µg L-1. Meanwhile, the electrochemical biosensor
showed superior reversibility, stability, repeatability, and selectivity.
Keywords: Hg2+, electrochemical biosensor, T-Hg2+-T, Au@Ag, DNAzyme
Introduction
Water pollutions including pathogens contaminants, toxic pollutant, inorganic pollutant and so on, exert a
detrimental influence on people’s health.1,2 Therein, heavy
metal ion is one non-negligible water pollutant. Mercury is easy to be absorbed by skin, respiratory and digestive tract, and to be accumulated in the body, which could damage the structure of protein and take a toll on kidney
and liver.3,4 To monitor the concentration of Hg2+, diverse
analytical methods are developed, such as fluorescent,5
surface-enhanced Raman scattering (SERS),6 colorimetric,7
inductively coupled plasma mass spectrometry (ICP-MS)8
and electrochemical ones.9 Although each method has its
merits, some complex operations and expensive instruments are required. Among them, electrochemical assay has attracted more and more attention due to its low-cost, high sensitivity and feasibility.
Oligonucleotides have drawn considerable interest for constructing electrochemical biosensor. Aptamers are short DNA or RNA molecules, which have a wide range of applications in detection of DNA, RNA, ATP and so on, because of its outstanding efficiency and
selectivity.10-13 Excitingly, the aptamer sensors could
detect not only biological molecules, but also metal ions
including Ag+, Hg2+, Pb2+, Mg2+, and Zn2+.14-17 For example,
Cui et al.18 presented an efficient electrochemical sensor
for Pb2+ detection using functionalized iron-porphyrinic
metal-organic framework as probe. Meanwhile, a variety of aptamer biosensors have been fabricated based on
the chelation between Hg2+ and thymine (T).19,20 For
example, Wei et al.21 designed thymine-functionalized
silver nanoparticle (Ag-T) as the sensing unit for Hg2+
determination and assembled individual sensing units for signal amplification. Significant progress has been made
in the field of Hg2+ determination, however, increasing
sensitivity and decreasing detection limit are always the goals of scientists.
The unique features of nanomaterials have opened up extensive ways for enhancing the sensitivity of electrochemical aptamer biosensor. A range of inorganic, organic and hybrid nanomaterials have been widely
applied.22-25 Among them, noble metal nanomaterials
exhibit relevant characteristics due to inherent catalysis action. Especially, bimetallic nanoparticles have shown better catalytic activity than the monometallic ones with the
same elements.26-28 For example, Wang et al.29 synthesized
bimetallic AuCu nanowires (AuCuNWs) via a facile water solution method and the enhancing electrocatalytic activity
toward the oxidation of H2O2 was observed. DNAzymes
catalytic signal amplification. Hemin/G-quadruplex as one kind of DNAzyme possessing peroxidase activity has been widely applied in detecting targets from proteins and DNAs,
to small molecules or metal ions. For example, Wang et al.30
constructed a novel biosensor based on G-quadruplex-hemin DNAzyme to detect activity of S1 nuclease.
In this study, Au@Ag core-shell nanoparticles were
synthesized by simple reduction of AgNO3 onto the surface
of Au NPs. Further, Au@Ag nanoparticles were modified by DNAzyme, which was employed as labels to construct
electrochemical aptamer biosensor for Hg2+ detection.
By introducing DNAzyme, the sensitivity of sensor was
enhanced and trace of Hg2+ was determined by pulse
voltammetric techniques.
Experimental
Chemicals and reagents
Oligonucleotide designed in this experiment was synthesized by Sangon Biotech. Co., Ltd. (Shanghai, China), which was purified by high-performance liquid chromatography and confirmed by mass spectrometry. The sequences of aptamer are listed as follows:
DNA1: 5’-SH-(CH2)6-AAA ATT TTG CTT TGG TTT-3’ (1)
DNA2: 5’-SH-(CH2)6-AAA AAT TTC CTT TGC TTT-3’ (2)
DNA3: 5’-SH-(CH2)6-GGG TAG GGC GGG TTG GGT-3’ (3)
Chloroauric acid (HAuCl4·4H2O), trisodium citrate
(C6H5Na3O7·2H2O), ascorbic acid (AA), silver nitrate
(AgNO3), mercuric chloride (HgCl2), polyvinylpyrrolidone
(PVP), 6-mercapto-1-hexanol (MCH), L-cysteine and hemin were purchased from Aladdin Reagent Company (Shanghai, China). All the other chemicals were of analytical reagents grade and used without further purification. The 0.2 M phosphate buffer solutions (PBS) at various pH values were prepared by mixing the stock
solutions of 0.2 M NaH2PO4, 0.2 M Na2HPO4 and 0.2 M
KCl in different proportions.
Preparation of Au@Ag nanoparticles
Firstly, Au nanoparticles were synthesized according to
our previous report.31 Briefly, 1 mL HAuCl
4 (1%, wt.%) was
added into 100 mL of double-distilled water, and heated to
boiling. Then 2.5 mL of C6H5Na3O7·2H2O (1%, wt.%) was
added, heated continually, and the color of solution changed from drab yellow into dark red. The reaction proceeded for 15 min and the solution was cooled down to room temperature. Secondly, 0.65 mL of PVP (1%, wt.%) was
added into 8 mL suspension solution containing Au NPs and stirred 5 min, following that 120 µL AA (100 mM) was added into the mixed solution, meanwhile, pH of the solution was
adjusted to 8.5 by NaOH. After, 85 µL of AgNO3 solution
(100 mM) was dropwise added into the above solution under strong stirring. Finally, the Au@Ag nanoparticles were collected by centrifugation, washed at least three times and stored into PBS (pH 7.0) at 4 °C when not in use.
Decoration of Au@Ag nanoparticles with DNA2 and DNAzyme (DNA2-Au@Ag-DNAzyme)
To fully collect synthesized DNA2 and DNA3, DNA firstly was centrifuged at 14,000 rpm for 10 min. 250 µL of DNA2 (1 mM) and 250 µL of DNA3 (1 mM) were added into 1 mL of prepared Au@Ag solution and shaked for 5 min at room temperature. To completely combine DNA with Au@Ag, the solution was transferred into refrigerator (4 °C) to keep the activity of DNA for further reaction for 5 h. Then the mixed solution was centrifuged and washed to remove redundant DNA. DNA2-Au@Ag-DNA3 conjugation was collected. Following that 500 µL of hemin (0.2 mM) was added into the DNA2-Au@Ag-DNA3 solution and Hemin/G-quadruqlex generated which was used a s a k i n d o f D NA z y m e . A f t e r c e n t r i f u g a t i o n , DNA2-Au@Ag-DNAzyme conjugate was collected, re-dispersed into PBS solution (pH 7.0) and stored at 4 °C.
Fabrication of DNA1 modified gold electrode
An Au electrode (2 mm in diameter) was polished repeatedly with 1.0 and 0.3 µm alumina slurry, followed by successive sonication in distilled water, acetone and ethanol for 5 min, and dried in air. Then the electrode was continuously scanned in a freshly prepared deoxygenated
H2SO4 solution (0.5 M) with the potential range of −0.3
to 1.5 V until a stable voltammogram characteristic of the cleaned gold electrode was established. After washing with double-distilled water, the cleaned Au electrode was immersed in the DNA1 solution (1.0 mM) and reacted for 5 h (designed as DNA1/Au). Then the electrode was immersed into the solution of MCH (1.0 mM) to eliminate the nonspecific adsorption sites at the surface of Au electrode. Subsequently, the prepared DNA1/Au was stored in the refrigerator when not in use.
Electrochemical measurements toward Hg2+
With the goal of measuring Hg2+, two-step incubation
of T-Hg2+-T.32 First, the prepared DNA1/Au electrode
was incubated with various concentrations of Hg2+ for
35 min at room temperature (designed as Hg2+/DNA1/
Au). Following that, the Hg2+/DNA1/Au electrode was
immersed into DNA2-Au@Ag-DNAzyme solution for another 35 min, and the double-strand DNA structure was
formed based on T-Hg2+-T (designed as
DNA2-Au@Ag-DNAzyme/Hg2+/DNA1/Au). After the test, the prepared
biosensor was immersed into L-cysteine solution (1.0 mM)
to remove Hg2+ by the bonding between Hg2+ and L-cysteine
and the electrode of DNA1/Au was renewed. Scheme 1B shows the fabrication process of electrochemical aptamer biosensor and electrochemical measurement principle for
Hg2+ detection. All electrochemical measurements were
carried out on CHI 660E (Chenhua, Shanghai, China) by three-electrode system with saturated calomel electrode (SCE) as reference electrode, Pt wire as counter electrode, and modified Au electrode as working electrode. Square wave voltammetry (SWV) was employed to characterize the behavior of biosensor from the range of 0-0.3 V (parameters: potential step, 4 mV; frequency, 25 Hz; amplitude, 25 mV) in PBS buffer solution (pH 6.5). Each measurement was repeated three times at room temperature.
Results and Discussion
Characterizations of Au@Ag nanoparticles
Au@Ag core-shell bimetallic nanoparticles were synthesized under the protection of surfactant by reducing
Ag+ to Ag0, which was deposited onto the surface of Au
NPs. First, Au3+ was reduced to Au0 by trisodium citrate
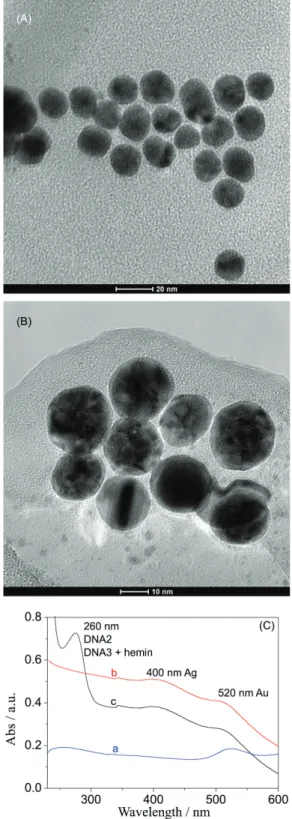
and the morphology of Au NPs was characterized by transmission electron microscopy (TEM). As seen from Figure 1A, the Au nanoparticles were spherical with uniform distribution concentrating on the size of 16 nm.
And there are a great deal of carboxyl on the surface of Au NPs due to the participation of trisodium citrate, which
could absorb electropositive Ag+ based on the electrostatic
interaction. Hence, Ag shell could occur under the reducing action. Figure 1B showed that Au@Ag nanoparticles performed with shell-core structure. The fact was that
Scheme 1. (A) The building-up process of the conjugates of DNA2-Au@ Ag-DNAzyme; and (B) the fabrication process of the electrochemical aptamer biosensor and measurement principle.
the core of Au was about 16 nm and the shell of Ag was about 2 nm.
Further, UV-Vis absorption spectrum was utilized to trace the formation process of DNA2-Au@Ag-DNAzyme, which was visually shown in Scheme 1A. It could be seen from Figure 1C that the characteristic absorption peak at 520 nm attributed to Au NPs was observed in the solution containing Au NPs, Au@Ag NPs, and DNA2-Au@Ag-DNAzyme conjugate (curves a-c). In addition, the characteristic absorption peak at 400 nm assigned to Ag NPs was obtained in the solution with Au@Ag NPs and DNA2-Au@Ag-DNAzyme conjugate (curves b and c), moreover, the absorption peak at 260 nm resulted from DNA also could be acquired in the solution of DNA2-Au@Ag-DNAzyme conjugate (curve c). The results indicated that the DNA2-Au@Ag-DNAzyme conjugate had been successfully synthesized.
Electrochemical study of DNA2-Au@Ag-DNAzyme conjugation
The electrochemical signal of aptamer biosensor was derived from DNA2-Au@Ag-DNAzyme conjugation. The electrochemical feature of this conjugate is of great importance. 5 µL of DNA2-Au@Ag-DNAzyme conjugations solution were casted on the surface of Au electrode (designed as DNA2-Au@Ag-DNAzyme/Au), then SWV was carried out in the range of 0-0.3 V in the PBS (pH 6.5). Figure 2A displayed an obvious reduction peak at 156 mV (curve b) compared to bare Au electrode (curve a) resulted from Ag NPs of conjugates. Meanwhile,
the reduction peak further was enhanced (∆I = 3.64 µA,
where I is the current) when 0.25 mM H2O2 was added
into PBS buffer solution (curve c) due to the catalysis of
DNAzyme toward H2O2, which was beneficial to increase
the sensitivity of the biosensor. Figure 2B displayed cyclic voltammetry (CV) curves at different scan rates
(10, 20, 40, 60, 80, 100, 120, 140, 160, 190, 200 mV s-1).
The result suggested that the electrochemical reaction of DNA2-Au@Ag-DNAzyme modified Au electrode was a diffusion-controlled process due to the linear relationship
between I and ν1/2, which was in accordance with the
Randles-Sevcik equation.
Comparison of current responses of Hg2+ biosensor based
different signal tags
I n o r d e r t o h i g h l i g h t t h e a d v a n t a g e s o f DNA2-Au@Ag-DNAzyme conjugation, another label-DNA2-Au@Ag was prepared with similar steps.
Two kinds of aptamer biosensors for Hg2+ detection were
constructed based on those different signal tags at the same conditions (designed as DNA2-Au@Ag-DNAzyme/
Hg2+/DNA1/Au and DNA2-Au@Ag/Hg2+/DNA1/Au).
Initially, electrochemical impedance spectroscopy (EIS) was carried out to characterize the assembling process of aptamer biosensor. As shown in Figure 3A, the semicircular diameter of DNA1/Au (curve b) was larger than bared Au electrode (curve a) due to the inhibition effect of DNA on electron transfer; further, the EIS of
DNA2-Au@Ag-DNAzyme/Hg2+/DNA1/Au (curve c)
increased because of the leading role of DNA in the conjugates. Following that, SWV was carried out for
these two biosensors toward various Hg2+ concentrations
(5, 10, 20, 50, 100 nM) in PBS containing 0.25 mM
H2O2. Figure 3B displayed the current responses of
DNA2-Au@Ag-DNAzyme/Hg2+/DNA1/Au larger than
that of DNA2-Au@Ag/Hg2+/DNA1/Au. The reason may be
the fact that DNAzyme possessed the ability of catalyzing
H2O2 and the current peaks greatly increased due to the
participation of catalytic reaction.
Control tests with different experimental conditions
Taking the practical application of this biosensor into
Figure 2. (A) SWV curve of (a) bare Au electrode, (b) DNA2-Au@Ag-DNAzyme/Au electrode and (c) electrode ‘b’ toward 0.25 mM H2O2; (B) CV of
consideration in future, all experimental operations were carried out at room temperature (25 ± 0.5 °C). However, for greatest effectiveness of aptamer biosensor, another experiment conditions such as reaction time and pH should be further optimized. On the other hand, the combination
of T-Hg2+-T was related to incubation time of Hg2+ and
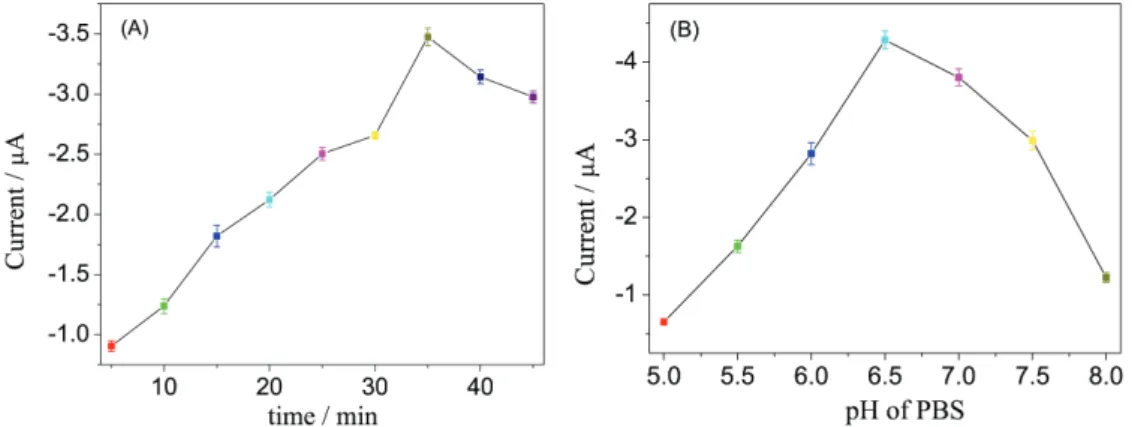
DNA2-Au@Ag-DNAzyme conjugate. Figure 4A showed the current response increase with the increasing of incubation time until 35 min when the current tended to equilibrium. Therefore, 35 min was chosen as the optimal reaction time throughout this experiment.
Furthermore, the activity of protein could be affected by strong acid or strong base. Figure 4B exhibited the maximum current response at pH 6.5, and the current decreased when pH was greater or less than 6.5, which may be attributed to the phenomenon that the structure of DNA was destroyed by strong acid or strong base. Hence, pH 6.5 of PBS was utilized in all electrochemical measurements.
Performance of the DNA biosensor
Under optimal experimental conditions, the capacity
of aptamer electrochemical biosensor for Hg2+ detection
was evaluated. The structure of T-Hg2+-T was the
function of biosensor for Hg2+ determination, and the
current responses increased with the increasing of Hg2+
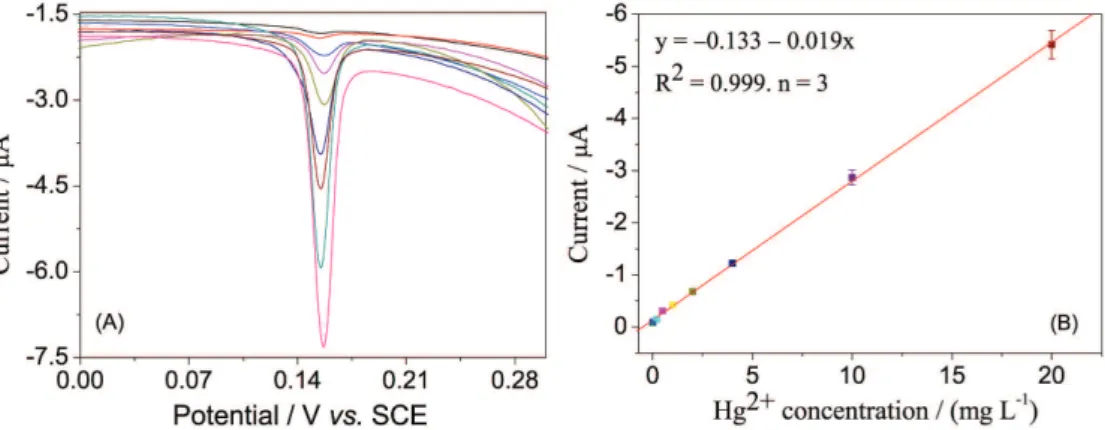
concentration. Figure 5A displayed the SWV for a series
of Hg2+ concentration, which increased gradually and the
current intensity was proportional to Hg2+ concentration
in the range of 0.002-20 µg L-1 (Figure 5B). The linear
equation was I = −0.133 − 0.019C
Hg2+ (µg L-1) (R2 = 0.999,
n = 3) with the limit of detection of 0.006 µg L-1
(LOD = 3σ
blank/s, where σblank is the relative standard
deviation of blank value; s is the slope of line). The maximum contaminant level permitted for mercury
in water is 2 µg L-1 (USEPA Office of Drinking Water
health advisories). Fortunately, the developed biosensor could completely meet the actual needs. For comparison,
DNA2-Au@Ag/Hg2+/DNA1/Au was used for detection of
Hg2+ and the LOD was 0.1 µg L-1. Meanwhile, the LOD
of DNA2-Au@Ag-DNAzyme/Hg2+/DNA1/Au was lower
than other aptamer sensors such as Zn3(PO4)2@DNA
(0.014 µg L-1),33 cationic polymer/DNA (0.03 µg L-1),34
Y-shaped/hairpin DNA (0.0188 µg L-1),35 and metal
nanoparticle formed by catalysis (0.012 µg L-1).36 The
Figure 3. (A) EIS of (a) bare Au electrode, (b) DNA1/Au electrode, and (c) DNA2-Au@Ag-DNAzyme/Hg2+/DNA1/Au electrode; (B) SWV response of
(a) DNA2-Au@Ag/Hg2+/DNA1/Au electrode and (b) DNA2-Au@Ag-DNAzyme/Hg2+/DNA1/Au electrode toward various Hg2+ concentrations (5, 10,
20, 50, 100 nM).
results indicated that the developed biosensor meets
outstanding characteristics for Hg2+ determination. There
may be some reasons: (i) Au@Ag core-shell structure not
only provided the large specific surface area for the bonding
of DNA, but also was favorable to the catalysis of H2O2;
(ii) hemin/G-quadruqlex, as a kind of DNAzyme,
could catalyze efficiently H2O2 and greatly promote
electrochemical signals of aptamer biosensor.
Reversibility, stability, repeatability, and selectivity of DNA biosensor
For an excellent biosensor, reversibility, stability, repeatability and selectivity are the important indices. The prepared sensing electrode (DNA2-Au@Ag-DNAzyme/
Hg2+/DNA1/Au) incubated with L-cysteine solution (1 mM)
for 30 min, which turned into initial status (DNA1/Au),
because L-cysteine could effectively bond with Hg2+. Then
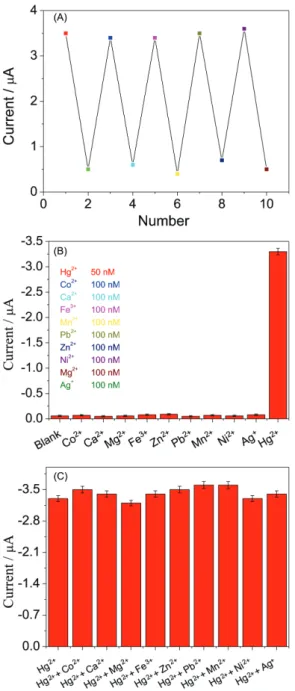
the sensing platform could be re-built according to our previous steps. Figure 6A showed the current change for five regeneration cycles and the SWV signals retained their original signals after five cycles. Meanwhile, five batches of biosensors was constructed and used for detecting
10 nM Hg2+, respectively. The coefficient of variation
was 7.8%. Further, the prepared biosensors were stored in PBS (pH 7.0) at 4 °C for four weeks, and the current still retained 98, 96, 95 and 93% compared with initial current response after each week.
In addition, selectivity was estimated by testing other metal ions such as Ca2+, Mg2+, Co2+, Pb2+, Mn2+, Fe3+, Zn2+,
Ni2+ and Ag+. Figure 6B displayed the current responses
toward those ions, the larger current signal was obtained
only to Hg2+ and other current signals had no significant
difference with blank current. Meanwhile, Figure 6C showed the disturbing influence of those heavy metal
ions by mixing different ions with Hg2+. The currents
were acquired without obvious changes compared with
single Hg2+ solution. Those results confirmed that the
electrochemical biosensor for Hg2+ detection possesses
good reversibility, stability, repeatability and selectivity.
Analysis of real samples
River, lake and drinking waters were collected, respectively, from Fenhe River, Yingze Lake and laboratory to appraise the ability of this assay for real water samples. Prior to experiment, those water samples were placed for 24 h at room temperature to subside sediment and centrifuged for 5 min. Then the spiked samples were prepared by adding
randomly Hg2+ into those water solutions. Those samples
were detected by our developed electrochemical biosensor
and referenced colorimetric method.37 The results were listed
in Table 1 and the t experimental calculation (texp) values
were calculated to evaluate correlation of the two method.
The texp values in all samples were less than t criteria value
(tcrit = 4.30 µg L-1). Therefore, this electrochemical biosensor
prospectively was applied into the field of real water samples detection in future.
Conclusions
In conclusion, a simple and sensitive electrochemical aptamer biosensor was constructed based on DNAzyme functionalized Au@Ag core-shell nanoparticles as signal
tags for Hg2+ detection. The electrochemical signals were
enhanced by the following reasons: (i) the specific surface
area was enlarged by core-shell nanostructure; (ii) the
ability of catalysis was amplified by bimetallic core-shell
nanoparticles; (iii) hemin/G-quadruplex as DNAzyme
further strengthened the current response by catalyzing
H2O2. The enhanced sensitivity possessed merit of
detecting exactly low concentrations of Hg2+, which may
offer limitless possibilities for environmental monitoring. More importantly, the limit of detection was far lower than
Figure 5. (A) The SWV curves toward different Hg2+ concentration; and (B) calibration curve of the biosensor between current and concentrations of Hg2+
Province (No. 201601D021037) and Youth Foundation of Taiyuan University of Technology (2015QN033) are gratefully acknowledged.
References
1. Mekonnen, M.; Hoekstra, A.; Environ. Sci. Technol. 2015, 49, 12860.
2. Lyubimova, T.; Lepikhin, A.; Parshakova, Y.; Tiunov, A.; J. Hydrol. 2016, 534, 579.
3. Zhou, J.; Wang, Z.; Sun, T.; Zhang, H.; Zhang, X.; Environ. Pollut. 2016, 212, 188.
4. Vogel, C.; Krüger, O.; Herzel, H.; Amidani, L.; Adam, C.; J. Hazard. Mater. 2016, 313, 179.
5. Cui, X.; Zhu, L.; Wu, J.; Hou, Y.; Wang, P.; Wang, Z.; Yang, M.; Biosens. Bioelectron. 2015, 63, 506.
6. Xu, L.; Yin, H.; Ma, W.; Kuang, H.; Wang, L.; Xu, C.; Biosens. Bioelectron. 2015, 67, 472.
7. Li, W.; Chen, B.; Zhang, H.; Sun, Y.; Wang, J.; Zhang, J.; Fu, Y.; Biosens. Bioelectron. 2015, 66, 251.
8. Wang, H.; Chen, B.; Zhu, S.; Yu, X.; He, M.; Hu, B.; Anal. Chem. 2016, 88, 796.
9. Zahida, A.; Lashinb, A.; Ranad, U.; Al-Arifie, N.; Ullaha, I.; Dionysiouf, D.; Qureshia, R.; Waseema, A.; Kraatzg, H.; Shah, A.; Electrochim. Acta 2016, 190, 1007.
10. Li, F.; Zhang, H.; Wang, Z.; Li, X.; Li, X.; Le, X.; J. Am. Chem. Soc. 2013, 135, 2443.
11. Tan, C.; Yu, P.; Hu, Y.; Chen, J.; Huang, Y.; Cai, Y.; Luo, Z.; Li, B.; Lu, Q.; Wang, L.; Liu, Z.; Zhang, H.; J. Am. Chem. Soc.
2015, 137, 10430.
12. Abi, A.; Ferapontova, E.; J. Am. Chem. Soc. 2012, 134, 14499. 13. Zhu, Y.; Hu, X.; Shi, S.; Gao, R.; Huang, H.; Zhu, Y.; Lv, X.;
Yao, T.; Biosens. Bioelectron. 2016, 79, 205.
Figure 6. (A) Reversible changes of the SWV peak currents for the biosensor immersed in the solution of 50 nM Hg2+ and 1.0 mM L-cysteine
alternately; (B) the specificity and (C) anti-interference quality of the biosensor toward Co2+, Ca2+, Mg2+, Fe3+, Zn2+, Mn2+, Pb2+, Ni2+, Ag+.
Table 1. Comparison of the assay results for real samples by using the developed electrochemical biosensor (C(biosensor), mean ± standard deviation,
n = 3) and the referenced colorimetric method (C(colorimetric), mean ± standard
deviation, n = 3)
Sample C(colorimetric) /
(µg L-1)
C(biosensor) /
(µg L-1) texp / (µg L-1)
Drinking water
10.08 ± 10.16 10.19 ± 10.15 −0.01
5.12 ± 1.09 6.12 ± 1.16 −1.08
6.47 ± 1.08 6.64 ± 0.08 −0.27
Lake
10.32 ± 0.25 10.26 ± 1.08 0.09
4.76 ± 0.22 4.13 ± 1.36 0.79
− 1.08 ± 0.05 −
River
15.23 ± 3.02 20.12 ± 0.17 −2.77
16.43 ± 2.14 16.08 ± 3.19 0.15
9.19 ± 0.78 9.7 ± 1.68 −0.48
texp: t experimental calculation values.
permitted concentration of Hg2+ in water. The performance
of developed biosensor was outstanding compared with
other Hg2+ biosensors. Moreover, the proposed biosensors
could analyse other targets determination by simply replacing responsive aptamer, which could expand its application in future.
Acknowledgments
14. Zhou, G.; Chang, J.; Pu, H.; Shi, K.; Mao, S.; Sui, X.; Ren, R.; Cui, S.; Chen, J.; ACS Sens. 2016, 1, 295.
15. Zhang, L.; Wong, J.; Li, X.; Li, Y.; Yu, H.; Anal. Chem. 2015, 87, 5062.
16. Cui, L.; Peng, R.; Fu, T.; Zhang, X.; Wu, C.; Chen, H.; Liang, H.; Yang, C.; Tan, W.; Anal. Chem. 2016, 88, 1850.
17. Zhou, Y.; Tang, L.; Zeng, G.; Zhang, C.; Zhang, Y.; Xie, X.; Sens. Actuators, B 2016, 223, 280.
18. Cui, L.; Wu, J.; Li, J.; Ju, H.; Anal. Chem. 2015, 87, 10635. 19. Li, J.; Lu, L.; Kang, T.; Cheng, S.; Biosens. Bioelectron. 2016,
77, 740.
20. Qiu, Z.; Tang, D.; Shu, J.; Chen, G.; Tang, D.; Biosens. Bioelectron. 2016, 75, 108.
21. Wei, T.; Dong, T.; Wang, Z.; Bao, J.; Tu, W.; Dai, Z.; J. Am. Chem. Soc. 2015, 137, 8880.
22. Abo-Hamad, A.; AlSaadi, M.; Hayyan, M.; Juneidi, I.; Hashim, M.; Electrochim. Acta 2016, 193, 321.
23. Liu, X.; Cheng, Z.; Fan, H.; Ai, S.; Han, R.; Electrochim. Acta
2011, 56, 6266.
24. Primo, E.; Gutierrez, F.; Rubianes, M.; Rivas, G.; Electrochim. Acta 2015, 182, 391.
25. Tang, S.; Lu, W.; Gu, F.; Tong, P.; Yan, Z.; Zhang, L.; Electrochim. Acta 2014, 134, 1.
26. Arslan, E.; Çakır, S.; J. Electroanal. Chem. 2016, 760, 32.
27. Zhou, Q.; Lin, Y.; Lin, Y.; Wei, Q.; Chen, G.; Tang, D.; Biosens. Bioelectron. 2016, 78, 236.
28. Yuan, F.; Zhao, H.; Zang, H.; Ye, F.; Quan, X.; ACS Appl. Mater. Interfaces 2016, 8, 9855.
29. Wang, N.; Han, Y.; Xu, Y.; Gao, C.; Cao, X.; Anal. Chem. 2015, 87, 457.
30. Wang, Z.; Zhao, J.; Bao, J.; Dai, Z.; ACS Appl. Mater. Interfaces
2016, 8, 827.
31. Zhang, B.; Ding, C.; Biosens. Bioelectron. 2016, 82, 112. 32. Wei, T.; Dong, T.; Wang, Z.; Bao, J.; Tu, W.; Dai, Z.; J. Am.
Chem. Soc. 2015, 137, 8880.
33. He, L.; Zhang, S.; Wang, M.; Peng, D.; Yan, F.; Zhang, Z.; Zhou, L.; Sens. Actuators, B 2016, 228, 500.
34. Zhu, Y.; Cai, Y.; Zhu, Y.; Zheng, L.; Ding, J.; Quan, Y.; Wang, L.; Qi, B.; Biosens. Bioelectron. 2015, 69, 174.
35. Jia, J.; Chen, H.; Feng, J.; Lei, J.; Luo, H.; Li, N.; Anal. Chim. Acta 2016, 908, 95.
36. Tang, S.; Tong, P.; Lu, W.; Chen, J.; Yan, Z.; Zhang, L.; Biosens. Bioelectron. 2014, 59, 1.
37. Borthakur, P.; Darabdhara, G.; Das, M.; Boukherroub, R.; Szunerits, S.; Sens. Actuators, B 2017, 244, 684.
Submitted: January 14, 2017
Published online: July 11, 2017