i
Ricardo Pinto Enes Martinho
Licenciado em Química Aplicada– Perfil de Química Orgânica
Development and application of NMR
techniques to study water-in-CO2
microemulsions
Dissertação para obtenção do Grau de Mestre em Química Bioorgânica
Orientador: Professor Doutor Eurico José da Silva Cabrita,
Professor Auxiliar, FCT/UNL
Co-orientador: César António Tonicha Laia,
Investigador Assistente, FCT/UNL
Júri:
Presidente: Prof. Doutora Paula Cristina de Sério Branco Arguente: Prof. Doutor Pedro Lúcio Maia Marques de Almeida Vogal: Prof. Doutor Eurico José da Silva Cabrita
Page | iii
Ricardo Pinto Enes Martinho
Licenciado em Química Aplicada– Perfil de Química Orgânica
Development and application of NMR
techniques to study water-in-CO2
microemulsions
Dissertação para obtenção do Grau de Mestre em Química Bioorgânica
Orientador: Professor Doutor Eurico José da Silva Cabrita,
Professor Auxiliar, FCT/UNL
Page | v
Development and application of NMR techniques to study
water-in-CO2 microemulsions.
“Copyright”
Ricardo Pinto Enes Martinho
Page | vii
ACKNOWLEDGEMENTS
São muitas as pessoas que me ajudaram muito durante o tempo deste trabalho, tanto em termos académicos como pessoais. Vou tentar não me esquecer de muitas.
Desde logo quero agradecer ao Prof. Eurico. Nestes dois anos e meio em que tenho sido seu aluno aprendi muito, foi uma experiência exigente mas muito interessante e proveitosa. Obrigado pelo tempo dispensado comigo e pelas oportunidades.
Quero também agradecer ao Dr. César Laia, com quem já trabalho desde o meu segundo ano de licenciatura e com quem aprendi muito. Obrigado pela orientação ao longo destes anos
Não posso também deixar de agradecer à Dra. Marta Corvo, pelo auxílio indispensável com os ensaios de alta pressão, mas também pelas conversas muito úteis sobre o meu trabalho.
E claro, quero agradecer a todos do grupo MSI NMR. Aos postdocs, que sempre estiveram dispostos a ajudar, a Dra. Ana Sofia, o Dr. Ângelo e a Dra. Filipa. E aos meus colegas, que foram uma grande companhia e apoio ao longo deste ano, mesmo que durante algum tempo à distância, à Ana, à Carmen, à Helena, à Inês, ao João, ao Micael, à Sílvia, ao Tiago, e ao Wagner, um muito obrigado!
I was also lucky to have stayed for four months at Georgetown University as a visiting student of Prof. Richard Weiss. I would like to thank you for the time and enthusiasm you dedicated to me. I really learned a lot with this stay, obrigado!
And to my colleagues at the Weiss group: Dr. Ajay, Jingjing, Louis, Maria Victoria, Mike, Mohan, Teresa, Theresa, Trevor and Yan. I wish you all the best, it was a really enriching experience getting to know you and work alongside you.
To my DC family, everyone at the International Student House, you guys were invaluable for me to keep my sanity. Thank you so much for being great people and amazing friends.
Aos meus amigos, muito obrigado pelo carinho, sobretudo quando estava fora. O vosso contributo foi muito importante.
Aos meus pais, e à minha família, muito obrigado, pelo apoio nesta aventura, por estarem sempre presentes quando era necessário, mesmo quando não o estavam fisicamente.
À Patrícia, por em todos estes anos me aturares, por continuares a aturar-me, por estares sempre ao meu lado: muito muito obrigado por tudo!
This work was financed as part of the Marie Curie International Research Staff Exchange Scheme Fellowship within the 7th European Community Framework Programme (Contract grant number: PIRSES-GA-2012-318930 – InTechSE).
Page | ix
RESUMO
A auto-organização (self-assembly) é um fenómeno que ocorre frequentemente no universo. Neste trabalho dois sistemas que o fazem foram estudados: a formação de micelas reversa em isooctane e em dióxido de carbono supercrítico (scCO2), e a formação de géis em solventes orgânicos.
O propósito foi o estudo físico-químico destes sistemas e o desenvolvimento de metodologias de RMN para os estudar.
Neste trabalho, AOT é utilizado como uma molécula modelo para estudar extensivamente um sistema vastamente investigado, água/AOT/isooctano com diferentes concentrações de água e para avaliar a agregação em dióxido de carbono supercrítico em diferentes pressões. Para o fazer, uma metodologia de RMN foi desenvolvida, na qual foi possível determinar com exatidão o raio hidrodinâmico da micela (de acordo com as medidas de DLS) utilizando DOSY, a estabilidade micelar e a sua dinâmica. Isto foi essencialmente determinado através de estudos de relaxação de RMN de 1H,
que permitiram determinar tempos de correlação e o tamanho de moléculas de água correlacionadas, que estão de acordo com o tamanho da esfera que interage com a membrana micelar. A encapsulação de carbohidratos de diferentes tamanhos permitiu a comprensão da dinâmica e estabilidade dos agregados nestas condições.
Microemulsões de água em CO2 foram preparadas utilizando AOT e água em dióxido carbono
supercrítico, com etanol como cossurfactante. O comportamento dos diferentes componentes do sistema foi avaliado e é provável que acima de 130 bar se tenham obtido microemulsões reversas. A homogeneidade do sistema foi determinada por RMN.
A formação de uma rede de gel através de dois agentes gelificantes moleculares em tolueno-d8
foi estudado através de DOSY. Uma metodologia empregando One-shot DOSY para adquirir estes espectros foi desenvolvida e aplicada com sucesso. Isto permitiu uma compreensão sobre o papel do solvente e da molécula gelificante no processo de agregação, bem como uma estimativa do tempo de gelificação.
Palavras chave: surfactantes; microemulsões; CO2 supercrítico; espectroscopia de RMN; géis;
Page | xi
ABSTRACT
Self-assembly is a phenomenon that occurs frequently throughout the universe. In this work, two
self-assembling systems were studied: the formation of reverse micelles in isooctane and in supercritical CO2 (scCO2), and the formation of gels in organic solvents. The goal was the physicochemical study of
these systems and the development of an NMR methodology to study them.
In this work, AOT was used as a model molecule both to comprehensively study a widely researched system water/AOT/isooctane at different water concentrations and to assess its aggregation in supercritical carbon dioxide at different pressures. In order to do so an NMR methodology was devised, in which it was possible to accurately determine hydrodynamic radius of the micelle (in agreement with DLS measurements) using diffusion ordered spectroscopy (DOSY), the micellar stability and its dynamics. This was mostly assessed by 1H NMR relaxation studies, which allowed to determine
correlation times and size of correlating water molecules, which are in agreement with the size of the shell that interacts with the micellar layer. The encapsulation of differently-sized carbohydrates was also studied and allowed to understand the dynamics and stability of the aggregates in such conditions.
A W/CO2 microemulsion was prepared using AOT and water in scCO2, with ethanol as
cosurfactant. The behaviour of the components of the system at different pressures was assessed and it is likely that above 130 bar reverse microemulsions were achieved. The homogeneity of the system was also determined by NMR.
The formation of the gel network by two small molecular organogelators in toluene-d8 was studied
by DOSY. A methodology using One-shot DOSY to perform the spectra was designed and applied with success. This yielded an understanding about the role of the solvent and gelator in the aggregation process, as an estimation of the time of gelation.
Keywords: surfactants; microemulsions; supercritical CO2; NMR spectroscopy; gels; LMOGs;
Page | xiii
TABLE OF CONTENTS
ACKNOWLEDGEMENTS ... vii
RESUMO ... ix
ABSTRACT ... xi
LIST OF FIGURES ... xv
LIST OF TABLES ... xix
TABLE OF ABBREVIATIONS AND NOMENCLATURE ... xxi
1. INTRODUCTION ... 1
1.1. Supercritical CO2 and the solubilization of polar molecules ... 1
1.1.1. Surfactants and micellar systems ... 3
1.1.2. Characterization of RMs through NMR spectroscopy ... 7
1.1.3. Applications to NMR spectroscopy ... 10
1.2. Molecular gels ... 11
1.2.1. Structural studies of molecular gels... 12
1.3. Thesis outline and objectives ... 14
2. CHARACTERIZATION AND DYNAMICS OF REVERSE MICROEMULSIONS IN ORDINARY AND SUPERCRITICAL SOLVENTS ... 15
2.1. Development of a NMR methodology to characterize W/O reverse micelles ... 15
2.1.1. Size determination of RMs ... 17
2.1.1.1. Dynamic Light Scattering determination ... 17
2.1.1.2. Application of a NMR methodology ... 19
2.1.1.3. Comparison of methods ... 21
2.1.2. Dynamics of AOT RMs in isooctane ... 22
2.1.2.1. Stability of AOT W/O microemulsions ... 24
2.1.2.2. Confined water dynamics ... 25
2.1.3. Encapsulation of carbohydrate molecules in AOT RMs ... 31
2.2. Application of the NMR methodology to W/CO2 microemulsions ... 38
2.2.1. Influence of CO2 in AOT aggregation ... 39
2.2.2. Assessment of W/CO2 microemulsions using NMR spectroscopy ... 41
2.2.2.1. Homogeneity assessment of W/CO2 microemulsions ... 45
Page | xiv
2.2.2.3. Dynamics of RMs in scCO2 studied by NMR ... 50
2.3. Experimental section ... 52
2.3.1. Chemicals ... 52
2.3.2. Synthetic procedures ... 52
2.3.3. Physicochemical studies of W/O microemulsions ... 53
2.3.3.1. DLS measurements ... 54
2.3.3.2. NMR experiments ... 54
2.3.4. Physicochemical studies of W/CO2 microemulsions ... 55
2.3.4.1. HP fluorescence experiments ... 55
2.3.4.2. HP NMR experiments ... 56
3. NMR STUDIES OF THE PROCESS OF GELATION OF LMOGS ... 57
3.1. Proof of concept NMR studies to follow the formation of LMOG-based gels ... 57
3.2. Experimental section ... 62
3.2.1. Chemicals ... 62
3.2.2. NMR experiments ... 62
4. CONCLUSIONS AND FUTURE PERSPECTIVES ... 65
A) APPENDIX ... 67
Page | xv
LIST OF FIGURES
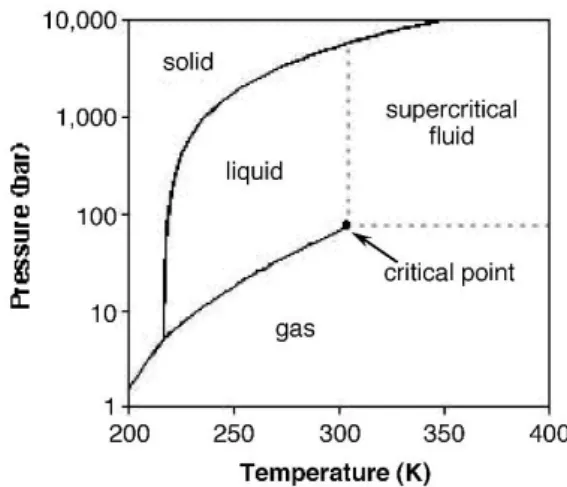
Fig. 1.1 Phase diagram of carbon dioxide, highlighting its critical point. Image taken from ref 6. . 1
Fig. 1.2 i) Dipoles present in water (A) and carbon dioxide (B) molecules. ii) Interactions established between CO2 and carbonyl compounds. Adapted from Raveendran et al.8 ... 2
Fig. 1.3 Aggregation model of a water-in-oil reverse micelle. Figure adapted from Kilikian et al.32 3
Fig. 1.4 Molecular structure of AOT. ... 4
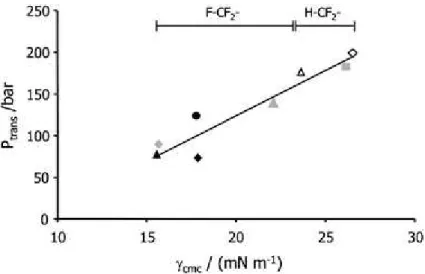
Fig. 1.5 Correlation between Ptrans (Pressure of phase transition, through cloud point
measurements) and surface tension at the CMC. Image taken from Eastoe et al.18 ... 5
Fig. 1.6 Relation between γCMC and the surfactant concentration. The point in which the CMC is
reached is highlighted. Figure adapted from Czajka et al.19 ... 8
Fig. 1.7 Measurements of AOT reverse micelles through several techniques compared with diffusion ordered NMR spectroscopy technique. Figure credits are due to Law et al.62 PGSTE refers to
Pulsed-gradient stimulated-echo (DOSY NMR technique); SAXS is Small angle X-Ray scattering; FCS corresponds to Fluorescence correlation spectroscopy. ... 9
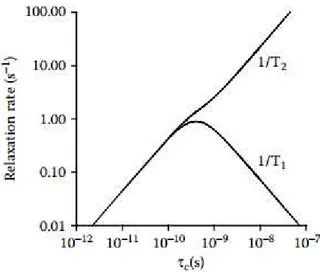
Fig. 1.8 Representation of the relaxation between the R1 and R2 relaxation rates and the correlation
time. Figure withdrawn from Kowalewski et al.69 ... 10
Fig. 1.9 Molecular weight dependence of correlation time for encapsulated proteins in different nonpolar solvents, and comparison with water. Figure withdrawn from Nucci et al.73 ... 11
Fig. 1.10 Molecular structure of HSA. ... 12
Fig. 1.11 HSA fibrillar or ribbonlike aggregates in organic solvents. Image removed from Terech et al.81 ... 12
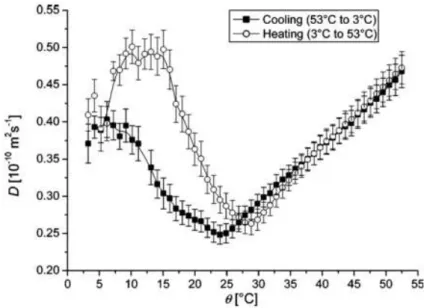
Fig. 1.12 Correlation between the diffusion of gelatin and temperature for both heating and cooling processes. Figure withdrawn from Brand et al.84 ... 13
Fig. 2.1 Water/AOT/isooctane phase diagram. Figure taken from De et al.93 ... 15
Fig. 2.2 Pictorial representation of the coated model of water droplets dispersed in isooctane. Adapted from Ric̆ka et al.94 rw is the water core radius; δ is the thickness of the the surfactant layer; rh is
the hydrodynamic radius of the droplet. Also displayed are the optical dielectric constants of the surfactant (εs), oil (εo) and water (εw) phases, which correspond to the square of the respective refractive
indexes. ... 15
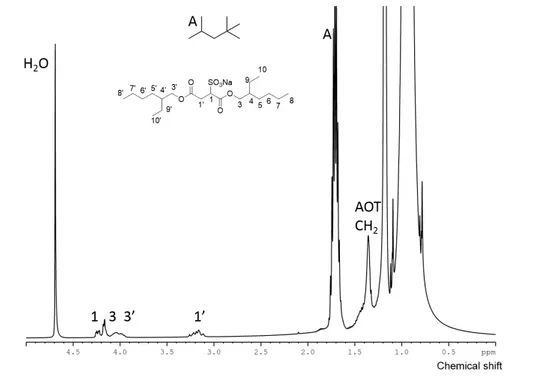
Fig. 2.3 Assigned 1H NMR spectrum of a 0.1M AOT in isooctane with water (ω0=40). ... 16
Fig. 2.4 Correlation between rh and ω0 determined experimentally by DLS (expt.) and by the coated
droplet model (cdm). ... 19
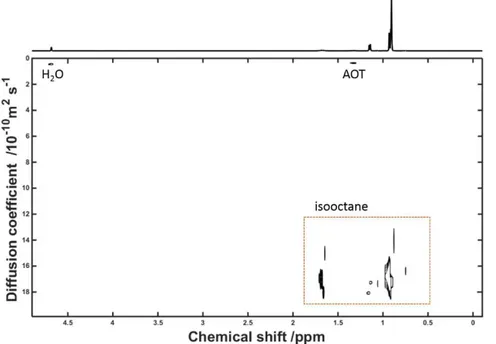
Fig. 2.5 DOSY plot of AOT RM in isooctane with water, ω0=50. In the figure, the regions pertaining
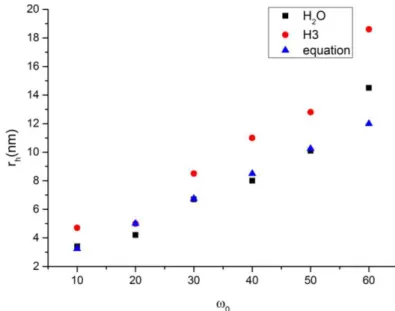
to the different components is identified. ... 20 Fig. 2.6 Relation between the hydrodynamic radii measured by DOSY (for the water and the H3 proton in AOT) and the amount of water dispersed in isooctane. Also shown are the hydrodynamic radii determined through equation (2). ... 21
Page | xvi
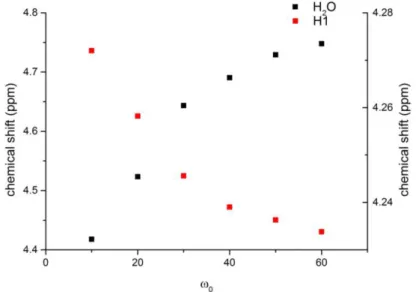
Fig. 2.8 Relation between the chemical shift displacements of water (left y axis) and AOT H1 proton (right y axis) and ω0. ... 23
Fig. 2.9 Plot between the H2O chemical shift and the microviscosity inside the AOT W/O droplets.
A linear fitting discarding ω0=20 was obtained, as depicted, with a R2=0.97 and a slope of -0.187. ... 24
Fig. 2.10 Plot between water diffusion coefficient and time allowed for diffusion in the AOT W/O solution with ω0=50. The error bars belong to the error of the fitting. ... 25
Fig. 2.11 Activity of water dependence with the increase of ω0. The figure was withdrawn from Luisi
et al.34 ... 26
Fig. 2.12 Plot between T1 relaxation times for H2O (left y axis) and AOT H3 (right y axis) protons
and ω0. The error bars result from the error associated with the exponential fitting. ... 27
Fig. 2.13 Plot between T2 relaxation times for H2O (left y axis) and AOT H3 (right y axis) protons
and ω0. The error bars result from the error associated with the exponential fitting. ... 28
Fig. 2.14 Relation between τc (correlation time) of water and AOT H3 protons of W/O AOT reverse
micelles and ω0.... 29
Fig. 2.15 Relation between aµη (radius of the relaxing nucleus) of water determined by the microviscosity inside the RM for AOT reverse micelles and ω0. ... 31
Fig. 2.16 Structure of D-(+)-Glucose and intramolecular distances determined from molecular mechanics using Chem3D Pro 14.0. a=6.864 Å; b=5.034 Å.... 32
Fig. 2.17 1H water suppressed NMR spectrum of D-(+)-Glucose with the respective assignment,
highlighting the proton bound to the anomeric carbon and the suppressed water peak. ... 34 Fig. 2.18 Plots between the chemical shifts of AOT H1’ protons, i) and half height line width in ω0=60 AOT W/O RMs, ii) with the evolution of the molecular weight for each carbohydrate molecule
dissolved. In ii) the left y axis refers to H1’ and the right y axis refers to An. ... 34 Fig. 2.19 Diffusion coefficients of different protons in ω0=60 AOT W/O RMs with three
different-sizes carbohydrates. This was assessed using a ledbpgpes2s pulse sequence.121 The error bars belong
to the error of the fitting. ... 35 Fig. 2.20 Relation between the hydrodynamic radii from the water diffusion coefficients in ω0=20
and ω0=60 AOT W/O RMs with three different-sized carbohydrates and without solute. ... 36
Fig. 2.21 Plot between water diffusion coefficient and time allowed for diffusion in the AOT W/O solution with ω0=60 and D-(+)-Glucose as a solute, studied by dstebgp3s. The error bars belong to the
error of the fitting. ... 37 Fig. 2.22 Spin-lattice relaxation times of the anomeric protons of three different-sized carbohydrates in ω0=20 and ω0=60 AOT W/O RMs. ... 38
Fig. 2.23 Emission (emi.) and excitation (exc.) spectra at 25º C (i) and at 40º C (ii) of Nile red in water, and aqueous solutions of AOT, 8mM and 30 mM. Excitation spectra were followed at the maximum emission wavelength. Right y axis – spectra in water; left y axis – remaining samples. ... 39
Fig. 2.24 Fluorescence spectra of Nile red in aqueous 30 mM AOT solutions with increasing pressure. ... 40
Page | xvii Fig. 2.26 1H NMR spectrum of AOT, H2O and ethanol in scCO2 (T=40.0º C and P=142.0 bar) with
the assignment of the components. ... 42 Fig. 2.27 1H,1H-NOESY spectrum of the AOT mixture in scCO2 (T=40.0º C; P=118.6 bar). The
cross relaxation line of the ethanol methylene peak is highlighted. ... 42 Fig. 2.28 1D projection (extracted from Fig. 2.27) of the NOE spectrum excited at the methylene peak of ethanol. ... 43
Fig. 2.29 Relation between half-height linewidth (i), chemical shift displacement, using the lowest pressure point as a zero (ii) and the pressure of the system bearing AOT and water, at 40.0º C. The methyl group of ethanol was used as a chemical shift reference and is therefore not depicted. In ii) the right y axis corresponds to AOT, whereas the left y axis corresponds to the remainder nuclei. ... 44
Fig. 2.30 Schematic representation of the NMR slice selection procedure. ... 46 Fig. 2.31 1H (i) and 13C, displaying only the CO2 signal (ii) slice selective spectra for a solution of
AOT with ethanol and water in 93.7 bar of CO2 at 40.0º C. ... 46
Fig. 2.32 1H (i) and 13C, displaying only the CO2 signal (ii) slice selective spectra for a solution of
AOT with ethanol and water in 151.7 bar of CO2 at 40.0º C. ... 47
Fig. 2.33 Plot between diffusion coefficients of the components in the AOT, ethanol, water in scCO2
mixture, at 40.0º C. The error bars belong to the error of the fitting. ... 48 Fig. 2.34 Relation between the spin-lattice relaxation time of the mixture components at 40º C and different pressures. The right y axis is the AOT scale, whereas the left one is used for the remainder of the protons. The error bars belong to the error of the fitting. ... 50
Fig. 2.35 1H NMR spectrum of a saturated D-(+)-Glucose solution in a solution of AOT, ethanol and
water dispersed in supercritical carbon dioxide at 141.4 bar at 40.0 ºC. ... 51 Fig. 3.1 Chemical structure of Ni(DODA)2 ... 57
Fig. 3.2 1H NMR spectrum of Ni(DODA)2 in toluene-d8, 5.0 wt%. ... 58
Fig. 3.3 1H DOSY spectra of Ni(DODA)2 (5.0 wt% in toluene-d8). t=48 min (i); Center: t=78 min (ii);
Right: t=infinite (iii). ... 58 Fig. 3.4 Representation of the diffusion coefficient of Ni(DODA)2 (5 wt% in toluene-d8)over time.
The error bars belong to the error of the fitting. ... 59 Fig. 3.5 Representation of ratio between the diffusion coefficients of Ni(DODA)2 (5 wt%)and
toluene-d8 over time. The error bars belong to the error of the fittings on this ratio. ... 59
Fig. 3.6 Diffusion coefficients plotted over time for HSA, 2.0 wt% in toluene-d8. The error bars
belong to the error of the fitting. ... 60 Fig. 3.7 DOSY spectra of HSA (1 wt% in toluene-d8). t=5 minutes and 35 seconds (i); t=54 minutes and 20 seconds (ii). ... 61
Fig. 3.8 Diffusion coefficients plotted over time for HSA, 1.0 wt%, in toluene-d8. The error bars
belong to the error of the fitting. ... 61 Fig. 3.9 Representation of ratio between the diffusion coefficients of HSA(1.0 wt%)and toluene-d8
over time. The error bars belong to the error of the fittings on this ratio. ... 61
Page | xviii
Fig. A.2 Relation between a (radius of the relaxing nucleus) of water protons of W/O AOT reverse micelles and ω0.... 68
Fig. A.3 Plot between microviscosity and ω0 in AOT W/O RMs with data from Rafiq et al,107 which
was fitted to obtain (24) with R2=0.991. ... 68
Fig. A.4 Molecular mechanics structure of D-(+)-Glucose obtained using Chem3D Pro 14.0.... 69
Fig. A.5 Molecular mechanics structure of D-(+)-Cellobiose obtained using Chem3D Pro 14.0. . 69
Fig. A.6 Molecular mechanics structure of D-(+)-Cellotriose obtained using Chem3D Pro 14.0. . 70
Fig. A.7 Structure of D-(+)-Cellobiose and intramolecular distances determined from molecular mechanics using Chem3D Pro 14.0. a=10.278 Å; b=10.385 Å.... 70
Fig. A.8 Structure of D-(+)-Cellotriose and intramolecular distances determined from molecular mechanics using Chem3D Pro 14.0. a=14.581 Å; b=13.738 Å.... 70
Fig. A.9 Diffusion coefficients of water in carbon dioxide at 35º C at different pressures. Data extracted from Xu et al.143 The equation for the trendline of the exponential fitting is (25) and was
obtained with a R2=0.98. ... 71
Fig. A.10 Solvent suppressed 1H NMR spectrum of saturated D-(+)-Glucose diluted in a D2O
Page | xix
LIST OF TABLES
Table 1.1 Data for surfactants developed for scCO2. All data were obtained at the water-air
interface Data attained at; a) 35º C. b) 25º C. c) 24º C. ... 6
Table 2.1 Properties for the components of water/AOT/isooctane ternary mixtures. δ is the thickness of the surfactant layer; νw is the volume of water; νs is the volume of AOT; n are the refractive
indices of the respective molecules; η corresponds to viscosity. ... 16
Table 2.2 DLS determined sizes of water droplets at different ω0. Experimental (expt.) rh and
polydispersity indexes (p) are presented. The coated droplet model (cdm) rh is also determined and the
diffusion coefficient (D) of the droplets is infered from it. The error for the DLS measurement was determined by the standard deviation of the several measurements conducted. The diffusion coefficient was determined by using (3), employing the viscosity of isooctane present in Table 2.1. ... 18
Table 2.3 Diffusion coefficients (D) and hydrodynamic radii (rh) taken from DOSY data for the H2O
and AOT H3 protons. The rh was determined using (3) and the viscosity in Table 2.1. ... 20
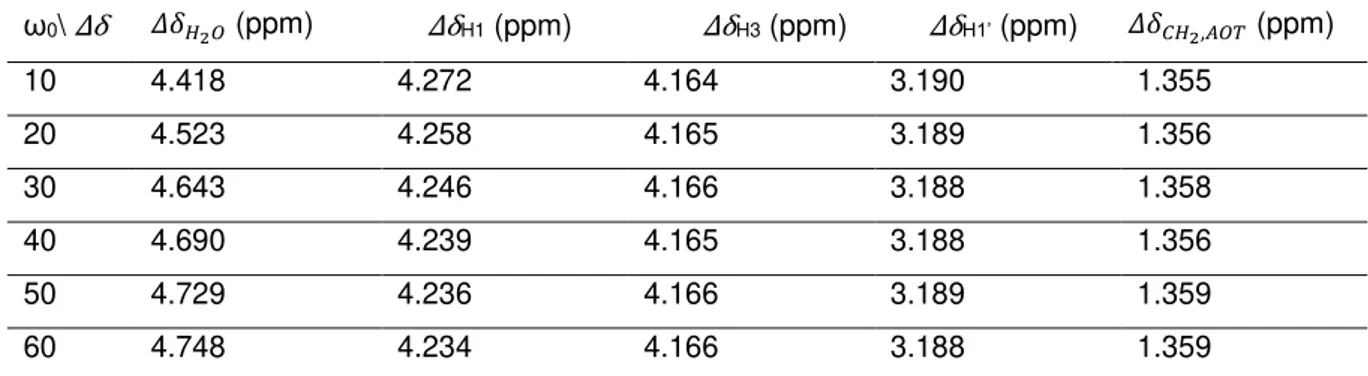
Table 2.4 Data obtained from chemical shift measurements of different protons in the solutions.
... 22
Table 2.5 Relaxation times (spin-lattice and spin-spin) for the W/O AOT RM solutions. ... 27
Table 2.6 NMR relaxation determined correlation times and sizes (a) of the aggregates responsible for the relaxation for AOT W/O RM solutions. The sizes were obtained from the viscosity of isooctane present in Table 2.1(aη) and for water it was also attempted to use the microviscosity defined previously to determine the size (aµη). ... 30
Table 2.7 Summary of the maximum distances (rmax) measured through MM for the carbohydrates
used in this study and the respective molecular weights (MW). ... 32
Table 2.8 Data obtained from water suppressed 1H spectra: chemical shifts (Δδ) and half-height
line width (ν1/2) for solutions of carbohydrates in AOT W/O RMs. ... 33 Table 2.9 Data obtained from the relaxation and diffusion ordered NMR spectroscopy studies for solutions of carbohydrates in AOT W/O RMs. T1 was assessed by t1iresgp; T2 was assessed by
presaturated CPMG for ω0=60 and CPMG for ω0=20; DOSY was acquired with ledbpgpes2s for ω0=60
and with dstebpgp3s for ω0=20. Diffusion coefficients (D) is displayed in m2 s-1. ... 35
Table 2.10 Diffusional data for water in carbohydrate solutions in AOT W/O RMs. This was obtained using a dstebgp3s pulse sequence to determine the hydrodynamic radius, employing the viscosity described in Table 2.1. ... 36
Table 2.11 λmax for the emission of the different samples with [NR] = 2X10⁻⁶ M in study at 25º C
and 40º C. ... 40 Table 2.12 Density and viscosity data for the different CO2 pressures at 313.15 K used during this
work. Mass of carbon dioxide determined from the Peng-Robinson equation.133 Remaining information
determined using NIST online tool.134 ... 41
Table 2.13 Observables (obs) taken from 1D 1H NMR spectra for the AOT mixture in scCO2, at
Page | xx Table 2.14 Diffusional data obtained from W/CO2 microemulsions at different pressures of carbon
dioxide. The diffusion coefficient of ethanol is the average between the diffusion coefficients of its methyl and methylene proton peaks and the error corresponds to its standard deviation. ... 48
Table 2.15 Spin-lattice relaxation data for the mixture of AOT, H2O and ethanol in scCO2 at 40º C
and at different pressures. ... 50 Table 2.16 Experimental amounts of the solution of AOT in isooctane and water added to prepare the different solutions used in this study. ... 53
Table A.1 Variation of microviscosity (µη) with ω0 for AOT W/O RMs, taken from Rafiq et al107 and
(24). ... 69 Table A.2 1H NMR chemical shift, line width and relaxation data summary obtained for a
D-(+)-Glucose 50mM solution in D2O. An is the proton adjacent to the anomeric carbon in the sugar molecule.
Page | xxi
TABLE OF ABBREVIATIONS AND NOMENCLATURE
Acronym Meaning
1D 1 dimensional
2D 2 dimensional
AcN Acetonitrile
AOT Sodium 1,4-bis(2-ethylhexyl) sulfosuccinate
approx. Approximately
cdm Coated droplet model
CMC Critical micelle concentration
CP-MAS Cross Polarization Magic Angle Spinning
CPMG Carr-Purcell-Meiboom-Gill
D Diffusion coefficient
d Doublet (NMR spectra)
DLS Dynamic Light Scattering
DOSY Diffusion ordered spectroscopy
EOR Enhanced oil recovery
EtOH Ethanol
expt. Experimental
g Grams
G Gauss
HP High pressure
HSA (R)-12-hydroxystearic acid
Hz Hertz
K Kelvin
kB Boltzmann constant
Lit. Literature
LMOG Low molecular-mass organogelators
m Meter
m Multiplet (NMR spectra)
M Molar
mmol Milimol
ms milisecond
MW Molecular weight
ND Not determined
Ni(DODA)2 Nickel di(9,10-dioxooctadecanoate)
NMR Nuclear Magnetic Resonance
NOE Nuclear Overhauser Effect
Page | xxii
º C Degree Celsius
PFG Pulsed field gradient
p-TSA p-toluenesulfonic acid
Ref. Reference
rh Hydrodynamic radius
RM Reverse micelle
s Second
s Singlet (NMR spectra)
SANS Small Angle Neutron Scattering
scCO2 Supercritical carbon dioxide
SCF Supercritical fluid
t Time
T Tesla
T1 Spin-lattice relaxation
T2 Spin-spin relaxation
Tg Temperature of gelation
TLC Thin layer chromatography
TMS Tetramethylsilane
W/CO2 Water-in-carbon dioxide
W/O Water-in-oil
Page | xxiv There is nothing that nuclear spins will not do for you,
Page | 1
1. INTRODUCTION
Over the course of this thesis, two main themes will be approached, both related to the formation of supramolecular aggregates from small molecular amphiphiles. The main subject is the development and characterization of reverse micelles in scCO2. This is done through NMR and spectrophotometric
techniques. The second one is the development of a novel NMR methodology for the characterization of the dynamics of formation of organogels formed by low molecular-mass organogelators (LMOGs). In this introduction, I will explore the state of the art for these two subjects and devise an outline for the whole thesis.
1.1. Supercritical CO
2and the solubilization of polar molecules
Carbon dioxide is an abundant atmospheric gas (approximately 400 ppm1) that results from
several natural and man caused activities, ranging from respiration to combustion. It is considered a greenhouse gas and its concentration has been steadily growing for several decades.1 Hence the
reduction of its presence in the atmosphere is a major goal worldwide. Research and development using this molecule have been of major relevance ranging from methodologies for its capture2, to the
employment of this as a substrate for chemical synthesis3 or as an industrial solvent.4 This might be
done by compressing CO2 into a liquid or a supercritical fluid. I will focus on the latter, which is obtained
at temperatures and pressures above its critical point: 30.97º C and 73.74 bar (CO2 phase diagram is
presented in Fig. 1.1).5
Fig. 1.1 Phase diagram of carbon dioxide, highlighting its critical point. Image taken from ref 6.
scCO2 is considered a green solvent, while comparing it to ordinary organic solventsa, due to being
nontoxic. It also possesses the advantage of being obtained at mild temperature conditions, which are biologically compatible, thus making it promising for bioengineering or preparation of pharmaceutically active compounds or formulations.7 It is simple to control its properties by altering the pressure and/or
a When in this thesis ordinary, regular or normal solvents are mentioned, these refer to common
Page | 2 the temperature of the system, which makes it a solvent tuneable for a wide range applications. Due to being in a physical state between liquid and gas it has low viscosity while also having liquid-like solvent densities.8
Turning now to carbon dioxide as a molecule, one can easily understand it has a zero dipole moment.8 This is due to the fact that it has two dipoles that cancel each other out, having though an
overall quadrupolar moment (Fig. 1.2 i) (A)). It also has a low dielectric constant, being approx. 1.0, varying with density.9 All of these considerations would let us to guess that, as a solvent, CO2 would
behave as an alkane-like liquid. However, hydrocarbon molecules are not highly soluble in scCO2.10,11
Indeed, the described CO2-philic molecules range from fluorocarbons (the main CO2-philes11) to
carbonyl containing molecules,12 but also others such as amines,13 poly- or oligoethylene oxides,14 or
sugar acetates.15 scCO2 is considered a nondipolar solvent and its properties actually make it resemble
with solvents such as benzene or hexafluorobenzene, also quadrupolar molecules.16 In fact, its net
dipole moment is zero, however it is a charge separated molecule bearing several nonzero dipole moments.8 In a microscopic level, this allows CO2 to have mainly quadrupolar dipolar solvent-solute
specific interactions, having the ability to act as a weak Lewis acid or as a Lewis base.8 It can establish
hydrogen bonding interactions, which account, per example, for its strong interactions with carbonyl groups12, but also for its reasonably high solubility (while comparing to carbon monoxide8) in water (Fig.
1.2 ii).17 One example that shows how CO2 behaves alike a polar molecule is its strong solubility of
fluorinated compounds. Even though there is not a consensus on why this happens, it has been shown that CO2 interacts more strongly with more polar fluorinated molecules, rather than with those with lower
or no polarity.10
Fig. 1.2 i) Dipoles present in water (A) and carbon dioxide (B) molecules. ii) Interactions established between CO2 and carbonyl compounds. Adapted from Raveendran et al.8
Despite being considered as a polar molecule, the solubility of water in CO2 is low (approx. 0.14%
at 15º C and 450 bar18), and to take advantage of the properties of this solvent with polar molecules
strategies have been devised for it to solubilize water. Even though molecular interactions (demonstrated through the difference in dipole moments in Fig. 1.2 i)) may account for a part of this behaviour, surface tension (γ) plays a significant role. This is a property that arises from the fact that at the liquid-air interface, the last layer of molecules do not have more neighbours and due to that are attracted to the bulk. This results in an energy imbalance at the surface relative to the bulk, which is surface free energy.19 Liquids organize themselves to have the minimum exposure to the surface thus
minimizing this interaction. Water has a particularly high surface tension (71.99 mN m-1 at 25º C20),
Page | 3 added to the mixture, in order to form a microemulsion (these are usually tensioactive molecules that adsorb to the interface and result in a reduction of the surface tension19), usually a reverse micelle.18
This might be done employing amphiphilic polymers 21–23 or surfactants (these might be single24,25, di-25,26 or tri-chain25 surfactants or even dendritic surfactants27). It is also worth to add that such
microemulsions might be formed in surfactant free conditions, either adding acetone28 or functionalized
bi-wetting particles.29 In this work, the main focus will be on surfactant formed reverse microemulsions
and this will be further discussed in 1.1.1.
1.1.1. Surfactants and micellar systems
When two solvents are put together they can mix into a homogeneous phase if these are mutually soluble. If immiscible, the two liquids can form two phases or they might form an emulsion, depending on the phase volumes.30 An emulsion is a colloidal system in which droplets are dispersed in a liquid.31
These might be classified according to composition, and the simplest ones rely on the existence of an oil and an aqueous phase. Depending on which is dispersed in the other these might be oil-in water or water-in-oil emulsions. In this work, we will focus on the latter. In order to form these droplets there is an increase in interfacial tension, hence work is needed to form an emulsion. The amount will depend on the characteristics of each system however, this might be dropped by the addition of an emulsifying agent that will adsorb to the surface and lower the energy of formation and stable droplets are more easily formed.30 As it was already introduced in 1.1, these substances are tensioactive and are known
as surfactants. While these might be useful for several applications ranging from detergents to inks, passing by enhanced oil recovery, in this work we will focus on their role as de-emulsifiers.30 Indeed,
while added to water dispersed in oil phase, these avoid the formation of a nonhomogeneous phase and yield microemulsions, which are thermodynamically stable, forming small droplets (usually up to 10 nm radius) that usually are spontaneously formed. The structures formed are commonly reverse micelles (as depicted in Fig. 1.3), monolayer aggregates that are commonly monodisperse in these conditions.30
Fig. 1.3 Aggregation model of a water-in-oil reverse micelle. Figure adapted from Kilikian et al.32
It is characteristic of surface active molecules to be amphiphilic, having a polar head and a nonpolar
Page | 4 micelles, which are monolayer assemblies. Structure-wise hydrophilic and lypophilic (here named reverse) micelles are alike. However, as shown in Fig. 1.3, reverse micelles have the polar heads turned inside, towards the water pool. Surfactants that may allow these type of aggregates can be either ionic (such as AOT) or non-ionic (i.e. Span or Tween).33 These have been widely studied and several
concepts around it are fairly well known.
Critical micelle concentration (CMC= is the minimum concentration in which the aggregates are obtained, although its value is not easily attainable due to the nature of the mixture.33 Although, it is
noted that the CMC may depend on the amount of water present in the system (ω0). It is considered
that the concentration might range between 10-5 and 10-2 M.33 The shape of reverse micelles is usually
considered as spherical, due to steric interactions, though in oil phases it is described that ellipsoid shapes, among others can also easily occur.33 This also may depend on the counterion, when
considering ionic surfactants, the size and interactions may have an important role on the aggregation process. One shall also describe the system employing a ratio between the concentrations of water and surfactant (ω0):
𝜔0=[𝑆𝑢𝑟𝑓𝑎𝑐𝑡𝑎𝑛𝑡][𝐻2𝑂]
(1)
This allows to understand the amount of water dispersed in the oil phase and furthermore will relate to some properties of the micelles, mainly its size. This is well documented for AOT (the main molecule studied throughout this thesis, which is depicted in Fig. 1.4), that has a linear relation between its hydrodynamic radius (rh) and ω0 (shown in (2) in Å).34
𝑟ℎ= 15 + 1.75𝜔0
(2)
Through AOT reverse micelles it is possible to achieve ω0=60,35 which, applying (2) corresponds
to a hydrodynamic radius of 12.0 nm. This allows to encapsulate reasonably large molecules, such as biopolymers like proteins. This has been a relevant application for these reverse micelles.34
Fig. 1.4 Molecular structure of AOT.
Even though colloid scientists have already properly described the properties of W/O microemulsions, the case when the oil phase is a supercritical fluid gains further complexity. It is necessary to lower the surface tension of water, which is the same valid for the regular microemulsions however, it is also necessary that surfactant is soluble in scCO2. This is a difficulty because, as it has
been stated earlier on, hydrocarbons do not have high solubility in CO2, and most surfactants have
Page | 5 achieve reverse micelles of AOT it is necessary to add a co-surfactants, such as ethanol or propanol.38– 40 And the aggregation of AOT in isooctane is also influenced by the addition of carbon dioxide, which
results in the reduction of its CMC.41 Hence, AOT certainly has some characteristics that allow it to
interact with CO2 and researchers have found that a while ago.42 Some of those derivatives are
presented in Table 1.1 with the data for its surface tension at the water-air interface. This has been described as a good reporter for the CO2-philicity of tensioactives, as represented in Fig. 1.5.18
Furthermore this figure demonstrates that more highly fluorinated molecules are more soluble in CO2.
This, as mentioned before in this introduction, has been a subject of major discussion. In Table 1.1 it is possible to confirm precisely that fluorocarbon surfactants are clearly better than hydrocarbon ones, looking at entries 1, 2 and 3, which are among the best surfactants for CO2 described in the literature.
This, as entry 2 demonstrates, is not only valid for AOT derivatives. In this case this is a fluorinated sugar derivative. Sugar molecules can also be a template for other surfactant development endeavours such as Cássio et al43 suggested. Also, if a fluorocarbon phosphate is employed, instead of a sulfonate
molecule, good scCO2 solubility may also be achieved.44
Fig. 1.5 Correlation between Ptrans (Pressure of phase transition, through cloud point measurements) and
surface tension at the CMC. Image taken from Eastoe et al.18
Using fluorinated surfactants instead of hydrocarbon ones is both more expensive, which make them industrially less desirable, and health hazardous. Therefore several researchers, mostly the groups of Eastoe and Sagisaka, have tried to reach CO2-philic hydrocarbon surfactants. The strategy is
to get close to the surface tension of hexane, which is 17.89 mN m-1 at 25º C.20 Hexane has such a low
(comparing to other solvents) surface tension due to the close packing of its alkyl chains. Hence, using AOT as a template is interesting because it allows for the molecule to have two chains reasonably close to each other. However, AOT itself does not allow for tight packing, hence researchers have started to use more highly branched derivatives, such as entries 5, 6 or 10 in Table 1.1. Branching has been shown to enhance tail solvation, and to significantly increase the adsorption of the surfactant to the surface, hence minimizing the interactions between the two phases.45 Nevertheless, the effect is not
Page | 6
Table 1.1 Data for surfactants developed for scCO2. All data were obtained at the water-air interface Data
attained at; a) 35º C. b) 25º C. c) 24º C.
Entry Surfactant γcmc (mN m-1) CMC (M) Ref.
1
17 4.3x10⁻⁴ 47 a)
2
17.4 3.9x10⁻⁴ 48 b)
3
20 2.7x10⁻⁴ 49 a)
4
22.5 4.7x10⁻² 26 b)
5
23.8 1.62x10⁻² 46 a)
6
24.0 6.31x10⁻⁴ 46 a)
7
25 1.5x10⁻³ 24 a)
8
25.6 1.7x10⁻⁴ 50 c)
9
26 8.8x10⁻⁴ 49 a)
10
27 - 42
11
27.0 2.2x10⁻² 25 b)
12
Page | 7 carbonyl functional groups interact favourably with CO2, these are indeed found in the sulfosuccinate
moieties of AOT derivatives, but it has been already attempted to insert these in the side chain, as it is the case of AOK.51 This approach has shown also to be a promising one towards the design of
surfactants. To even improve this effort, it has been attempted to combine alkyl and fluorinated chains (one in each ester group of the sulfosuccinate moiety), to obtain hybrid surfactants.52,53 This has shown
to be successful, as entry 4 demonstrates. This molecule is highly CO2-philic, having only 5 fluorine
atoms. This is a compromise between fluorine content, CO2 solubility and water incorporation, which
has been approximately reached. Despite the progress made, research is still far from the goal to reach the surface tension of hexane. Other goals can be found if one looks at the surface tensions of different organic solvents. One of those is diethyl ether (γ =16.65 mN m-1 at 25º C20) that has a lower surface
tension than even water with fluorocarbon surfactants. Indeed, researchers have been using from earlier on surfactants bearing oxyethylene moieties, which are ethers and might also help lowering the surface tension.54 Entries 2, 8 and 9 have this moiety and prove to be good efforts. This approach has not been
fully explored though. One other solvent that has a low surface tension is trimethylamine (γ =13.41 mN m-1 at 25º C20). The fact that it is an amine is also interesting in the CO2 context, since amines (mostly
primary and secondary ones) react with CO2 to yield carbamates. Smith et al.13 have described several
tertiary amine esters that lower the surface tension of CO2-in-water microemulsion, but are not so
suitable for water-in-CO2 reverse micelles, due to electrostatic repulsion
The understanding of how surfactants work at the carbon dioxide interface is crucial for the design of novel effective surfactants. Molecular dynamics studies have been done to compare two phosphate surfactant analogues, one fluorinated and the other having an alkyl chain instead.55 These hinted that
the hydrocarbon amphiphile has a higher penetration of both water and CO2 in the surfactant layer
relative to the fluorocarbon one. This will result in a higher surface tension thus having the opposite effect of what is desired. Although this goes to show that more favourable interactions with fluorine atoms are not directly responsible for its higher solubility and hydrocarbon surfactants that have a lower penetration in the micellar layer, perhaps through branching as suggested, will be more CO2-philic.
1.1.2. Characterization of RMs through NMR spectroscopy
In order to understand if stable water pools are obtained, as the properties and spatial organizations of these, it is necessary to employ different characterization techniques. In general, to analyse microemulsions in the scCO2 phase is not much different from what is done in regular oil phase
reverse micelles. The major difference is that it has to be conducted in a high pressure apparatus. One measurement that allows to understand whether or not a stable microemulsion is formed is the observation of the cloud point, the maximum pressure (or temperature) at which a visible emulsion is observed. This can be aided by spectrophotometric techniques. One thing that can also be easily done is to put into the mixture a water soluble dye that will only show either absorption or emission if incorporated in a reverse micelle.56 Light scattering techniques are commonly employed to characterize
the dynamics of reverse micelles, since these disperse light.30 In the case of DLS, it is possible to obtain
Page | 8 radius of the micelle (through the Stokes-Einstein equation, (3), in which kb is the Boltzmann constant, T, the temperature, η is the viscosity of the medium and rh is the hydrodynamic radius of the diffusing
species).
𝐷 =6𝜋𝜂𝑟𝑘𝑏𝑇
ℎ
(3)
Although this is a common procedure for characterizing reverse micelles in organic solvents, it has only recently been adapted to W/CO2 microemulsions.56 In this study, this technique was used as a
size-controlling aid, which is a matter of relevance for applications.
Many techniques can be employed to determine whether or not an aggregate is obtained. Tensiometric measurements are extremely powerful, because these allow to determine the CMC, since a plateau is reached from the CMC on to higher concentrations (Fig. 1.6). As it was discussed earlier on, surface tension at the water-air interface is a relevant indicator of CO2-philicity, however interfacial
tension in scCO2 can also be measured and is an indicator of the stability of the mixture.57
Fig. 1.6 Relation between γCMC and the surfactant concentration. The point in which the CMC is reached is
highlighted. Figure adapted from Czajka et al.19
The techniques previously described are useful to assess the existence of aggregates, but not so much the dynamics and structure of the networks formed (on the exception of DLS). For that one can use other spectrophotometric approaches, such as fluorescence anisotropy or vibrational spectroscopy (IR and Raman spectroscopies).58 Other than that, SANS is probably the most efficient reporter of size,
and dynamics of the aggregates in scCO2, from which it is possible to obtain the scattering from the
different components of the mixture and thus assessing its shape and stability.22 Nevertheless, in this
Page | 9 The characterization of reverse micellar behaviour through solution state NMR has been significantly exploited and different observables are taken into account. First of all, some information about aggregation may be withdrawn from simple one-dimensional spectra observables, such as chemical shift and line width. Getting from a state of free dissolved molecules to aggregates, a change in both of these is expected. The chemical shift is not only affected by the intramolecular environment but also by its surroundings. Stahla et al60have shown that for the case of reverse micelles of AOT
having different counterions, the chemical shifts are different, as is the line broadening. Chemical shift can even be used to estimate the size of the water droplets in W/O AOT reverse micelles.61 There is
though a more efficient way to perform this through NMR spectroscopy. Alike what is done through DLS, the diffusion coefficient can be measured through diffusion ordered spectroscopy (DOSY). This is done by the measurement of the signal attenuation in a gradient stimulated spin echo. By obtaining the diffusion coefficient, D, it is possible, through (3), to obtain the hydrodynamic radius. This has already been described for W/O AOT reverse micelles and it shows a good relation with data obtained from other techniques, even though there is a size overestimation (Fig. 1.7).62
Fig. 1.7 Measurements of AOT reverse micelles through several techniques compared with diffusion ordered NMR spectroscopy technique. Figure credits are due to Law et al.62 PGSTE refers to Pulsed-gradient
stimulated-echo (DOSY NMR technique); SAXS is Small angle X-Ray scattering; FCS corresponds to Fluorescence correlation spectroscopy.
DOSY is a way of studying translational motions that occur in the ms to s timescale. However, it is also possible to study through NMR quicker rotational motions (sensitive to motions of ns or ps) through spin-lattice (or longitudinal, T1) or spin-spin (or transverse, T2) relaxation measurements. The dynamics of water entrapped in AOT-based RMs has already been studied through these techniques and it was possible to conclude that water is confined in small water pools.63 These techniques have also been
employed to observe the phenomenon of percolation and different properties associated to it.64
These techniques are powerful and have already been applied to study W/CO2 aggregates. The
acquisition of DOSY and relaxation spectra throughout different pressures allowed to assess the water droplet size evolution or the specific motions existent in a certain surfactant.22,65,66 Thurecht et al66 were
Page | 10 interactions. More recently, 129Xe NMR has been applied to a W/CO2 microemulsion. This nucleus is
highly sensitive to the change in molecular environment and just by measuring its chemical shifts it was possible to witness aggregation occurring.68
1.1.3. Applications to NMR spectroscopy
Setting aside characterization, reverse micelles can also be useful media for NMR studies. One of the main issues in NMR spectroscopy is sensitivity. One of the problems underlying this is the loss of signal due to relaxation (spin-spin relaxation). To avoid this modern NMR experiments employ deuterated solvents. Since deuterium is a quadrupolar nucleus, relaxation processes of 1H nuclei
through it are significantly lower than with other 1H nuclei. This is mainly an issue for large molecules
which have slow tumbling, such as proteins. This is due to R2 (the rate that leads to transverse
relaxation) being directly proportional to the correlation time (τc) of the nucleus (Fig. 1.8). In its turn, τc
is directly related with molecular size, thus macromolecules have short relaxation times.69
Fig. 1.8 Representation of the relaxation between the R1 and R2 relaxation rates and the correlation time.
Figure withdrawn from Kowalewski et al.69
To avoid this phenomenon, a strategy that has been devised is to encapsulate proteins inside reverse micelles that are dispersed in low viscosity fluids, such as alkanes.70 The desired effect can be
confirmed in Fig. 1.9. Since scCO2 is even less viscous than common organic solvents, it might be even
more advantageous to employ it in these studies. This is easily verifiable by observing the behaviour for compressed ethane. Valentine et al71 have also shown that it is possible to use RMs as a medium for
Page | 11
Fig. 1.9 Molecular weight dependence of correlation time for encapsulated proteins in different nonpolar solvents, and comparison with water. Figure withdrawn from Nucci et al.73
1.2. Molecular gels
Gels are dispersions with such strong attractive interactions between the gelator molecules that these form a rigid network.30 A gel has a continuous structure with macroscopic dimensions that is
permanent on the time scale of an analytical experiment and, rheologically it is solid-like below a certain stress limit, behaving as viscoelastic materials.74 Alike what was discussed the in section 1.1, these
might be formed from polymeric or small amphiphilic molecules. Even though some differences exist, those rely mostly on the forces holding the aggregates together being stronger in gels rather than in micelles. A surfactant that forms micelles in certain conditions can form gels in favourable circumstances.30 Alike what is seen in surfactants, there is a critical gelator concentration (CGC), the
minimum concentration to achieve a gel phase. To have the formation of this dispersion it is necessary to have an impulse. This might be the addition of a catalyst that triggers a reaction, it might be a light stimulus that provides an isomerization or an increase in temperature that allows the system to surpass an energetic barrier. In this work molecular gels will be employed to achieve these aggregates. These molecules immobilize their liquid component macroscopically, by surface tension and capillary forces. Despite that, the liquid still presents mobility within the networks.74
A gel might be classified according to its solvent, thus there are organogels and hydrogels, but also due to its gelator, which can be polymeric, an organic molecule or an organometallic one. In this work will focus of molecular gels, formed by LMOGs (the latter two types of molecules fit in this category). These are usually formed at a low concentration (usually below 2 wt%).75 These molecules
self-assemble through highly specific interaction forming commonly fibers or strands, often having a crystalline structure. The forces that might give rise to these assemblies are H-bonding, π-π stacking or even London dispersion forces.75 Different kinds of structural assemblies can give rise to gels. Molecules
Page | 12 aliphatic molecule and derivatives, which have been widely studied by the Weiss group, (R)-12-hydroxystearic acid (HSA, ).76–78
Fig. 1.10 Molecular structure of HSA.
HSA is a chiral molecule that under solution conditions forms a micelle, but as a gel it forms a left-handed chiral mesophase, which yield helically twisted fibers (Fig. 1.11).79,80 These are held together by
dipolar interactions among the polar carboxylic groups and unidirectional hydrogen bonds through the hydroxyl group at C12.81 It forms a gel in several solvents, such as n-hexane, carbon tetrachloride or
toluene. In this solvent, it forms a clear gel, with a Tg of 44-45º C.76
Fig. 1.11 HSA fibrillar or ribbonlike aggregates in organic solvents. Image removed from Terech et al.81
1.2.1. Structural studies of molecular gels
The purpose of this section of the work is to understand the dynamics of formation of tridimensional gel networks. Alike what was mentioned in the case of reverse micelles, a plethora of techniques can be used for this purpose. One can follow the formation through microscopy or through spectrophotometric technique or even through SANS. Different approaches may be taken. However, in this work the focus will be on NMR spectroscopy, because it allows to follow both the kinetics of formation and the structure of the network being formed, which is the main advantage. The principles behind the experiments have been presented in section 1.1.2, so only applications and results will be referred from now on. NMR spectroscopy has been widely applied to study gels, both polymeric gels and LMOGs.82 Aggregation and behaviour can be followed by chemical shift and line broadening and
Page | 13 Spinning techniques like CP-MAS must be used.82 However, since the goal is the dynamics of formation,
two major techniques will be employed, DOSY and relaxation (both T1 and T2).
DOSY is widely described as being an effective technique to differentiate molecules according to their size, without any actual separation process.83 This is true for complex mixtures of different
compounds but it can also be applied to the case of aggregating molecules, in which differently-sized assemblies can exist. The gelation point of gelatin was first presented by DOSY NMR by Brand et al.84
The sample was heated and cooled, as shown in Fig. 1.12, and a minimum in D was obtained at approximately 25º C, which was considered the Tg. This is a counterintuitive result, the gel phase has
an increase in diffusion coefficient comparing to Tg. This might be due to the fact that larger aggregates
are attached to the gel phase thus NMR invisible, by having a quick relaxation process. By decreasing the temperature, only smaller aggregates will be in the solution phase. A similar result was observed by Nonappa et al85 that performed a titration with a cholic acid derivative. A similar decrease in D was
achieved while nearing CGC and then an increase in the gel phase was obtained. A diffusion coefficient increase in the gel phase was not observed for other gel systems,86–88 which is a hint that it is possible
to assess different types of packing through DOSY. The time of gelation has also been assessed through DOSY for a concentrated casein suspension.89 The data obtained in the mentioned works made it
possible to understand the dynamics of the gelation processes. A similar work can be done, and has been done, through relaxation measurements, which are also useful in determining the gelation point and the dynamics of gel structures, that in this case related to rotational motions.90,91 A combination of
these two types of techniques is ideal for the NMR characterization of gels. García-Aparicio et al92
followed the elution of molecules in chitosan gel phases through slice selective NMR. This is a promising result that might allow to use gel phases as chromatographic phases for NMR studies.
Page | 14
1.3. Thesis outline and objectives
The work conducted throughout this thesis has two different parts that are however connected by the study of molecular assemblies formed by small amphiphilic molecules and the use and development of NMR methodology to study these systems. One of the major objectives is to develop and to apply a concise NMR approach towards observing motions and study what implications these have for the behaviour of materials and to understand how we can use them to improve spectroscopic studies.
The core subject of this work deals with reverse micelles both in a nonpolar solvent as in scCO2.
In this work, AOT will be used as a model molecule to develop the application of NMR techniques such as DOSY and relaxation measurements. One purpose of this work is to understand how polar molecules behave inside water droplets dispersed in low viscosity fluids. This has the long term purpose to achieve a more effective system to perform NMR spectroscopy of biomacromolecules. Another aim is to developed new surfactant for W/CO2 microemulsions to develop these NMR studies. To make it more
affordable to use these systems, fluorinated surfactants are avoided. This is meant as a proof of concept study thus only preliminary studies are conducted.
Part of the work (4 months) was conducted at Georgetown University, at Prof. Richard Weiss’ group, as part of the InTechSE project. In this framework, a collaboration was developed to study molecular gels through NMR. More specifically, this work aims to demonstrate that DOSY NMR is a technique that can study the dynamics of gelation and assess the time of gelation in gels formed by LMOGs. This work is based in HSA and derivatives.
Page | 15
2. CHARACTERIZATION AND DYNAMICS OF REVERSE MICROEMULSIONS IN
ORDINARY AND SUPERCRITICAL SOLVENTS
In this chapter, I will unravel the path undertaken from the analysis of AOT RMs in isooctane by DLS and NMR to the application of an identical methodology to a W/CO2 microemulsion. The main
aspect of this work is to develop an NMR methodology to determine size, aggregational behaviour and study dynamics of micellar assemblies in scCO2 environment.
2.1. Development of a NMR methodology to characterize W/O reverse micelles
In order to develop the methodology to study W/CO2 microemulsions through HP-NMR, a model
system of AOT-based W/O microemulsions was utilized. This is a fairly well-known system and it was simply necessary to ensure that the conditions used would lead to stable RMs. The phase diagram for this ternary mixture is described in the literature (Fig. 2.1).93 If the AOT concentration is too high, other
types of phases will be formed. However, in reasonably low concentrations of AOT and small amounts of water dispersed in the oil phase, it is possible to obtain stable RMs. In this work, a 0.1 M concentration of AOT in isooctane and ω0 up to 60 were employed.
Fig. 2.1 Water/AOT/isooctane phase diagram. Figure taken from De et al.93
In the devised system, water droplets are dispersed in the oil, coated with a surfactant monolayer, as displayed in Fig. 2.2. These are properties inherent to the system and therefore are listed in Table 2.1.
Page | 16
of the droplet. Also displayed are the optical dielectric constants of the surfactant (εs), oil (εo) and water (εw) phases,
which correspond to the square of the respective refractive indexes.
Table 2.1 Properties for the components of water/AOT/isooctane ternary mixtures. δ is the thickness of the surfactant layer; νw is the volume of water; νs is the volume of AOT; n are the refractive indices of the respective
molecules; η corresponds to viscosity.
Property Value Ref.
MW (g mol-1) 444.56
δ (nm) 1.1 95
νw (nm3) 0.03 94
νs (nm3) 0.63 94
n (AOT) 1.463 94
n (water) 1.3325029 96
n (isooctane) 1.3914
η (isooctane) (cP) 0.474 97
The core section of this work is to develop and apply an NMR methodology. Therefore, first of all, the assignment for the 1H NMR spectrum of AOT in isooctane with encapsulated water is necessary.
This is presented in Fig. 2.3, where the methyl groups of the surfactant and most of isooctane (its 1H
NMR spectrum can be found in Fig. A.1) are not identified, due to being overlapped thus difficult to study through the NMR approaches used. This is mostly due to isooctane not being deuterated, which was considered unnecessary since the signals of water and surfactant heads are further downfield.
Fig. 2.3 Assigned 1H NMR spectrum of a 0.1M AOT in isooctane with water (ω0=40).
Page | 17 a new light on a vastly researched system, still with several mysteries. Frank et al98 said, in the first work
of the sort that “proton magnetic resonance measurements offer those interested in the complex equilibria associated with micellar solubilization of water an excellent tool for study, particularly if higher degrees of resolution and peak detection can be utilized”. NMR spectroscopy has certainly come a long way since 1968, and in this work we will approach the same target, but with new tricks. In order to develop methodology, from now the NMR and DLS studies with different concentrations of water in the solution are presented.
2.1.1. Size determination of RMs
One of the most relevant parameters of RMs is its size. If one wishes to encapsulate polar molecules in these, one must pay attention to the relation of size between the solute and the aggregate. In the case of AOT, as aforementioned, the size of W/O microemulsions depends on the amount of water dispersed in the hydrophobic phase (2).
2.1.1.1. Dynamic Light Scattering determination
A water droplet dispersed in an oil phase scatters light. If the scattered light intensity is followed over time and it has a Brownian motion, it is possible to obtain its diffusion coefficient and employing (3)
its hydrodynamic radius. This is essentially the principle of DLS. This technique has been vastly employed to study W/O reverse micellar systems and more specifically employing AOT as the tensioactive agent.95,99,100 Since water droplets are dispersed in an oil phase, several refractive indices
are involved (as can be confirmed by Table 2.1). This results in the optical polarizability not having the same evolution as in other scattering systems. The diffusion coefficients determined by DLS do not evolve linearly with the size of the droplets dispersed in the oil phase, having even a point at which the scattering intensity approaches zero due to optical matching of the water and the continuous phase.94
Therefore, a model has been devised, the coated droplet model, which allows for a more accurate size determination. The following equations are employed to obtain the hydrodynamic radius of the aggregate:
𝑟ℎ = 3𝛿𝜔𝑦01 + 3𝛾1 + 2𝛾 𝐴
𝐵 − (29)(𝜔) 𝐶𝑦
(4)
𝐴 =(1 + 5𝛾)(1 + 4𝛾) (1 + 2𝛾)(1 + 2𝛾) (
𝜔0
𝑦 )
2
+ 2𝜈1 + 4𝛾 1 + 2𝛾
𝜔0
𝑦 + 𝜈2
(5)
𝐵 =(1 + 4𝛾)(1 + 3𝛾)(1 + 2𝛾)(1 + 2𝛾) (𝜔𝑦 )0 2+ 2𝜈1 + 3𝛾1 + 2𝛾𝜔𝑦 + 𝜈0 2
Page | 18 𝐶 =(1 + 3𝛾)(1 + 2𝛾) (𝜔𝑦 )0 2+ 2𝜈𝜔𝑦 + 𝜈0 2
(7)
In which y is the polyspersity (which corresponds to the square of the polydispersity index, p). y is
the ratio between the volumes of surfactant and water molecules (𝑦 = 𝑣𝑠 𝑣 𝑤
⁄ ). Finally, ν can be found in (8). All of these parameters have been previously described in either Fig. 2.1 or Table 2.1.
𝜈 =
𝜀𝑠− 𝜀𝑜
𝜀𝑠− 2𝜀𝑜
𝜀𝑤− 𝜀𝑜
𝜀𝑤− 2𝜀𝑜
(8)
For each ω0 several experiments were conducted, in order to obtain an average of the
hydrodynamic radius determined. In order to apply the coated droplet model, the experimental data necessary is the polydispersity index. Due to optical matching, this observable gets high near ω0=20 (in
this case this is especially true for ω0=30), as it can be verified in Table 2.2. Hence, an average of all
the remaining polydispersity indices (all but the two mentioned conditions) was used in the determination of each hydrodynamic radius (paverage=0.189). For droplets with small water pools (below ω0=10) this
model was not applied due to the low scattering intensity they provide. A summary of the experimental data obtained through DLS is shown in Table 2.2.
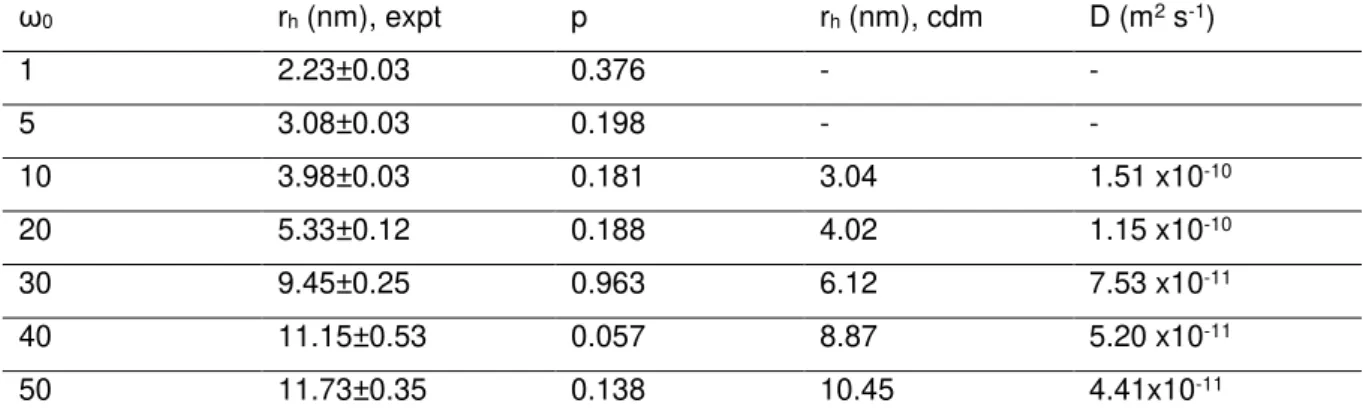
Table 2.2 DLS determined sizes of water droplets at different ω0. Experimental (expt.) rh and polydispersity
indexes (p) are presented. The coated droplet model (cdm) rh is also determined and the diffusion coefficient (D) of
the droplets is infered from it. The error for the DLS measurement was determined by the standard deviation of the several measurements conducted. The diffusion coefficient was determined by using (3), employing the viscosity of isooctane present in Table 2.1.
ω0 rh (nm), expt p rh (nm), cdm D (m2 s-1)
1 2.23±0.03 0.376 - -
5 3.08±0.03 0.198 - -
10 3.98±0.03 0.181 3.04 1.51 x10⁻¹⁰
20 5.33±0.12 0.188 4.02 1.15 x10⁻¹⁰
30 9.45±0.25 0.963 6.12 7.53 x10⁻¹¹
40 11.15±0.53 0.057 8.87 5.20 x10⁻¹¹
50 11.73±0.35 0.138 10.45 4.41x10⁻¹¹
The hydrodynamic radii obtained in this study using DLS are in agreement with the literature, as is the evolution with the amount of water dispersed in the continuous oil phase (Fig. 2.4).95 Hence this is