Lucas Eduardo de Oliveira Aparecido(1) and Glauco de Souza Rolim(1)
(1)Universidade Estadual Paulista, Faculdade de Ciências Agrárias e Veterinárias, Departamento de Economia, Administração e Educação, Via de Acesso Prof. Paulo Donato Castellane, s/no, CEP 14884-900 Jaboticabal, SP, Brazil. E-mail: lucas.aparecido@ifms.edu.br, rolim@fcav.unesp.br
Abstract – The objective of this work was to develop agrometeorological models for the forecasting of the annual yields of Arabic coffee (Coffea arabica), using monthly water deficits (DEFs) during the coffee cycle,
in important locations in the state of Minas Gerais, Brazil. For the construction of the models, a meteorological
data set spanning of 18 years and multiple linear regressions were used. The models were calibrated in high- and low-yield seasons due to the high-biennial yields in Brazil. All calibrated models for high- and low-yield
seasons were accurate and significant at 5% probability, with mean absolute percentage errors ≤2.9%. The
minimum forecasting period for yield is six months for southern Minas Gerais and Cerrado Mineiro. In
high‑yield seasons, water deficits affect more the reproductive stage of coffee and, in low‑yield seasons, they
affect more the vegetative stage of the crop.
Index terms: Coffea arabica, agrometeorology, climate, forecasting, model, water balance.
Previsão de produtividade anual de café arábica
por meio do deficit
hídrico
Resumo – O objetivo deste trabalho foi desenvolver modelos agrometeorológicos para a previsão da produtividade anual de café arábica (Coffea arabica), por meio dos deficits hídricos (DEFs) durante o ciclo
do café, em importantes locais do Estado de Minas Gerais, Brasil. Para a construção dos modelos, foram
utilizados um conjunto de dados meteorológicos com abrangência de 18 anos e regressões lineares múltiplas. Os modelos foram calibrados em anos de alta e baixa produtividade, em razão de a bienalidade da cultura ser elevada no Brasil. Todos os modelos calibrados para anos de alta e baixa produtividade foram acurados e
significativos a 5% de probabilidade, com média de erros percentuais absolutos ≤2,9%. O período mínimo de previsão da produtividade é de seis meses para o Sul de Minas Gerais e para o Cerrado Mineiro. Em anos de alta produtividade, os deficits hídricos afetam mais o estádio reprodutivo do café, enquanto, em anos de baixa
produtividade, afetam mais os estádios vegetativos da cultura.
Termos de indexação: Coffea arabica, agrometeorologia, clima, previsão, modelo, balanço hídrico.
Introduction
Brazil is the world’s largest coffee producer with 45.563,2 thousand sacks per year (Amarasinghe et al., 2015; Acompanhamento…, 2017), and few studies have forecasted yields as functions of the climatic conditions (Aparecido et al., 2015). Coffee production and bean quality are highly sensitive to changes in microclimatic parameters (Craparo et al., 2015), mainly those related to water availability.
Water deficits [DEFs, the lack of evapotranspiration
in relation to a maximum (potential) theoretical value] reduce crop yields (Khamssi et al., 2011) by affecting the plant vegetative growth (DaMatta, 2004).
DEFs affect the amount of moisture extracted by
roots, the spatial distribution of the root system, canopy
size, and fruit growth of coffee plants (Amarasinghe et al., 2015). Reductions of coffee yields are mostly due to
DEFs because the water stress after fertilisation affect
fruit growth (Camargo, 2010). The effects of climate on crop yields can be evaluated with crop models (Shao et al., 2015). These models can help farmers to make decisions on achieving a sustainable agriculture (Syvertsen & Garcia-Sanchez, 2014).
Models collect information from agrometeorology, remote sensing, plant physiology, plant science, soil science, and economics, in an interdisciplinary way to predict yields (Gouranga & Ashwani, 2014). The models can also assist on strategies of production by simulating the dynamics of crop growth (Wang et al., 2015).
mathematical model to estimate yield losses of arabica coffee in the state of São Paulo. Carvalho et al. (2004) developed a model for estimating coffee yield in Minas Gerais, but the model was inconsistent, with highly discrepant estimate errors, highlighting the complexity of coffee modelling.
Studies of forecasting, however, are rare. Some studies have a probabilistic basis in the statistical models. Keong & Keng (2012) forecasted the yield of palm oil in Malaysia, nine months before the harvest, using multiple linear regression models and stepwise variable selection. Gouranga & Ashwani (2014) forecasted rice yields in India 30 days before
the harvest. Finally, Moreto & Rolim (2015) forecasted
the yield and quality of 'Valência' oranges six months before harvesting. No model, however, has yet been developed to forecast the yield of arabica coffee, in
order to understand the influence of climate on the
“bienniality” of coffee.
Various authors have sought to understand the bienniality of coffee. The bienniality is the exhibition of coffee high and low yields in alternate years, which is commonly attributed to the restriction of photoassimilates produced by the plants. The photoassimilates in one year are allocated to the growth of branches, with little generation of productive germplasm. The photoassimilates of the next year are allocated to the germplasm, with little growth of the branches, generating a higher yield (Silva et al., 2008; Rodrigues et al., 2013).
The physiological cause of bienniality of coffee
is complex (Valadares et al., 2013; Melke & Fetene,
2014). When coffee develops plagiotropic branches, photoassimilates are allocated to this growth,
promoting a large vegetative flux in the plant. This
growth simultaneously promotes the multiplication of the number of buds that would mature for production only in the following year (Pereira et al., 2011). In
the first year, coffee will thus show a high‑vegetative
growth and a low yield. In the following year, the crop will produce a high yield due to the high-bud formation in the previous year, but with low-vegetative
growth (Melke & Fetene, 2014). Photoassimilates in years with high yields are allocated to bean filling, so
vegetative growth is reduced, providing a lower yield again in the following year (Rodrigues et al., 2013). The maturity of plagiotropic branches is reached in three or four years in these regions.
Estimation in science is the use of actual data to
simulate an actual process, and forecasting is the use
of actual data to simulate a future process or event. The
forecast is the vanguard in the modelling of crops. Few
papers have forecast coffee production to understand
the influence of water deficit on the biennial coffee.
The objective of this work was to develop agrometeorological models for the forecasting of the annual yields of Arabic coffee (Coffea arabica), using
monthly water deficits (DEFs) during the coffee cycle, in
important locations in the state of Minas Gerais, Brazil.
Materials and Methods
We used a historical series of climatic and phytotechnical data for coffee crops in the state of Minas Gerais, Brazil. The representative locations of coffee production used for modelling were Guaxupé (GXP), Monte Santo de Minas (MSM), and São Sebastião do Paraíso (SSP) – in the southern region of the state (SOMG) –, and Coromandel (CRD), Serra do Salitre (SDS), and Tiros (TRS), in the Cerrado
Mineiro region (CEMG) (Table 1 and Figure 1). These data are statistics of all analysed municipalities, and were provided by the Cooxupé (Cooperativa Regional de Cafeicultores em Guaxupé). The crops were not irrigated and were of adult age.
Daily climatic data for these locations were obtained for 1997–2014 by Campbell CR21X automatic weather
stations (Campbell Scientific Inc., Logan, Utah, USA), containing sensors for rainfall (TE525WS‑L) and
air temperature (HMP50-L). Daily rainfall data and minimum, average, and maximum temperatures were arranged on a monthly basis to calculate the potential
evapotranspiration (PET), using the model proposed
by Camargo (1971). This model is similar to that of Thornthwaite (1948) for tropical regions (Camargo & Sentelhas, 1997): PET=0 01. ×
(
Qo 2 45.)
× ×T ND, in which: Qo is the daily solar atmospheric irradiance (MJ m-2 day-1); T is the mean air temperature (°C); and ND is the number of days.The actual evapotranspiration (AET), which is
estimated as a function of soil available water, was calculated following the model of Thornthwaite & Mather (1955) at a monthly scale, with a soil available water capacity of 100 mm, as follows:
ALT STO STO , and
AET ALT if ALT
PET if ALT ,
i = I−
= + <
Figure 1. Main regions for coffee production in the state of Minas Gerais, Brazil. Municipalities in southern Minas Gerais state: GXP, Guaxupé; MSM, Monte Santo de Minas; and SSP, São Sebastião do Paraíso. Municipalities in the Cerrado Mineiro region: CRD, Coromandel; SDS Serra do Salitre; and TRS, Tiros.
Table 1. Geographic and climatic description of the regions.
Municipalities C/T(1) Latitude Longitude Altitude (m) Climate(2) South of Minas Gerais
Guaxupé (GXP) C 21º18'13"S 46º42'31"W 824 B2rB’4a’ Monte Santo de Minas (MSM) C 21º11'44"S 46º57'46"W 892 B3rB’3a’ São Sebastião do Paraiso (SSP) C/T 20º54'36"S 47º06'34"W 973 B4rB’2a’
Cerrado Mineiro
in which: STO is the soil-water storage; R is the
rainfall (mm); PET is measured in millimeters; AET
is measured in millimeters; I represents the data from the current period; and, I-1 represents the data from the previous period.
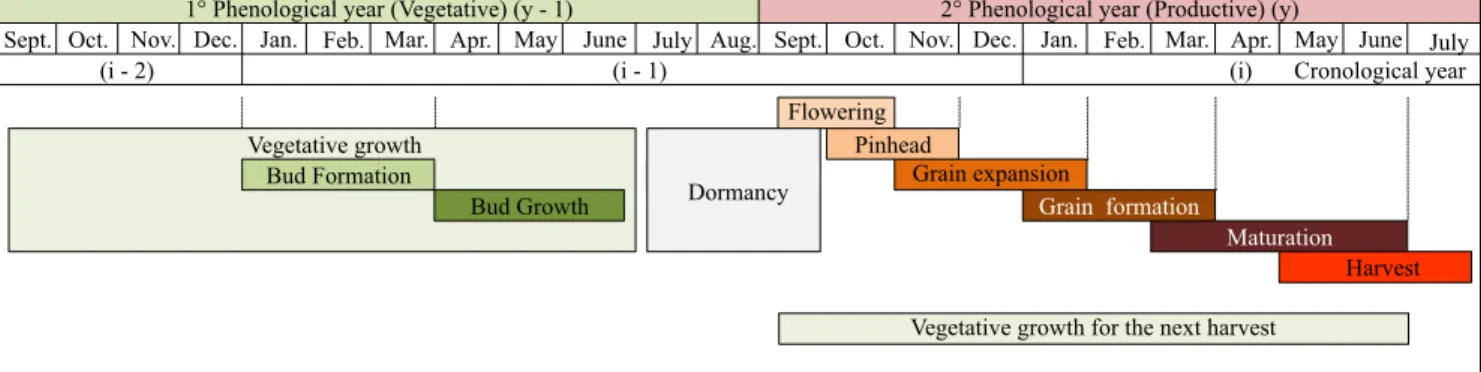
The coffee cycle begins with the development of the root system induced by dormancy of the aerial part of the plant. The development of the root system is intense
during this period (Figure 2). Roots grow throughout the plant cycle, but the growth is intensified when water is abundant (Larcher, 2004). Water deficits in
tropical climates usually occur in the winter seasons. The phenological cycle of Coffee arabica requires
two years to be completed (Figure 2). The growing season occurs in the first year, and the reproduction
occurs in the second year. Coffee phenological cycle starts with the development of root system. The root
system grows during periods of DEF that typically
occur between June and September, coinciding with
the dormancy period (Maestri & Barros, 1975). DEF was defined by Thornthwaite & Mather (1955) as the
lack of evapotranspiration relatively to a maximum (potential) theoretical value, and it is determined as
DEF = PET - AET
In the year of vegetative development (y-1), the formation and growth of vegetative branches, and the number of axillary buds at the nodes occur, stimulated by long photoperiods (Camargo & Camargo, 2001). Then, the axillary vegetative buds develop into reproductive buds under shorter photoperiods. The
productive year (y) begins with the flowering, after which the fertilized flowers lose their petals forming
small round structures called “pinheads” that begin to expand into beans from November until March,
and the fruit then mature and are harvested until July
(Figure 2).
A schematic synthesising of the available information for the bienniality of coffee cultivation
is presented in Figure 3. In addition to the strong
physiological component, the weather directly
influences the viability and quantity of the vegetative
growth and the germplasm that will become the beans (Craparo et al., 2015).
We used multiple linear regressions to model coffee
yield for forecasting. Monthly DEF data for the two years
of the coffee phenological cycle were the independent meteorological variables, used in the construction of the models as Y = a × X + b × X + c × X + L + CL1 2 3 , in which: Y is the yield (sacks ha-1); a, b, c, ..., are adjusted
coefficients (weight); X1, X2, X3, ..., are selected monthly
DEFsfrom the two phenological years of the coffee
crop; and CL is the linear coefficient. A Brazilian sack
of coffee traditionally weighs 60 kg.
The models were calibrated and tested for the locations SSP and TRS because we had 18 years of climatological data available for these places. We used 1997-2007 data for calibration, and 2008-2014 data for testing. The models for the locations CRD, MSM, GXP,
and SDS were only calibrated due to an insufficient
amount of data (12 years). The average annual yields of coffee were provided by cooperatives and producers of the regions. The biennial development of coffee is due to the physiology of the plants, so the models were calibrated separately for years of high and low yield to improve the accuracy. The calibrated models are
specific to each location.
Various methods are available for selecting the independent variables for multiple linear and
Figure 2. Phenology of Coffea arabica (modified from Camargo & Camargo, 2001). Indexes: y‑1, first phenological year, y,
nonlinear models, such as forward selection, backward elimination, stepwise, leap and bound regressions, orthogonal descriptors, genetic algorithms, genetic
populations, choosing operators, and fitness of
evaluation. These methods seek to minimize the errors associated with the insertion, or removal, of variables in the models (Xu & Zhang, 2001). These authors also stated that all possible combinations of the independent variables, in the various equations for selecting the best model, are possible when the number of independent variables is small.
Our study contained a large number of independent variables, but we tested all possible combinations (APC) of up to four independent variables in the models, to avoid stability problems in local errors and consistency of the analyses. The independent variables
were the monthly DEFs during the phenological
cycle of the crop, which produced an average of 16, 800 tested equations for each location. This total number of possible equations results from the sum of all the possible equations combining 1-4 independent variables. The total of possible combinations can be easily calculated using Newton’s binomial equation (Mansour & Schork, 2011).
We removed models with multicollinearity between
the independent variables (monthly DEFs), as it is a problem in models analyzing angular coefficients (weights) because it causes a bias in the coefficients (Gujarati & Porter, 2011). An analysis of the coefficients
thus allowed us to infer which meteorological elements
and at what time (month) influenced the crop yield.
An average reduction of coffee yield was observed
as a function of the annual DEF at the locations, by analyzing the elasticity of the coefficients, as described by Gujarati & Porter (2011). The influence of monthly DEF on yield during the coffee phenological cycle was
observed for the top 20 selected models by an analysis of the correlations and the frequency of appearance of the variables.
The significance of the coefficients (t<0.05) and the regression (F<0.05), a low‑mean absolute percentage error (MAPE, %), and a high‑adjusted coefficient
of determination (R2adj) were used for selecting the variables. The models were selected by an evaluation
of the accuracy indicated by the MAPE, and of the
precision indicated by the R2adj (Cornell & Berger, 1987), as follows:
MAPE =
Yest - Yobs Yobs ×100
n ;
i i
i i =1
n
∑
R adj = 1- 1- R × n -1 n - k - a ,
2
2
(
)
(
)
in which: Yesti is the estimated variable; Yobsi is the observed variable; n is the number of datapoints (years); and k is the number of independent variables in the regression. R2 (unadjusted) was calculated by R =2
(
SQR+SQE SQR)
,in which SQR is the regression sum of squares(
∑
(
Yest - Yobs)
2)
; andSQE is the sum of squared errors
(
∑
(
Yobs - Yest)
2)
.Results and Discussion
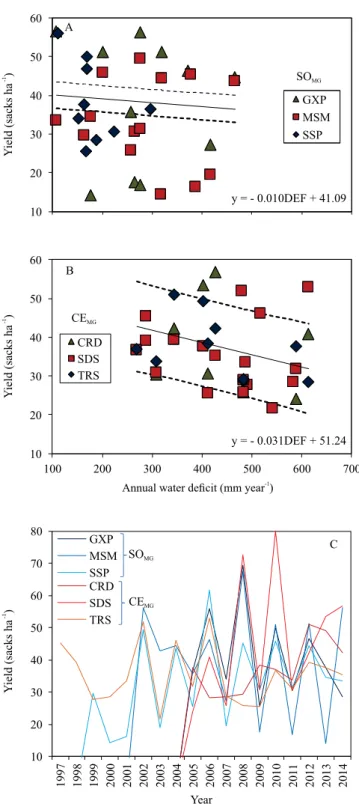
The DEFs were more intense in CEMG, ranging from
269 to 613 mm per cycle. The cycle DEFs in SOMG varied from 108 to 466 mm per cycle. The yields were more
sensitive to DEF in CEMG than in SOMG. The average
sensitivities as functions of DEF, in SOMG and CEMG, were -0.010 and - 0.031 sacks ha-1 mm-1 of DEF per
cycle, respectively (Figures 4 A and B). A sensitivity
of -0.031 sacks ha-1 mm-1 of DEF per cycle of coffee, with an average yield of 45.00 sacks ha-1, represents a reduction of 3.10 sacks ha-1 for every 100 mm of cycle
DEF. Assuming a DEF of zero during the cycle, an average yield in CEMG would be 51.24 sacks ha-1,which
is 20% higher than in SOMG (Figure 4 C). These values
are similar to those reported by Fernandes et al. (2012),
who found that the yield of coffee was usually higher
in CEMG than in SOMG.
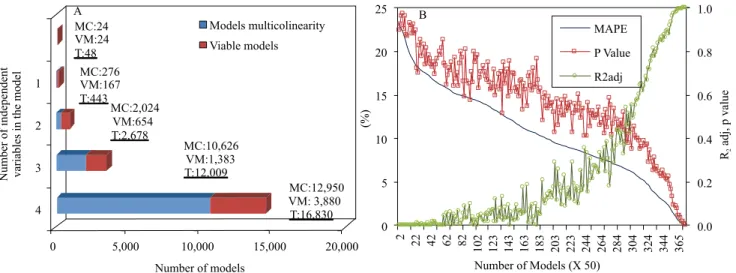
Efforts were made to remove the equations with
collinear variables, during the variable selection in the models, in order to forecast coffee yield by applying the APC method. We tested 16, 830 equations for each location, and removed an average of 12, 950 equations with collinear variables, leaving only 3,880 viable
equations (Figure 5 A). These viable equations were assessed for a low MAPE, a high R2adj, and p < 0.05
(Figure 5 B).
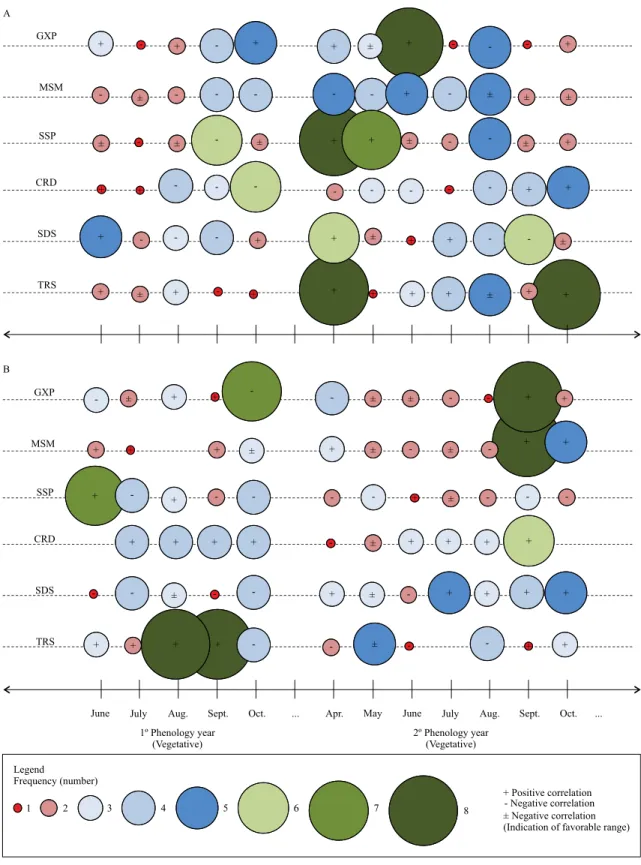
To synthesize the information of the effect of DEFs on coffee yield, we identified the monthly DEFs of
higher frequency in the yield forecasts of the 20
top designs for each location (Figure 6 A and B). A monthly DEF can be positively or negatively correlated
Figure 4. Relation between water deficit and coffee yield, in southern Minas Gerais (A), and in Cerrado Mineiro region (B), Minas Gerais state, Brazil; and coffee yields of these regions (C). Municipalities in southern Minas Gerais state (SOMG): GXP, Guaxupé; MSM, Monte Santo de Minas; SSP,
São Sebastião do Paraíso. Municipalities in the Cerrado
Mineiro region (CEMG): CRD, Coromandel; SDS, Serra
with yield, depending on the coffee phenological stage (Syvertsen & Garcia-Sanchez, 2014).
DEFs in years of high yield (Figure 6 A) had more influence on flowering, bean formation, and yield during the phenological year (y). The monthly DEF mostly influenced the phases of vegetative development and final maturation in years of low yield (Figure 6 B);
this result is in accordance with that by Pereira et al. (2011), who asserted that the growth of reproductive branches was the priority of development of coffee in years with low yield.
DEFs in years of high yield had more influence
during the production year (y), with higher frequencies
in the models from April to July. The DEF in April of the second chronological year (DEFapr(i-1)), in high-yield
season, was the most influential DEF (Figure 6 A). DEFjul(i-1) occurred at the end of the growing period,
and had a smaller influence on coffee yield.
DEFsep(i-1) and DEFoct(i-1) showed great influence
both in high‑ and low‑yield seasons. DEFsep(i-1) was
very influential in the cultivation, negatively affecting coffee high yield (Figure 6 A). This stage is at the end
of the dormancy – when water restriction is desirable (Amarasinghe et al., 2015) – together with strong and
uniform flowering (Ronchi et al., 2015). DEFoct(i-1),
month of flowering, was negatively correlated with
yield in the municipalities GXP, SSP, SDS, and TRS
(Figure 6), evidencing that DEF in the coffee flowering
period is not desirable.
The agrometeorological models were developed
by associating coffee yield with monthly DEFs. The
models were calibrated and tested for years with
high‑ (Figure 7) and low‑yield seasons (Figure 8), to
understand the limiting factors and to incorporate the bienniality of coffee production. The adjusted
angular coefficients indicated the sensitivity of yield in relation to the monthly DEF, during the two years of
the phenological cycle, for each location.
The models developed for the years with high yields
were accurate, with a minimum MAPE of 0.39%
(calibration), and an average forecasting period of
up to nine months. For instance, the model for the
forecasting of crop yield in MSM had a forecasting period of six months, and the calibration was highly
accurate, with a MAPE of 1.59% and an R2adj of 0.95.
The MAPE of 1.59% in this model was considered low
because the average yield of 53.31 sacks ha-1 varied by ±0.847 sacks ha-1. October of the second phenological year (i-1) was the last month used in the model, and the forecasting period for yield was six months, with harvesting beginning in May(i) (Figure 2), as follows:
MSM = 4.55× DEF + 0.779× DEF
= 1.479× DEF
High May June
July
i-1 i-1
i
( ) ( )
--1 - 0.585× DEFOct.i-1 + 59.14,
( ) ( )
in which: i-1 is the second chronological year; and i is the third chronological year.
Figure 5. Total number of generated models (A): models with multicollinearity and viable models for one region; and model
classification (B), according to criteria of accuracy (lowest MAPE), precision (greater R² adj), and reliability (p‑value). VM,
Figure 7. Agrometeorological models using monthly water deficiency to forecast high‑yield seasons of arabica coffee. Municipalities in southern Minas Gerais state (SOMG), Brazil: GXP, Guaxupé; MSM, Monte Santo de Minas; and SSP, São Sebastião do Paraíso. Municipalities in the Cerrado Mineiro (CEMG) region, MG, Brazil: CRD, Coromandel; SDS, Serra do
Salitre; and TRS, Tiros. BF, bud formation; BG, bud growth; FL, flowering; PH, pinhead; GE, grain expansion; GF, grain
Figure 8. Agrometeorological models using monthly water deficiency to forecast low‑yield seasons of arabica coffee. Municipalities in southern Minas Gerais (SOMG) state, Brazil: GXP, Guaxupé; MSM, Monte Santo de Minas; and SSP, São Sebastião do Paraíso. Municipalities in the Cerrado Mineiro (CEMG) region, MG, Brazil: CRD, Coromandel; SDS, Serra do
Salitre; and TRS, Tiros. BF, bud formation; BG, bud growth; FL, flowering; PH, pinhead; GE, grain expansion; GF, grain
An analysis of the angular coefficients in this model identified DEFmay(i-1) as the most important month,
and DEFoct(i-1) as the least important one. DeFjul(i-1)
and DeFoct(i-1)were negatively correlated with yield,
probably because they were at the end of bud growth
and flowering, respectively, when water restriction is usually not desirable. DEF during the vegetative period
(bud growth) of a high-yield season. in SOMG, was
positively correlated with coffee yield. DEFjulin SDS,
in CEMG, during coffee vegetative and reproductive
periods, caused a reduction of the final yield (Figure
7).
The agrometeorological models developed for the years of low yield were accurate, with a minimum
MAPE of 0.14%, and an average forecasting period of up to seven months. For instance, the model for
predicting the yield in GXP, for a low-yield season,
used DEFoct(i-1) as the last month, and the forecasting
period for yield forecasting was six months. The
calibration was highly accurate, with a MAPE of 0.17%, and an R2adj of 0.99. The MAPE of 0.17% in this model was considered low because the average yield of 32.11 sacks ha-1 varied by ±0.05 sacks ha-1, as follows:
GXP = -0.503× DEF - 0.384× DEF
+0.106× DEF
LOW Oct. Apr.
Sep
i-2 i-1
( ) ( )
tt.( )i-1 + 0.014× DEFOct.( )i-1 + 34.5.
DeFapr(i-1), which occurs during bud growth,
generally had a large influence on coffee yield in low‑ yield seasons. DEFsep(i-1), at the end of dormancy, was
positively correlated with coffee yield in GXP and MSM, in SOMG. DEF in June of the first chronological
year [DEFjun(i-2)] had a positive influence on yield in
SSP. Coffee plants prepare to begin vegetative growth during this period, and roots grow intensively, which
is favoured by DEF (Larcher, 2004).
DEFoct(i-2) caused a reduction in the final yield in
CRD and SDS, in CEMG. DEFapr(i-1) had a negative
influence on coffee yield in CRD and TRS because
the buds normally grow in this month, a time when the coffee crop needs evapotranspiration to form the
reproductive buds. DEFs during dormancy(i-1) had a
positive influence on yield in SDS (Figure 8). Ronchi et al. (2015) suggested that DEFs were desirable in
August(i-1), which favours uniformity and yield of the coffee crop.
Conclusions
1. The agrometeorological models developed as
functions of water deficits are accurate for all regions,
and the minimum forecasting period for yield is six months for southern Minas Gerais state and Cerrado Mineiro.
2. Coffee yield in years of high yield was more
influenced by water deficit in the reproductive phase,
corresponding to the second phenological year.
3. Water deficits in years with low yield have a larger influence in the vegetative phase of the crop, corresponding to the first phenological year.
Acknowledgments
To Fundação de Apoio à Pesquisa do Estado de São Paulo (Fapesp), for support (grant # 2014/05025‑4).
References
ACOMPANHAMENTO DA SAFRA BRASILEIRA [DE] CAFÉ: safra 2017: segundo levantamento, v.4, n.2, maio 2017. 8p. Available at: <http://www.conab.gov.br/OlalaCMS/uploads/
arquivos/17_05_18_15_37_37_boletim_cafe_-_maio_2017.pdf>. Accessed on: Jan. 15, 2018.
AMARASINGHE, U.A.; HOANH, C.T.; D’HAEZE, D.; HUNG,
T.Q. Toward sustainable coffee production in Vietnam: more coffee with less water. Agricultural Systems, v.136, p.96-105, 2015. DOI: 10.1016/j.agsy.2015.02.008.
APARECIDO, L.E. de O.; ROLIM, G. de S.; SOUZA, P.S.
de. Sensitivity of newly transplanted coffee plants to climatic conditions at altitudes of Minas Gerais, Brazil. Australian Journal of Crop Science, v.9, p.160-167, 2015.
CAMARGO, A.P. de. Balanço hídrico no Estado de São Paulo. 3.ed. São Paulo: Instituto Agronômico, 1971. 24p. (IA Boletim,116).
CAMARGO, Â.P. de; CAMARGO, M.B.P. Definição e esquematização das fases fenológicas do cafeeiro arábica nas condições tropicais do Brasil. Bragantia, v.60, p.65-68, 2001. DOI: 10.1590/S0006-87052001000100008.
CAMARGO, Â.P. de; SENTELHAS, P.C. Avaliação
do desempenho de diferentes métodos de estimativa da
evapotranspiração potencial no estado de São Paulo, Brasil.
Revista Brasileira de Agrometeorologia, v.5, p.89-97, 1997. CAMARGO, M.B.P. The impact of climatic variability and climate change on arabic coffee crop in Brazil. Bragantia, v.69, p.239-247, 2010. (i.e. arabica coffee). DOI: 10.1590/S0006-87052010000100030.
CARVALHO, L.G. de; SEDIYAMA, G.C.; CECON, P.R.; ALVES,
H.M.R. Modelo de regressão para a previsão de produdividade
Engenharia Agrícola e Ambiental, v.8, p.204-211, 2004. DOI: 10.1590/S1415-43662004000200007.
CORNELL, J.A.; BERGER, R.D. Factors that influence the coefficient of determination in single linear and nonlinear models.
Phytopathology, v.77, p.63-70, 1987. DOI: 10.1094/Phyto-77-63.
CRAPARO, A.C.W.; VAN ASTEN, P.J.A.; LÄDERACH, P.; JASSOGNE, L.T.P.; GRABA S.W. Coffea arabica yields decline in Tanzania due to climate change: global implications. Agricultural and Forest Meteorology, v.207, p.1-10, 2015. DOI: 10.1016/j.agrformet.2015.03.005.
DAMATTA, F.M. Ecophysiological constraints on the production
of shaded and unshaded coffee: a review. Field Crops Research, v.86, p.99-114, 2004. DOI: 10.1016/j.fcr.2003.09.001.
FERNANDES, A.L.T.; PARTELLI, F.L.; BONOMO, R.;
GOLYNSKI, A. A moderna cafeicultura dos cerrados brasileiros. Pesquisa Agropecuária Tropical, v.42, p.231-240, 2012. DOI: 10.1590/S1983-40632012000200015.
GOURANGA, K.; ASHWANI, K. Forecasting rainfed rice yield
with biomass of early phenophases, peak intercepted PAR and ground based remotely sensed vegetation indices. Journal of Agrometeorology, v.16, p.94-103, 2014.
GUJARATI, D.N.; PORTER, D.C. Econometria básica. 5.ed. Porto Alegre: AMGH, 2011. 924p.
KEONG, Y.K.; KENG, W.M. Statistical modeling of weather‑
based yield forecasting for young mature oil palm. APCBEE Procedia, v.4, p.58-66, 2012. DOI: 10.1016/j.apcbee.2012.11.011.
KHAMSSI, N.N.; GOLEZANI, K.G.; NAJAPHY, A.; ZEHTAB, S. Evaluation of grain filling rate, effective grain filling period and resistance indices under acclimation to gradual water deficit
stress in chickpea cultivars. Australian Journal of Crop Science, v.5, p.1044-1049, 2011.
LARCHER, W. Ecofisiologia vegetal. São Carlos: Rima Artes e Textos, 2004. 531p.
MAESTRI, M.; BARROS, R.S. Ecophysiology of arabica coffee.
In: ALVIM, P. de T. Ecophysiology of tropical crops. Manaus:
CEPLAC, 1975. v.2, p.1‑36.
MANSOUR, T.; SCHORK, M. The commutation relation xy=
qyx+ hf (y) and Newton’s binomial formula. The Ramanujan Journal, v.25, p.405-445, 2011. DOI: 10.1007/s11139-011-9295-0.
MELKE, A.; FETENE, M. Eco‑physiological basis of drought
stress in coffee (Coffea arabica L.) in Ethiopia. Theoretical and Experimental Plant Physiology, v.26, p.225-239, 2014. DOI: 10.1007/s40626-014-0022-2.
MORETO, V.B.; ROLIM, G. de S. Estimation of annual yield and quality of ‘Valência’ orange related to monthly water deficiencies.
African Journal of Agricultural Research, v.10, p.543-553, 2015. DOI: 10.5897/AJAR2014.9090.
PEREIRA, S.P.; BARTHOLO, G.F.; BALIZA, D.P.; SOBREIRA, F.M.; GUIMARÃES, R.J. Crescimento, produtividade e
bienalidade do cafeeiro em função do espaçamento de cultivo.
Pesquisa Agropecuária Brasileira, v.46, p.152-160, 2011. DOI: 10.1590/S0100-204X2011000200006.
RODRIGUES, W.N.; TOMAZ, M.A.; FERRÃO, R.G.; FERRÃO, M.A.G.; FONSECA, A.F.A. Crop yield bienniality in groups of
genotypes of conilon coffee. African Journal of Agricultural Research, v.8, p.4422-4426, 2013. DOI: 10.5897/AJAR12.1999.
RONCHI, C.P.; ARAÚJO, F.C. de; ALMEIDA, W.L. de; SILVA, M.A.A. da; MAGALHÃES, C.E. de O.; OLIVEIRA, L.B. de; DRUMOND, L.C.D. Respostas ecofisiológicas de cafeeiros submetidos ao deficit hídrico para concentração da florada no
Cerrado de Minas Gerais. Pesquisa Agropecuária Brasileira, v.50, p.24-32, 2015. DOI: 10.1590/S0100-204X2015000100003.
SANTOS, M.A. dos; CAMARGO, M.B.P. de. Parametrização
de modelo agrometeorológico de estimativa de produtividade do
cafeeiro nas condições do Estado de São Paulo. Bragantia, v.65, p.173-183, 2006. DOI: 10.1590/S0006-87052006000100022.
SHAO, Y.; CAMPBELL, J.B.; TAFF, G.N.; ZHENG, B. An
analysis of cropland mask choice and ancillary data for annual corn yield forecasting using MODIS data. International Journal of Applied Earth Observation and Geoinformation, v.38, p.78-87, 2015. DOI: 10.1016/j.jag.2014.12.017.
SILVA, C.A. da; TEODORO, R.E.F.; MELO, B. de. Produtividade e rendimento do cafeeiro submetido a lâminas de irrigação.
Pesquisa Agropecuária Brasileira, v.43, p.387-394, 2008. DOI: 10.1590/S0100-204X2008000300014.
SYVERTSEN, J.P.; GARCIA‑SANCHEZ, F. Multiple abiotic
stresses occurring with salinity stress in citrus. Environmental and Experimental Botany, v.103, p.128-137, 2014. DOI: 10.1016/j. envexpbot.2013.09.015.
THORNTHWAITE, C.W. An approach toward a rational classification of climate. Geographical Review, v.38, p.55-94, 1948. DOI: 10.2307/210739.
THORNTHWAITE, C.W.; MATHER, J.R. The water balance.
Centerton: Drexel Institute of Technology, Laboratory of Climatology, 1955. 104p. (Publications in climatology, v.8, n.1).
VALADARES, S.V.; NEVES, J.C.L.; ROSA, G.N.G.P.; PRIETO MARTINEZ, H.E.; ALVAREZ VENEGAS, V.H.; LIMA, P.C. de.
Yield and production bienniality of dense coffee plantations under different levels of N and K. Pesquisa Agropecuária Brasileira, v.48, p.296-303, 2013. DOI: 10.1590/S0100-204X2013000300008.
WANG, N.; JASSOGNE, L.; ASTEN, P.J.A. van; MUKASA, D.; WANYAMA, I.; KAGEZI, G.; GILLER, K.E. Evaluating coffee
yield gaps and important biotic, abiotic, and management factors
limiting coffee production in Uganda. European Journal of Agronomy, v.63, p.1-11, 2015. DOI: 10.1016/j.eja.2014.11.003.
XU, L.; ZHANG, W.‑J. Comparison of different methods for
variable selection. Analytica Chimica Acta, v.446, p.477-481, 2001. DOI: 10.1016/S0003-2670(01)01271-5.