UNIVERSIDADE DA BEIRA INTERIOR
Ciências
Understanding ion exchange chromatography
adsorption mechanisms under different
conditions
João Carlos Simões Cardoso
Dissertação para obtenção do Grau de Mestre em
Biotecnologia
(2º ciclo de estudos)
Orientador: Prof. Doutor Ana Cristina Mendes Dias-Cabral
Co-orientador: Mestre Gonçalo Fradique Lopes da Silva
Acknowledgments
Firstly, I would like to thank my supervisor Professor Cristina Dias-Cabral to be responsible for encouraging me and initiate me to the research world years ago. Her guidance, support and enthusiastic encouragement led me to follow my dreams with more passion and even made possible for me to, literally, adventure in the other side of the globe. A special thanks for her availability and concern.
I am particularly grateful for the assistance given by my co-supervisor Gonçalo Silva whom help and support were tirelessly. I really hope the opportunity to work with him in the future will rise.
I would also like to acknowledge my university UBI, research center CICS-UBI and colleagues, especially from my work group that are now close friends. Patrícia Aguilar, Filipa Pires, Gregory Dutra and Cláudia Peralta, I thank all the support, lunches, and the best un-related conversations.
A special thanks for my dear far away friends that help me unconditionally, Catarina Lima, Renato Guimarães, Lúcia Queiros, Carolina Batista, Cátia Costa and António Madeiras. Thank you for being part of my life.
Resumo
Atualmente, a purificação de proteínas é tipicamente o aspeto mais dispendioso de um processo bio farmacêutico. A cromatografia de troca iónica (IEC), que se baseia na adsorção de proteínas numa resina ou suporte cromatográfico, é provavelmente o método mais utilizado na purificação destas proteínas devido a exibir uma grande capacidade de ligação para estas biomoléculas.
Ao investigar os diferentes eventos envolvidos na adsorção de proteínas desenvolve-se o conhecimento sobre o comportamento de proteínas em superfícies, o qual pode ser aplicado na purificação destas moléculas, bem como para uso em estudos biofísicos com base em fenómenos de reconhecimento molecular.
A microcalorimetria de fluxo (FMC) tem provado ser uma abordagem eficaz para medições de sinais de calor em tempo real, inerentes ao processo de adsorção que ocorre dentro de um sistema de cromatografia. Por conseguinte, permite uma melhor compreensão das forças que impulsionam o processo de adsorção.
O presente estudo tenta elucidar e comparar o mecanismo de adsorção de uma proteína modelo de alto peso molecular, seroalbumina bovina (BSA), em vários suportes cromatográficos de troca iónica disponíveis comercialmente, usando a técnica de FMC. Os suportes cromatográficos estudados carregados positivamente foram Toyopearl DEAE 650M, Toyopearl GigaCap Q-650M e TSKgel SuperQ 5PW. Sendo que a tecnologia de fixação de ligandos usada no seu fabrico difere. Além disso, por ser um suporte cromatográfico carregado negativamente e ter a mesma carga que a BSA nas condições em estudo, o TSKgel SP 5PW foi utilizado esperando uma interação primária mais fraca entre o suporte e a BSA. O estudo teve o objetivo de avaliar as diferenças termodinâmicas e foi uma tentativa para compreender forças mais fracas presentes no mecanismo de interação.
Os dados obtidos com uso de microcalorimetria de fluxo juntamente com as isotérmicas de adsorção ilustraram uma série de eventos cronológicos que ocorreram durante a adsorção da BSA nos suportes cromatográficos usados. Estes eventos incluíram: a libertação de moléculas de água e iões da superfície do suporte e da proteína; alterações conformacionais da proteína; “activated jump”; “chain delivery”; e desorção. Foi observado que estes eventos
completamente. No entanto, na presença de 50 mM de cloreto de sódio, o comportamento dos perfis observados foi semelhante aos obtidos com os suportes cromatográficos de carga positiva.
Os estudos efetuados usando suportes cromatográficos carregados positivamente e TSKgel SP com a presença de 50 mM de cloreto de sódio mostraram entalpias de calor positivas aquando do contacto da proteína com o suporte. Assim, nestes casos, o mecanismo de adsorção foi considerado ser conduzido entropicamente, o que dá muito mais importância à troca de moléculas de água e iões neste complexo processo. Por outro lado, em ensaios onde o suporte TSKgel SP é usado na ausência de sal, o calor de adsorção total é negativo, o que significa que neste caso a adsorção é conduzida entalpicamente.
Palavras-chave
Resumo alargado
Atualmente, a purificação de proteínas é tipicamente o aspeto mais dispendioso de um processo bio farmacêutico.
Cromatografia de troca iónica (IEC), que se baseia na adsorção de proteínas numa resina ou suporte cromatográfico, é provavelmente o método mais utilizado na purificação destas proteínas devido a exibir uma grande capacidade de ligação para estas biomoléculas. A purificação de proteínas é altamente importante para o seu posterior uso terapêutico, e também como para estudos das suas funções e estrutura.
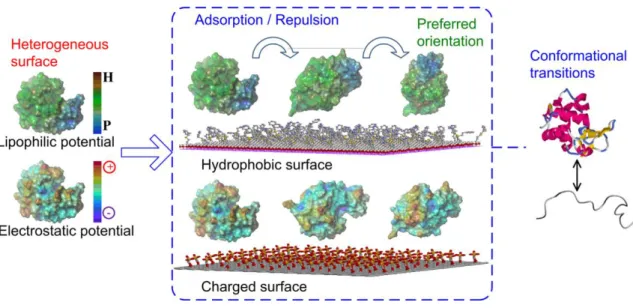
A adsorção de proteínas em qualquer superfície é um processo altamente complexo, e é controlado por vários subprocessos com efeitos sinérgicos e antagónicos provenientes de diferentes tipos de forças (Figure 1).
Figure 1 – Esquema simplificado das interações possivelmente envolvidas num mecanismo de adsorção de proteínas em suportes cromatográficos. Adaptado de 1
Ao investigar os diferentes eventos envolvidos na adsorção de proteínas desenvolve-se o conhecimento sobre o comportamento de proteínas em superfícies que pode ser aplicado tanto na purificação destas moléculas, como também no desenvolvimento de estudos
dentro de um sistema cromatográfico. Por conseguinte, permite uma melhor compreensão das forças que impulsionam o processo de adsorção, sem interferir com as próprias moléculas e com o processo de adsorção.
O presente estudo tenta elucidar e comparar o mecanismo de adsorção de uma proteína modelo de alto peso molecular, seroalbumina bovina (BSA), em vários suportes cromatográficos de troca iónica disponíveis comercialmente usando a técnica de FMC. Os suportes cromatográficos estudados carregados positivamente foram Toyopearl DEAE 650M, Toyopearl GigaCap Q-650M e TSKgel SuperQ 5PW. Sendo que a tecnologia de fixação de ligandos usada no seu fabrico difere. Além disso, por ser um suporte cromatográfico carregado negativamente e ter a mesma carga que a BSA, nas condições em estudo, o TSKgel SP 5PW foi utilizado esperando uma interação primária mais fraca entre o suporte e a BSA. O estudo teve o objetivo de avaliar as diferenças termodinâmicas e foi uma tentativa para compreender forças mais fracas presentes no mecanismo de interação.
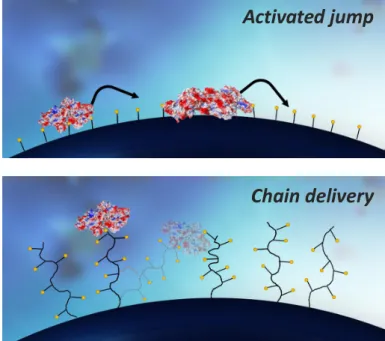
Os dados obtidos com uso de microcalorimetria de fluxo juntamente com as isotérmicas de adsorção ilustraram uma série de eventos cronológicos que ocorreram durante a adsorção da BSA nos suportes cromatográficos usados. Estes eventos incluíram: a libertação de moléculas de água e iões da superfície do suporte e da proteína; alterações conformacionais da proteína; “activated jump”; “chain delivery”; e desorção (Figure 2). Foi observado que estes eventos tiveram diferentes magnitudes quando se compararam os diferentes suportes cromatográficos de carga positiva, apesar de mostrarem o mesmo perfil de calor no termograma proveniente de ensaios de FMC.
Figure 2 – Esquema de mecanimos de transporte presents em suportes cromatográficos de troca iónica. (Cima) Mecanismo de “activated jump” presente em todos os suportes de troca iónica e (Baixo)
Activated jump
E as alterações conformacionais da proteína parecem ser maiores quando os suportes cromatográficos possuem uma disposição bidimensional dos ligandos (sem “grafting”), devido a aumentarem a sua área de contacto após um espalhamento pela superfície.
Em condições de “não-ligação”, isto é, com ligandos do TSKgel SP 5PW e com proteína ambos carregados negativamente, o perfil do termograma mudou completamente. No entanto, na presença de 50 mM de cloreto de sódio, o comportamento dos perfis observados foi semelhante aos obtidos com os suportes cromatográficos de carga positiva.
Os estudos efetuados usando suportes cromatográficos carregados positivamente e TSKgel SP com a presença de 50 mM de cloreto de sódio mostraram apresentar entalpias positivas aquando do contacto da proteína com o suporte. Assim, o mecanismo de adsorção foi considerado ser conduzido devido a fatores entrópicos, o que dá muito mais importância à troca de moléculas de água e iões neste complexo processo. Por outro lado, ensaios com o suporte TSKgel SP na ausência de sal, o calor de adsorção total observado é negativo, o que significa que neste caso a adsorção é conduzida entalpicamente.
Tendo tudo em consideração, este trabalho consiste em mais um passo para a elucidação do complexo processo que é a adsorção de proteínas. Modelos teóricos, semi-empíricos e futuras simulações computacionais relacionadas com o mecanismo de adsorção, especialmente de moléculas com alto peso molecular, devem contabilizar os efeitos acima referidos, bem como as interações primárias. A combinação destas abordagens com investigações experimentais poderá futuramente conduzir para a possibilidade do desenvolvimento de suportes cromatográficos mais rápidos, eficazes e com melhores rendimentos. Com o objetivo final de simplificar e diminuir os custos associados á produção biotecnológica de biomoléculas com interesse farmacêutico.
Abstract
Nowadays, protein purification is typically the most laborious and more expensive aspect of a biopharmaceutical process. Ion exchange chromatography is probably the most used method in protein purification due to displaying the highest binding capacities for these biomolecules. Protein adsorption onto any surface is a complex process that is controlled by a number of subprocesses with synergistic and antagonistic effects of different types of forces. Investigation of the events involved in protein adsorption promotes knowledge development on protein and surfaces behavior.
Flow microcalorimetry (FMC) has proven to be an effective approach to real-time heat signal measurements of adsorption and desorption events occurring inside a chromatographic system. Therefore, it allows a better understanding of the forces that drive the adsorption process without interfering with the system like the majority of used techniques.
The present study tries to elucidate and compare the mechanism of protein adsorption, namely bovine serum albumin, onto several commercially available charged resins using the FMC technique. The studied anion exchangers were Toyopearl DEAE 650M, Toyopearl GigaCap Q-650M, and TSKgel SuperQ 5PW. Being ligand attachment technology one of the differences between them. Also, although being a cation exchanger and having the same charge as BSA under the working conditions, TSKgel SP 5PW was used expecting a weaker primary interaction between BSA and the resin in order to evaluate the thermodynamic differences and to try to understand weaker forces of the inherited mechanism.
Flow microcalorimetry data coupled with equilibrium binding isotherms illustrated a series of chronological events that occurred during BSA adsorption onto the used resins, including resin and protein dehydration, protein conformational alterations, protein activated jump, chain delivery, and desorption. These events were found to have different magnitudes when comparing the anion exchangers in spite of showing the same heat profile.
In “non-binding conditions”, i.e., with TSKgel SP 5PW negative ligands and negative net protein charge, the thermogram profile completely changed. However, in the presence of 50 mM NaCl, the observed peak behavior was similar to those observed with anion exchangers.
SP in the absence of salt, the adsorption net heat is negative, meaning that in this case adsorption is enthalpically driven.
All things considered, this work consisted on another step for the elucidation of the complex protein adsorption process. Theoretical, empirical models and future computational simulations of adsorption equilibrium should account for these complex effects, as well as the primary interactions.
Keywords
Table of Contents
Chapter 1 – Introduction ... 1
1.1 Importance of protein purification ... 1
1.3 Protein adsorption process in liquid-solid chromatography ... 7
1.4 Interactions that contribute to protein adsorption ... 9
1.4.1 Hydrogen bond ... 9
1.4.2 Hydrophobic Interaction ... 10
1.4.3 Electrostatic Interaction ... 11
1.4.4 Van der Waals interactions ... 12
1.4.5 Coordination Bond ... 12
1.4.6 Conformational Entropy ... 12
1.5 Protein surface, orientation and conformational role in adsorption ... 13
1.6 Subprocesses of protein adsorption ... 15
1.7 Thermodynamic aspects of interaction in chromatography ... 17
1.7.1 Processes that can contribute to enthalpy and entropy change in IEC protein adsorption ... 17
1.7.2 Van’t Hoff plot analysis ... 20
1.7.3 Microcalorimetry techniques ... 20
1.7.3.1 Isothermal titration calorimetry ... 21
1.7.3.2 Flow microcalorimetry ... 21
1.8 Theoretical aspects of adsorption mechanism in preparative chromatography ... 24
1.8.1 Langmuir model ... 24
1.8.2 Steric mass action model ... 25
1.8.3 Potential barrier chromatography theory and electrical double layer ... 26
Chapter 2 – Goal of the study ... 31
4.2 Adsorption isotherms data ... 36
4.3 Microcalorimetric data ... 38
4.3.1 First endothermic peak ... 40
4.3.2 Second endothermic peak ... 42
4.3.3 Exothermic peak ... 43
4.3.4 “Non-binding” conditions data ... 46
4.4 Adsorption driving forces ... 50
Chapter 5 – Conclusions... 51
References ... 53
List of figures
Figure 1 – Esquema simplificado das interações possivelmente envolvidas num mecanismo de adsorção de proteínas em suportes cromatográficos. Adaptado de 1 ... ix
Figure 2 – Esquema de mecanimos de transporte presents em suportes cromatográficos de troca iónica. (Cima) Mecanismo de “activated jump” presente em todos os suportes de troca iónica e (Baixo) mecanismo de “chain delivery” presente em suportes em cadeias com
grafting. Adaptado de 2 ... x
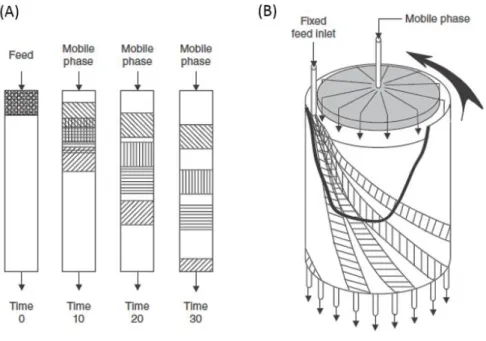
Figure 3 - Schematics of a conventional column chromatography (A) and continuous annular chromatography (B) mostly used in biotechnological industries. The process is two
dimensional in both cases. Adapted from 6. ... 2
Figure 4 - Qualitative electrostatic representation of bovine serum albumin (BSA) charged surface. The heterogeneity of charges in this asymmetrical protein is clearly shown. BSA heterogeneous surface is shown on the lower panel and colored according to the electrostatic potential calculated with PyMOL17 molecular graphics software ignoring solvent screening
effect. For electrostatic potential, red is used for negative (-) and blue for positive (+). ... 5 Figure 5 - Simplified scheme of liquid-solid equilibrium interactions in a chromatography system. Adapted from 1 ... 7
Figure 6 - Example of a hydrogen bond between water and ammonia molecules. (δ+) represents positive partial charges and (δ-) represents negative partial charges due to atom electronegativity 33. ... 9
Figure 7 - Scheme of hydrophobic interactions and reorganization of water molecules. Note that the number of ordered water molecules decrease after the interaction, which makes this process entropically favorable. ... 10 Figure 8 - Schematic representation of the oriented alignment of proteins induced by like-charged surfaces. The oriented alignment maximizes the electrostatic repulsions, leading to the inhibition of protein aggregation. Adapted from 2. ... 11
Figure 9 - Schematic diagram of chicken egg white lysozyme (CEWL) orientation at
chromatographic surfaces at pH 7. CEWL heterogeneous surface is shown on the left panel and colored according to the lipophilic potential or the electrostatic potential. For lipophilic potential, brown is used for hydrophobic (H) and blue for hydrophilic (P). For electrostatic potential, red is used for positive (+) and purple for negative (−). Adapted from 2. ... 13
Figure 10 - Examples of two van't Hoff plots for two types of reactions. This linear behavior is rarely observed when studying biomolecules. ... 20
Figure 13 - Adsorption equilibrium isotherm example. Obtained plotting surface concentration of a given molecule versus the concentration obtained after the equilibrium. ... 25 Figure 14 - Electrical double layer scheme of a positively charged molecule. Negative ions are represented in red and positive charged ions are represented as blue. ... 27 Figure 15 - Interaction Potential energy profiles relevant to potential barrier chromatography. Red line represents the total interaction potential with the location of the maximum, Ømax,
and minimum, Ømin, of the interaction potential energy profiles associated with the
adsorption energy well and the potential barrier respectively. Adapted from 18. ... 28
Figure 16 - Flow microcalorimeter used in the experiments of this work at CICS-UBI. ... 34 Figure 17 - Equilibrium binding isotherms for bovine serum albumin adsorption onto ion exchange resins at Tris-HCl pH 9 and 295 K. (●) TSKgel SuperQ 5PW, () Toyopearl DEAE 650M, () Toyopearl GigaCap Q-650M () TSKgel SP 5PW... 36 Figure 18 - FMC thermogram obtained for 230 µL injection of 50 mg.mL-1 BSA in equilibrium
buffer Tris-HCl pH 9 adsorbing onto (●) TSKgel SuperQ 5PW, () Toyopearl DEAE 650M and () Toyopearl GigaCap Q-650M. Surface concentration (and flowthrough %) are respectively, 21.5 mg.mL-1 resin (66 %), 27.66 mg.mL-1 resin (52%) and 23.28 mg.mL-1 resin (61%). Shaded
area represents the interval of time at which the protein plug contacts with the support. ... 38 Figure 19 - PEAKFIT deconvolution of thermogram for BSA adsorption onto TSKgel SuperQ 5PW with Tris-HCl pH 9 for 230 µL injection of 50 mg BSA.mL-1 resulting in surface concentration of
8.37 mg.mL-1 resin. Shaded area represents the interval of time at which protein flowed
through the cell. ... 39 Figure 20 - First endothermic peak area related with surface concentration obtained for 230 µL injections of BSA in Tris-HCl pH 9 adsorbing onto (●) TSKgel SuperQ 5PW, () Toyopearl DEAE 650M and () Toyopearl GigaCap Q-650M. First endothermic peaks obtained for 30 µL injections of the same solutions onto (●) TSKgel SuperQ 5PW are also shown. Only considered trials with a linear relation between injection concentration and surface concentration were considered. ... 40 Figure 21 - Second endothermic peak area related with surface concentration obtained for 230 µL injections of BSA in Tris-HCl pH 9 adsorbing onto (●) TSKgel SuperQ 5PW, () Toyopearl DEAE 650M and () Toyopearl GigaCap Q-650M. Second endothermic peaks obtained for 30 µL injections of the same solutions onto (●) TSKgel SuperQ 5PW are also shown. Only considered trials with a linear relation between injection concentration and surface concentration were considered. ... 42 Figure 22 - Exothermic peak area related with flowthrough obtained for 230 µL injections of BSA in Tris-HCl pH 9 adsorbing onto (●) TSKgel SuperQ 5PW, () Toyopearl DEAE 650M and () Toyopearl GigaCap Q-650M. Note that TSKgel SuperQ 5PW thermogram with no
flowthrough (●) was obtained with a 30 µL loop. The smaller graph in the left bottom corner is a zoom in of lower flowthrough percentages. ... 43
Figure 23 - Schematics of surface transport mechanisms present in IEC resins. (Top) Activated jump present in all IEC resins and (Bottom) Chain delivery mechanism present in grafted resins, for example: TSKgel SuperQ and Toyopearl GigaCap. Adapted from 2 ... 44
Figure 24 - Exothermic peak area related with surface concentration obtained with 30 µL injections of BSA in Tris-HCl pH 9 adsorbing onto TSKgel SuperQ 5PW. Obtained with no flowthrough. ... 45 Figure 25 - FMC thermograms obtained for 230 µL injection of different concentrations of negatively net charged BSA in equilibrium buffer Tris-HCl pH 9 adsorbing onto negatively charged TSKgel SP 5PW. Surface concentrations are respectively (green) 2.8 mg.mL-1, (dark
blue) 5.85 mg.mL-1, (grey) 30.03 mg.mL-1, (orange) 45.71 mg.mL-1 and (light blue) 65.0
mg.mL-1. Shaded area represents the interval of time at which there was protein flowing
through the cell. ... 46 Figure 26 – Exothermic peak area related with BSA surface concentration. Obtained with TSKgel SP 5PW with 230 µL injections with Tris HCl pH 9. ... 47 Figure 27 - FMC thermograms obtained for 230 µL injection of BSA in 20 mM Tris-Hcl at pH 9 with 50 mM NaCl adsorbing onto TSKgel SP 5PW with the respective surface concentration obtained. The shaded area corresponds to the protein plug in the cell. ... 48 Figure 28 - Equilibrium binding isotherm for BSA adsorption onto TSKgel SP 5PW in Tris-HCl pH 9 with 20 mM Tris at 295 K in the absence of salt (●) and with 50 mM NaCl (). ... 49 Figure 29 - FMC thermograms obtained for 230 µL injection of different BSA solutions
concentrations in equilibrium buffer Tris-HCl pH 9 adsorbing onto TSKgel SuperQ 5PW. Injection concentrations are represented in the figure followed by the resulting surface concentration obtained. For example: (dark blue) thermogram was obtained injecting 50 mg.mL-1 BSA solution resulting in 21.5 mg BSA.mL-1 TSKgel SuperQ. ... 59
Figure 30 - FMC thermograms obtained for 230 µL injection of different BSA solutions concentrations in equilibrium buffer Tris-HCl pH 9 adsorbing onto Toyopearl DEAE 650M. Injection concentrations are represented in the figure followed by the resulting surface concentration obtained. For example: (light green) thermogram was obtained injecting 20 mg.mL-1 BSA solution resulting in 22.16 mg BSA.mL-1 Toyopearl DEAE. ... 60
Figure 31 - FMC thermograms obtained for 230 µL injection of different BSA solutions
concentrations in equilibrium buffer Tris-HCl pH 9 adsorbing onto Toyopearl GigaCap Q-650M. Injection concentrations are represented in the figure followed by the resulting surface concentration obtained. For example: (dark blue) thermogram was obtained injecting 75 mg.mL-1 BSA solution resulting in 74.9 mg BSA.mL-1 Toyopearl GigaCap Q-650M. ... 61
List of tables
Table 1 - Branches of liquid chromatography based on stationary phase ligand and mobile phase proprieties. Adapted from 6. ... 4
Table 2 - List of most used ion-exchange ligands on current chromatographic systems and its structure. Adapted from 15. ... 4
Table 3 Charge of the ligand on different values of solution pH. Adapted from 16. ... 5
Table 4 - Post-translational modifications contributing to charge properties and charge
alterations of proteins. Adapted from 12. ... 6
Table 5 - Bovine serum albumin physical isomers physical parameters. Adapted from 30. ... 14
Table 6 – Summary of events responsible for thermodynamic changes in a chromatographic system. Note that some of these events are interconnected and all are highly related. ... 19 Table 7 – Expected signs of the enthalpic processes based in upon a large body of
thermodynamic results for protein-ligand association in solution and protein-solid phase interaction. Adapted from Ross et al. 39 ... 19
Table 8 - Structural parameters of the studied resins together with the observed static
Chapter 1 – Introduction
1.1 Importance of protein purification
Proteins are complex molecules composed of amino acids. These have the most dynamic and diverse roles than any other macromolecule in the animal body. Some of their functions include: catalysis of biochemical reactions; formation of receptors and channels in membranes; giving intracellular and extracellular scaffolding support; and transportation of molecules within a cell or from one organ to another 3. Formerly, protein therapeutics was a
rarely used subset of medical treatments. Nevertheless, its application has increased dramatically since the introduction of the first recombinant protein, human insulin, 35 years ago 4. Recombinant proteins are produced through recombinant deoxyribonucleic acid (DNA)
technology, which involves inserting the protein encoding DNA into bacterial, yeast, vegetal, insect or mammalian cells, expressing the protein in these cells and then purifying the protein of interest from them. Many biological medical products such as monoclonal antibodies and biosynthetic human insulin are examples of recombinant protein therapies 5.
Purified proteins are used in disease treatments in which have several advantages over small-molecule drugs 3, such as:
High specific and complex set of functions that chemical compounds cannot mimic. Less potential for protein-based therapies interfere with normal biological processes and cause adverse effects due to the fact that proteins are highly specific.
Replacement treatment in diseases that have a mutated gene. Since gene therapy is not currently available for most genetic disorders.
Molecules used in recombinant protein therapies are required to have a very high degree of purity. This purification process is also vital for studies of the function, structure and interactions of the protein of interest. There are several steps involved in the acquisition of a specific purified protein from a mixture. These steps may separate the protein from non-protein parts of the mixture in a prior stage, and finally separate the chosen non-protein from all other proteins with a desired purity. Separation of one protein from others is typically the most laborious aspect of protein purification 6. This or these separation steps may be
accomplished with liquid chromatography due to its proven efficiency, specificity and the lack of better techniques. Liquid chromatography technique can exploit differences in protein size, physico-chemical properties, binding affinity and biological activity.
1.2 Liquid-solid chromatography contemporary viewpoint
Liquid-solid chromatography (LC) is as a process that employs a fixed-bed of a solute-interacting material, known as the stationary phase, to separate a mixture of components that are carried by a fluid phase, known as the mobile phase. Liquid-solid chromatography includes a variety of interaction mechanisms and modes of operation for the separation of mixtures, but in all cases the mixture of components that are to be separated must interact differently with the stationary phase and the mobile phase. Figure 3 shows a scheme of a conventional column liquid chromatography (A) and a continuous annular chromatography (B) currently used in laboratories and in some industries 6.
Figure 3 - Schematics of a conventional column chromatography (A) and continuous annular chromatography (B) mostly used in biotechnological industries. The process is two dimensional in both cases. Adapted from 6.
The purpose of chromatography is not always purification, it can be also used for analytical applications:
In preparative chromatography the objective is to obtain one isolated pure substance for posterior use 7.
In analytical chromatography the main objective is the separation of molecules with the final objective of analysis, quantification, identification 8 as well as studies of the
protein's structure 9, post-translational modifications 10 and function 9,11;
Contemporary liquid-solid chromatography can be divided, based on the type of stationary phase ligate nature, into several branches (summarized Table 1).
Size exclusion chromatography (SEC) is grounded on non-adsorptive phenomena of proteins enabling separation of molecules based on the difference in its retention factors dependent on the molecule size 12.
Reversed phase chromatography (RPC) uses hydrophobic ligands that bind strongly with hydrophobic molecules or moieties in proteins 6. The elution is mainly performed with water-
miscible organic solvents, which have non-polar characteristics in order to reduce protein interaction with the stationary phase. Unfortunately, that may cause protein denaturation due to high hydrophobicity, leading to the usually irreversible exposure of hydrophobic moieties that are in the interior of the globular protein. This is one of the major disadvantages of this type of stationary phases used in preparative chromatography. However, RPC is very popular for chromatographic analytical purposes 6,12.
Another branch based on hydrophobic ligands is hydrophobic interaction chromatography (HIC). The hydrophobic ligands are presumed to interact with hydrophobic side chains of the protein. The hydrophobic character of a protein is promoted in presence of anti-chaotropic salts. The salt changes the hydration shell of both, the protein and the ligand, which promotes hydrophobic interaction forces (the so called salting out effect). Salt may also in some cases alter the conformational structure of proteins 12. The elution in HIC is achieved by
decreasing salt concentrations instead of using organic solvents, which makes this approach much more attractive to preparative chromatography.
Ligands that have the ability to recognize one of the structural motifs of a molecule are used in what is called biospecific or affinity chromatography. This interaction can be extremely specific and the ligand will interact with only one type of molecule, or the ligand can be designed so that it recognizes a group of structurally similar molecules. Nevertheless, if the adsorption is too strong it will make it too difficult to desorb the target protein from the column.
Ion exchange chromatography (IEC) is probably the most used liquid chromatographic method in protein purification due to displaying the highest binding capacities for these biomolecules
13. It was indicated that about 40% of chromatographic steps for protein purification are IEC,
on an average of three chromatographic steps in the process 14. IEC is based on the binding of
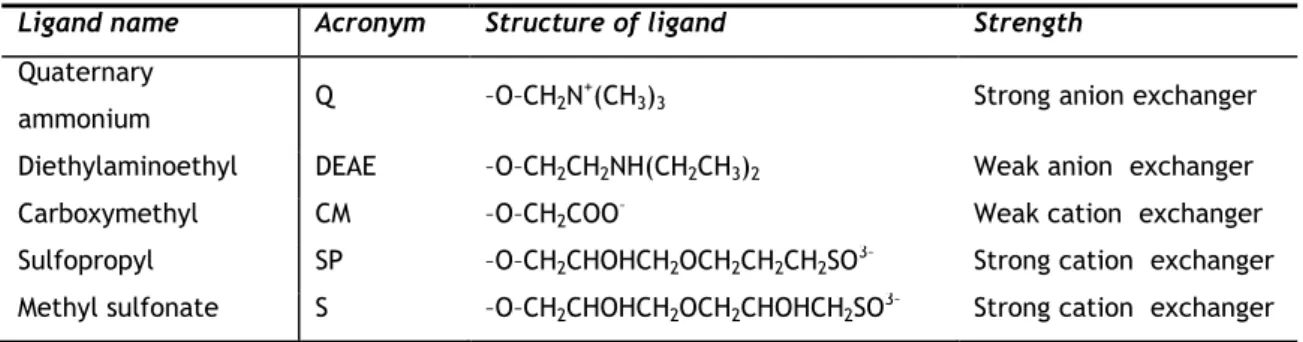
proteins to charged groups immobilized on the solid phase which are in equilibrium with free counter-ions in the mobile phase. Table 2 and Table 3 refer the present-day most common ligands used in IEC.
Table 1 - Branches of liquid chromatography based on stationary phase ligand and mobile phase proprieties. Adapted from 6.
Table 2 - List of most used ion-exchange ligands on current chromatographic systems and its structure. Adapted from 15.
Stationary phase
ligate Mobile phase Branch Acronym
None Aqueous Size exclusion SEC
Hydrophobic Normally a water-organic solvent mixture. Elution with increasing percentage of organic solvent.
Reversed phase RPC
Mildly hydrophobic Normally an aqueous solution with high anti-chaotropic salt concentration. Elution with decreasing salt concentrations
Hydrophobic interaction
HIC
Charged Normally an aqueous solution with low salt concentration. Elution by increasing salt concentrations
Ion exchange IEC
Biospecific Aqueous. Elution varies with the system Affinity/biospecific interaction
AC/BIC
Ligand name Acronym Structure of ligand Strength
Quaternary
ammonium Q –O–CH2N
+(CH
3)3 Strong anion exchanger
Diethylaminoethyl DEAE –O–CH2CH2NH(CH2CH3)2 Weak anion exchanger
Carboxymethyl CM –O–CH2COO– Weak cation exchanger
Sulfopropyl SP –O–CH2CHOHCH2OCH2CH2CH2SO3– Strong cation exchanger
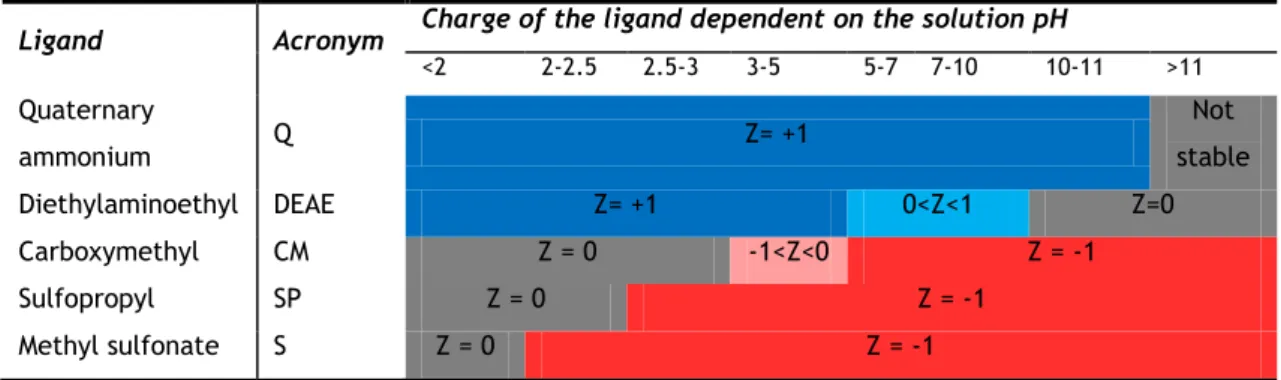
Table 3 Charge of the ligand on different values of solution pH. Adapted from 16.
In this process of adsorption the counter-ions are exchanged with the charged protein, hence the name ion exchange chromatography. Charged amino acid residues located in the protein surface and other several types of surface modifications that alter the surface charge properties (namely charged groups which are post-translationally attached to proteins) are believed to be responsible for the adsorption process 12, see Figure 4. Some post-translation
modifications that contribute greatly for the protein surface charge are shown in Table 4 as an example.
Figure 4 - Qualitative electrostatic representation of bovine serum albumin (BSA) charged surface. The heterogeneity of charges in this asymmetrical protein is clearly shown. BSA heterogeneous surface is shown on the lower panel and colored according to the electrostatic potential calculated with PyMOL17
molecular graphics software ignoring solvent screening effect. For electrostatic potential, red is used for negative (-) and blue for positive (+).
Ligand Acronym Charge of the ligand dependent on the solution pH
<2 2-2.5 2.5-3 3-5 5-7 7-10 10-11 >11 Quaternary ammonium Q Z= +1 Not stable Diethylaminoethyl DEAE Z= +1 0<Z<1 Z=0 Carboxymethyl CM Z = 0 -1<Z<0 Z = -1 Sulfopropyl SP Z = 0 Z = -1 Methyl sulfonate S Z = 0 Z = -1
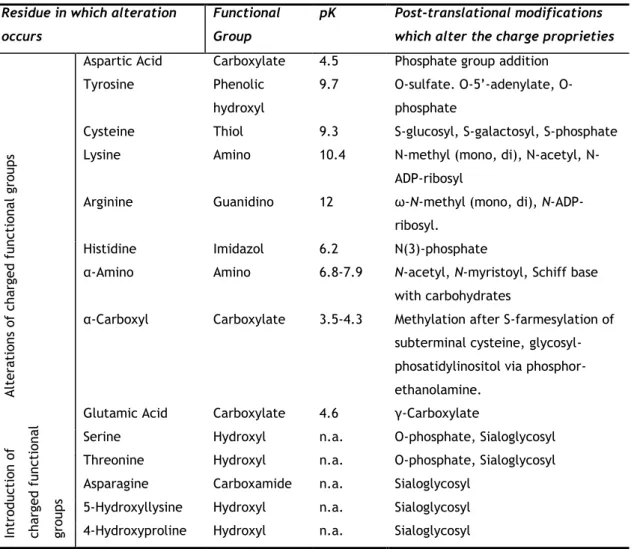
Table 4 - Post-translational modifications contributing to charge properties and charge alterations of proteins. Adapted from 12.
Residue in which alteration occurs
Functional Group
pK Post-translational modifications which alter the charge proprieties
A lte ra ti ons o f cha rge d funct io na l gro up s
Aspartic Acid Carboxylate 4.5 Phosphate group addition
Tyrosine Phenolic
hydroxyl
9.7 sulfate. 5’-adenylate, O-phosphate
Cysteine Thiol 9.3 S-glucosyl, S-galactosyl, S-phosphate
Lysine Amino 10.4 methyl (mono, di), acetyl,
N-ADP-ribosyl
Arginine Guanidino 12 ω-N-methyl (mono, di),
N-ADP-ribosyl.
Histidine Imidazol 6.2 N(3)-phosphate
α-Amino Amino 6.8-7.9 N-acetyl, N-myristoyl, Schiff base with carbohydrates
α-Carboxyl Carboxylate 3.5-4.3 Methylation after S-farmesylation of subterminal cysteine, glycosyl- phosatidylinositol via phosphor-ethanolamine. Int ro ductio n of cha rge d funct io na l gro ups
Glutamic Acid Carboxylate 4.6 γ-Carboxylate
Serine Hydroxyl n.a. O-phosphate, Sialoglycosyl
Threonine Hydroxyl n.a. O-phosphate, Sialoglycosyl Asparagine Carboxamide n.a. Sialoglycosyl
5-Hydroxyllysine Hydroxyl n.a. Sialoglycosyl 4-Hydroxyproline Hydroxyl n.a. Sialoglycosyl
1.3 Protein adsorption process in liquid-solid chromatography
In liquid-solid chromatography, the stationary phase should have the ability to attract the target substances by what may be considered as a dynamic equilibrium. This equilibrium is very complex and Figure 5 represents an over-simplified model scheme of the adsorption mechanism in general chromatography systems. In this model there is an equilibrium where molecules of the mobile phase, or ions and water molecules in ion exchange chromatography, are continually being adsorbed and desorbed from the stationary phase. When the protein or mixture is introduced the equilibrium conditions between the mobile phase and the adsorbed surface are disturbed, creating a competition for the adsorptive sites on the surface of the chromatographic support. A stronger affinity between the support and the protein will lead to more displacement of solvent molecules/ions in favor of the protein molecules. It must be considered that this scheme is too elementary to represent all the interactions that occur in a chromatographic system. There are additional interactions between the proteins themselves and mobile phase molecules/ions that also interact with proteins, this will be covered into deeper detail later in this work. The magnitude of interaction of a protein with a surface is governed by the system free energy before and after the interaction and can be attributed to changes in system enthalpy and entropy 18.For effective protein retention to occur, the choice of mobile phase must be such that protein molecules have higher attraction towards the adsorbent than mobile phase molecules. However, the affinity should not be to strong not to hinder the elution of the target protein in the elution buffer 1.
This equilibrium is established under static conditions when the mobile phase is not in motion and defines the equilibrium binding capacity (EBC). Under dynamic conditions, i.e., when the mobile phase is flowing through the column, dynamic binding capacity (DBC) dictates packed columns performance, the DBC is generally related to EBC but is influenced by dispersive factors, approaching the EBC only for conditions where the column has infinite efficiency 1,6.
Given these points, it is clear the necessity to understand and further elucidate these complex interactions that contribute to protein adsorption phenomena.
1.4 Interactions that contribute to protein adsorption
Some of the technological problems regarding the mechanism of adsorption and aggregation are being studied by using computational molecular simulations 19–26 combined with
theoretical 27,28 and experimental investigations 2,29–31. As explained before, protein adsorption
at chromatographic surfaces involves various interactions between the protein and surface or the ligands attached to the surface. The interactions that contribute to protein adsorption may include, hydrogen bonding, hydrophobic interaction, electrostatic interaction, van der Waals interaction, coordination bonding and conformational entropy among others, resulting from the interplay between them 15.
1.4.1 Hydrogen bond
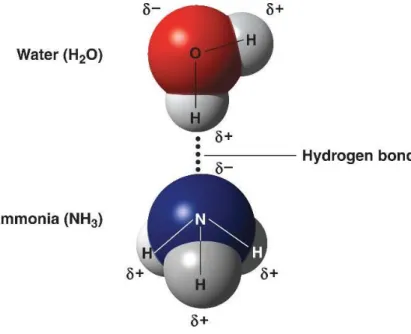
A hydrogen bond is an interaction in which a hydrogen atom is attracted simultaneously by two electronegative atoms. Hydrogen bonding energy decreases with increasing temperature and ion strength 15, as well as by the presence of chaotropic agents such as urea and
guanidine hydrochloride. According to Norde, contributions from hydrogen bonding (other than accounted for in the hydrophobic effect) are believed to have only a minor effect on protein adsorption 32.
Figure 6 - Example of a hydrogen bond between water and ammonia molecules. (δ+) represents positive partial charges and (δ-) represents negative partial charges due to atom electronegativity 33.
1.4.2 Hydrophobic Interaction
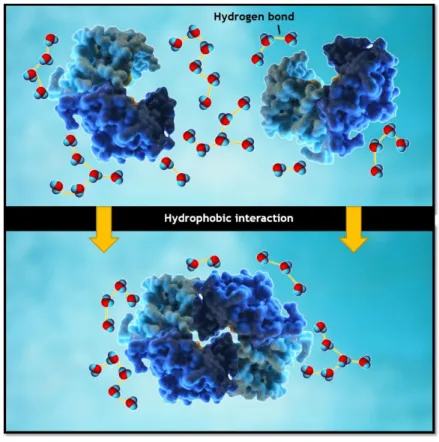
A solute or moiety is considered hydrophobic if it binds to water more weakly than water itself 34. Hydrophobic interaction is caused by redistribution of ordered water molecules
around apolar moieties back into bulk solution that causes the association of apolar parts, as shown in Figure 7. This association can be between protein-protein hydrophobic parches or protein-support hydrophobic interaction 15. It has been estimated that dehydration of
hydrophobic surfaces results in a reduction in the Gibbs energy of 5-15 mJ.m-2 32. This is
mainly due to entropy increase because water molecules get released from the surface of the protein or the solid phase.
Figure 7 - Scheme of hydrophobic interactions and reorganization of water molecules. Note that the number of ordered water molecules decreases after the interaction, which makes this process entropically favorable.
Increasing temperature and/or salt concentration usually causes stronger hydrophobic interactions. It is known that water molecules have a higher tendency for hydration of the salt molecules than macromolecules and consequently the presence of the salt can enhance the hydrophobic interaction because it will reduce the number of water molecules that are surrounding the proteins 35, promoting protein adsorption. Salt type also changes the
1.4.3 Electrostatic Interaction
Electrostatic phenomena arise from the forces that electric charges exert on each other. Such forces are described by Coulomb's law.
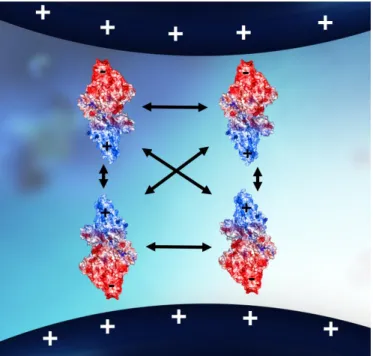
Figure 8 shows a representation of these forces inside a chromatographic support pore. Basically, opposite charges attract and similar ones repel each other. When the molecule and the stationary surface are both charged, electrostatic interaction, attractive or repulsive, can occur between them.
Figure 8 - Schematic representation of the oriented alignment of proteins induced by like-charged surfaces. The oriented alignment maximizes the electrostatic repulsions, leading to the inhibition of protein aggregation. Adapted from 2.
The strength of electrostatic interaction depends on the charge numbers, so it is significantly affected by both pH and ionic strength. The increase of ionic strength will weaken (screen) or even completely shield the electrostatic interaction. The increase of temperature reduces electrostatic effect due to the enhanced thermal motion of molecules and atoms at elevated temperature 15. These forces are also responsible for inhibiting aggregation and refolding of a
1.4.4 Van der Waals interactions
Van der Waals interactions are relatively weak forces of attraction between electrically neutral molecules that collide with or pass very close to each other. There are still some contradictions in this area, some authors state that van der Waals interactions hardly influence adsorption of proteins 32 but newer studies showed that van der Waals forces may
even be the driving force of protein adsorption in chromatographic supports, especially in the presence of salt 18,36,37. These forces have a very limited range of distance (around 0.2 nm)15.
Due to their short range they need the occurrence of previous events, water molecule displacement due to hydrophobic interaction is one example. For that reason, van der Waals forces are often considered the major contribution to the hydrophobic interaction 38.
However, van der Waals forces are believed to be weaker than most of the other molecular interactions, usually releasing energy in the order of −6.56 × 10⁻⁶ to −0.03 J.m−2, without salt
and with salt respectively 36,39
1.4.5 Coordination Bond
These interactions occur between solid phase metal ions, such as Cu2+, Zn2+, Ni2+, and Co2+
and imidazole group of histidine amino acid from the proteins. It is very specific and can be weakened with increasing temperature or the presence of chelating agents, e.g., ethylenediaminetetraacetic acid (EDTA) due to binding possibility with metal ions 15.
1.4.6 Conformational Entropy
Adsorption results in the reduction of conformational entropy, so conformational entropy is thermodynamically unfavorable for adsorption 15. Therefore, adsorption takes place only if
the loss in conformational entropy is compensated by sufficient attraction between the solute molecules and the surface or the entropy gained with the release of water molecules to the bulk solution. This process will be further elucidated in this work.
In summary, protein adsorption is a complex process that is controlled by a number of subprocesses with synergistic and antagonistic effects of the interactions mentioned above. These subprocesses of adsorption will be further explained in this chapter. Examinations of the interactions involved in protein adsorption facilitate the knowledge development and findings on protein behavior at chromatographic surfaces. Furthermore, knowledge on the binding behavior of proteins may also provide valuable insight into the molecular mechanisms of protein–protein or protein–membrane interactions in a biological context 18.
1.5 Protein surface, orientation and conformational role in
adsorption
The diversity of the amino acids hydrophobicity/hydrophilicity or charged/neutral features results in an extraordinary structural complexity of protein molecules. Things become more complex when considering the folding of protein molecules into their secondary and tertiary structures 40.
Protein folding leads to a heterogeneous surface that can be decomposed into individual patches exhibiting specific properties. Bovine serum albumin (BSA), for example, consists of three domains that repeat the α-helix pattern. The BSA molecule is characterized by an asymmetric charge distribution. Considering the theoretical calculations, domains I, II and III have charges −9, −7.8 and −1.3, respectively, at pH 7.0 30. Its isoelectric point (pI) is reported
on a pH range from 4.8 to 5.6 41. Protein behavior at chromatographic surfaces is complex,
often results of interplay of attraction and repulsion of individual patches on the heterogeneous surface of protein that have diverse properties. At a positively charged surface, negative charged patches of the protein molecule are attracted and tend to bind to the surface while the positively charged patches are repulsed away from the surface, see
Figure 9. Similarly, hydrophobic patches of the protein molecule are attracted to a hydrophobic surface while the hydrophilic patches are repulsed, due to water molecules movement.Rotation of the protein molecule or conformational alterations are then driven by attraction and/or repulsion, leading to preferred binding sites on protein 40.
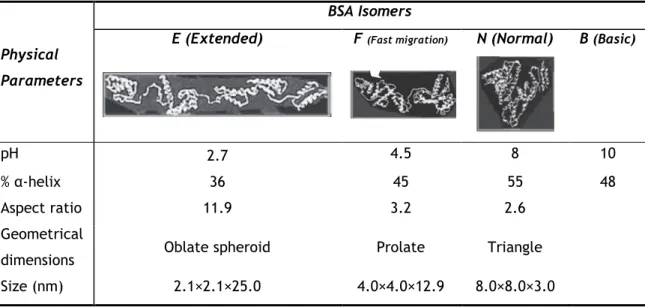
There are a number of factors that contribute to protein conformational transitions. BSA, for example, has several isomeric forms at different pH values 30 that are classified as: Extended
(E); Fast migration (F); Normal dominant (N); Basic form (B), see Table 5. Solution pH leads to charge changes in protein residues, changing α-helix proportion and causing changes in different physical proprieties like aspect ratio, geometrical shape and total dimensions 30. All
of these changed proprieties may alter the protein binding process.
Table 5 - Bovine serum albumin physical isomers physical parameters. Adapted from 30.
Physical Parameters
BSA Isomers
E (Extended) F (Fast migration) N (Normal) B (Basic)
pH 2.7 4.5 8 10
% α-helix 36 45 55 48
Aspect ratio 11.9 3.2 2.6
Geometrical
dimensions Oblate spheroid Prolate Triangle
Size (nm) 2.1×2.1×25.0 4.0×4.0×12.9 8.0×8.0×3.0
All things considered, protein adsorption onto any support can be a complicated process influenced by pH, temperature, ionic strength, protein conformational changes and the electrochemical and physical proprieties of both the protein and the solid phase 36.
1.6 Subprocesses of protein adsorption
A comprehensive understanding of the adsorption phenomena, and in particular its molecular mechanism, is crucial for the research and development of biomolecule chromatography. Many experimental techniques, for example, atomic force microscopy, nuclear magnetic resonance, X-ray crystallography, surface plasmon resonance, hydrogen-deuterium isotope exchange, confocal laser scanning microscopy, and titration calorimetry have been used to explore the microscopic information of the adsorption processes 15. However, none of these
techniques can detect the dynamics of the process, which restricts not only the adsorption mechanism understanding, but also the ligand design and process optimization 15.
Nevertheless, some light has been shed on the molecular mechanism of interaction. According to Yamamoto 42 and Hearn 18, the binding process of different biomolecules onto,
respectively, ion exchange and hydrophobic interaction resins can be divided into at least five subprocesses 18,42–46:
1. Dehydration or/and removal of the protein electrical double layer (EDL); 2. Dehydration or/and removal of the solid phase electrical double layer (EDL); 3. The interaction between the protein and the solid phase;
4. The structural rearrangement of the protein upon adsorption;
5. Rearrangement of the excluded water or/and ion molecules in bulk solution.
Dehydration or removal of the protein electrical double layer (EDL). EDL theoretical concept will be further explained in this chapter. Prior to adsorption, water molecules or/and ions that surround the protein must be partially excluded. It was observed that hydrophobicity of a protein increases with size and exposed hydrophobicity surface area. Given that, proteins with larger exposed hydrophobic patches require more energy for this dehydration/de-counter-ion step. It is important to realize that this dehydration step is an energy consuming process in which enthalpy of adsorption increases. However, the entropy gain due to more release of water or ions usually results in higher degrees of freedom and compensates this unfavorable enthalpic increase 18. This specific subprocess will be further addressed in this
chapter from a thermodynamic point of view.
Dehydration or removing the EDL of the solid phase is necessary for protein adsorption. Water molecules and ions surrounding the ion exchanger are excluded 42 in the same way of
the first subprocess. It will depend on the proprieties of the solid phase, such as electrostatic state, functional groups and hydrophobicity.
bonding or formation of coordination complexes can occur. These forces are usually accompanied by enthalpy release and entropy loss, giving this subprocess an important role in the determining the magnitude of the total adsorption enthalpy 18,42.
The structural rearrangement of the protein upon adsorption. Fourier transform infrared spectroscopy with attenuated total reflectance (ATR-FTIR) procedures revealed that proteins undergo a large degree of structural rearrangement in liquid chromatography 47. These
structural changes are higher in bigger proteins that are considered “soft”, like BSA. Enthalpy change associated with this process obtained by microcalorimetry for BSA is between 4-10 mJ.m-2, which shows that this is an endothermic process (due to being positive), at least in
presence of hydrophobic solid phases 18.
Rearrangement of the excluded water or ion molecules in bulk solution contributes to the entropy increase. It is believed that this process is much more important in ion exchange adsorption mechanism 42 than in hydrophobic interaction adsorption 18.
This classification can be used to facilitate interpretation of the enthalpy changes measured by microcalorimetry or van’t Hoff plot analysis to further elucidate the molecular adsorption mechanism from a thermodynamic point of view.
1.7 Thermodynamic aspects of interaction in chromatography
The possibility of a protein to be adsorbed (at constant pressure and temperature) is determined by the change in standard Gibbs free energy (∆Go) of the system, which can bewritten for a reversible adsorption process:
(1)
where ∆Ho is the standard enthalpy change in the process and ∆So is the standard entropy
change. Exothermic events (∆Ho<0) result in heat released by the system, while endothermic
events (∆Ho>0) leads to heat absorption.
Paying closer attention, for a process spontaneously occur, ∆Go must be negative. When the
adsorption process results from an increase in enthalpy (positive values for ∆Ho) the entropic
effects are considered to dominate the adsorption process. In this case, the binding strength of the protein with the sorbent is generally expected to be enhanced by increases in temperature, as often occurs in the case of HIC 18 and IEC 48,49.
Separation of different proteins is achieved by tuning its adsorption affinities for a specific solid phase. The equilibrium binding affinity constant (K) can be related to the standard Gibbs free energy (∆Go) change for a specific protein-solid phase as:
(2)
where R is the gas constant (8,314462 J.K−1.mol−1) and T is the absolute temperature in
Kelvin. From equation 6 and 5 we can understand that for protein separation to occur, i.e. if proteins have different values for binding affinity (K), this can be associated with different ∆Go values which is related to different enthalpy and entropy values. Proteins can thus be
separated by varying the magnitudes of the respective enthalpy or/and entropy changes, resulting in different binding affinities and different adsorption free energies changes.
1.7.1 Processes that can contribute to enthalpy and entropy change in IEC
protein adsorption
It has been suggested and theoretically estimated 42,50 that the major contributions to the
entropy change, associated with protein adsorption, are the process of dehydration or/and the obliteration of the electrical double layer 18. In both processes, changes in the structure
According to past estimates from 1979 this dehydration step was exothermic (∆H<0) 51. We
know now from direct measurements that this is the exception and not the rule. Surface and protein dehydration, in most cases, requires energy being actually an endothermic process (∆H>0) 18,29. For example, solid phases with aromatic hydrocarbons have endothermic
dehydration enthalpies but aliphatic hydrocarbons have negative dehydration enthalpies. Other studies showed that more hydrophobic proteins need more energy to dehydrate, and exhibit higher dehydration heats 18. This observation indicated that both protein and solid
phase dehydration is enthalpicaly unfavorable. The adsorption process occurs due to large entropy gains that compensates that enthalpicaly unfavorable condition. In other words, more hydrophobic proteins have more ordered water molecules around them, hence the need of larger energies to remove them. This does not mean that these proteins will have more difficulty in adsorbing because this energy is later compensated by the higher water molecule degrees of freedom gained, also known as, entropy gains. It was shown that interaction between globular proteins and HIC solid phases are dominantly governed by hydration/dehydration processes 52,53. It was found that the removal of water from protein
polar groups carries a large enthalpic penalty 54 which explains the relatively large
dehydration energy necessary.
According to Norde et al. structural rearrangements of proteins upon adsorption also contribute to entropy changes but not as significant as the hydration/dehydration processes. These rearrangements are believed to play more important roles in enthalpy changes. Also, positive ∆H values were obtained for this subprocess, using flow microcalorimetry when BSA is adsorbed onto negative charged surfaces 18,37,55,56.
There are other interactions that may have an influence on the enthalpy changes. For instance, the attractive electrostatic forces between the protein and the charged resin are expected to generate a larger heat release when compared to the hydrophobic interactions
18. According to Ross et al., ionic interactions have negative ∆H or sometimes, slightly positive
∆H 39. Generally, electrostatic interactions play an important role in determining the
magnitude of the adsorption total enthalpy. However, this does not mean that protein adsorption in IEC is solely driven by enthalpy changes, as observed by prior studies 18,29,57.
More examples of other interactions are the double-layer, Born and hydration repulsion effects that occur when the diffuse layers start to approach each other. Born and hydration repulsion forces resulting from the overlapping of electron orbitals difficult the removal of water molecules from the interfacial region and prevent strong attractive interactions between the protein and the solid phase. These repulsive forces contribute mostly to the increase of positive enthalpy change, leading to unfavorable conditions for protein binding 18.
In summary, Table 6 and Table 7 are presented to assemble all the processes that are currently believed to be responsible for thermodynamic changes in a chromatographic system.
Table 6 – Summary of events responsible for thermodynamic changes in a chromatographic system. Note that some of these events are interconnected and all are highly related.
Enthalpic events Entropic events
EDL overlapping 18
Ionic interactions and van der Waals 37,39
Dehydration 29
Electrostatic interactions 29
Born and hydration repulsion forces 18
Hydrogen bonding 39
Structural rearrangements upon adsorption 18,37,50
Interaction between adsorbed proteins 37
Dehydration and hydration 18
Abolition of EDL 18
Structural rearrangements upon adsorption (although with a low significance) 18,50
Table 7 – Expected signs of the enthalpic processes based in upon a large body of thermodynamic
results for protein-ligand association in solution and protein-solid phase interaction. Adapted from Ross
et al. 39
Process ∆H
Dehydration (partial withdrawal of the water from protein nonpolar groups)
18,39
Positive
Van der Waals 36,39 Negative
Hydrogen bonding (in low salt medium) 39 Negative
Ionic or electrostatic interaction 31,39 Negative or slightly
positive
Protein protonation 39 Negative
Protein conformational changes 37,56 Positive
Reorientation and rotation in IEC solid phase 29 Positive
Repulsive forces between same charges or between hydrophilic moieties and hydrophobic groups 29,37
Positive
1.7.2 Van’t Hoff plot analysis
Van’t hoff analysis is an indirect method to measure thermodynamic quantities associated with liquid chromatography in which the enthalpy and entropy changes can be obtained by joining equations 1 and 2 obtaining the following van’t Hoff linear expression:
∆H0 and ∆S0 may not change linearly with temperature in the case of proteins, making, as
always, the analysis of biomolecules systems more complex. Plotting the natural logarithm of the retention data, against the inverse of the absolute temperature in Kelvin, as shown on
Figure 10, allows us to calculate the enthalpy and entropy of a given system. Just by observing the slope we can see if the process in mainly exothermic or endothermic. Also, the indirect method of van’t Hoff analysis is disabled by the presence of multiple subprocesses associated with adsorption and thus does not produce representative results of the complex protein adsorption mechanism, especially in overloaded conditions 18,29.
Figure 10 - Examples of two van't Hoff plots for two types of reactions. This linear behavior is rarely observed when studying biomolecules.
1.7.3 Microcalorimetry techniques
Microcalorimetric techniques have the ability to investigate and enlighten complex adsorption mechanisms in liquid chromatography based on acquired thermodynamic parameters
29,31,37,42,58–61.
There are some discrepancies when thermodynamic values obtained from van’t Hoff analysis when compared to microcalorimetric data. On the other hand, enthalpy changes from
more beneficial since these will reflect more heterogeneous circumstances that will prevail in biological systems 18,48. Two techniques may be used to carry out microcalorimetric studies:
isothermal titration calorimetry (ITC) and flow microcalorimetry (FMC).
1.7.3.1 Isothermal titration calorimetry
A decade ago, the isothermal titration calorimeter (ITC) was considered as a specialist apparatus; few laboratories had access to one and even fewer understood the implications of much of the data generated. Currently, ITC instruments can be found in hundreds of laboratories, whose specialities in biological areas range from determining affinities for whole cellular systems to drug design. This rapid flourishing of the method and widespread availability of data has dramatically increased our understanding of many systems. It has also provided crucial data towards improving our ability to predict thermodynamic parameters for biomolecular processes 62.
ITC directly measures the enthalpy change for a bimolecular binding interaction at a constant temperature. This methodology relies upon a differential cell system within the calorimeter assembly. The reference cell contains only water or buffer, while the sample cell contains the macromolecule or ligand as well as a stirring device. Injection of the second component into the sample cell produces heat effects that are due to stirring, dilution of the ligand, dilution of the macromolecule and the heat of the interaction.
Some examples of biological studies where ITC can be used are: protein–protein and protein– peptide interactions involved in such diverse processes as cell signalling; alzheimer’s disease; transcription; chaperones and muscle contraction. In recent years, studies have described the utility of the technique in the study of protein–drug, drug–DNA, protein–DNA and protein– carbohydrate interactions 62 and as expected, biomolecule-solid phase interactions in
chromatography 18,35,42,43,43–46,58,63.
Nevertheless, ITC based studies present some limitations in understanding adsorption mechanism in chromatography. An ITC cell does not quite replicate the dynamics of a chromatographic process nor permits the observation of several substeps during time in the adsorption process. These disadvantages are overcomed by the more recent use of flow microcalorimetry (FMC). When protein adsorption involves multiple phenomena, like the ones previously mentioned, exothermic and endothermic changes have been observed at different times during the adsorption process, as indicated by the FMC technique 29,31,37.
better understanding of the forces that drive the adsorption process 29,31,37,48,52,58,59,64,65. Also,
as the reader may see in Figure 11, FMC shares with a chromatographic system the same mode of operation, therefore the results are expected to represent what really happens in a chromatographic column. Highly sensitive thermistor sensors, placed in the column volume, are responsible for measuring very small power changes (10-7 W). These energy changes are
converted to heats of adsorption using an experimentally determined calibration factor 37.
Figure 11 - Schematics of a flow microcalorimetry system and all its constituents.
These characteristics make FMC the only experimental technique to date, that can be used to in-situ study of molecular adsorption interactions during chromatography. And without interfering with the thermodynamic and kinetic adsorption equilibrium. This technique has been used in different types of chromatography, i. e. hydrophobic interaction chromatography 59, ion exchange chromatography 29,36,48, affinity chromatography 66 and with
several types of biomolecules such as proteins 29,36,37,48,66 and more recently with pDNA 31.
A typical output from FMC is a graph like the one in Figure 12, which may be called a thermogram. In essence is a plot of heat in µJ.s-1 versus time in seconds. The termogram may
appear, but that energy was transferred/absorbed by the protein-solid phase system, consequently it will be an endothermic event, because the studied system gained energy.
Figure 12 - Example of a characteristic thermogram showing an electrical pulse given to the system (calibration peak) followed by and endothermic and exothermic events. Represented with consent of the author 67.
Flow microcalorimetric methods allow the measurement of the heat flow during the chromatographic process for any range of product concentration. Through the knowledge of the magnitude and chronology of thermal events during and after the biomolecule-adsorbent interaction, the adsorption mechanism can be elucidated.
1.8 Theoretical aspects of adsorption mechanism in preparative
chromatography
Maturity of preparative chromatography will be only reached when it is possible to model and predict its operation for any range of product concentrations. During the last years researchers have presented several empirical, semi-empirical and theoretical equilibrium models to describe and elucidate molecule adsorption mechanisms 68. Some of the used
approaches are presented below.
Adsorption equilibria is usually described by the relation between free protein concentration (C) and the adsorbed protein concentration (Q) in the solid phase. In liquid-solid systems this relation is temperature dependent, hence usually determined at a constant temperature, so it is called adsorption isotherm. Adsorption isotherms data is very valuable for process analysis, design and optimization of adsorption chromatography.
1.8.1 Langmuir model
Among several models, the Langmuir one (equation 1) is the most widely used to explain adsorptive phenomena in chromatography 68:
where Qm is the maximum adsorption capacity and Ka is the association constant of a
molecule to the adsorbent. Maximum adsorption capacity is widely used to compare different solid phases and molecules. At low protein concentration, if one has KaC << 1, equation 1 can
be reduced to linear isotherm expression (Henry isotherm):
where m is a constant. Figure 13 shows a graphical representation of an adsorption isotherm that follows Langmuir model.