Specific electrical energy consumption and CO
2emissions assessment
of agrifood industries in the central region of Portugal
P.D. Silva
1,a *, P.D. Gaspar
1,b, J. Nunes
2,cand L.P.A. Andrade
2,d 1University of Beira Interior, Dept. of Electromechanical Engineering, 6201-001 Covilhã, Portugal.
2
Agriculture school, Polytechnical Institute of Castelo Branco, 6001-909 Castelo Branco, Portugal.
a
dinho@ubi.pt, bdinis@ubi.pt, cjnunes@ipcb.pt, dluispa@ipcb.pt
Keywords: Energy consumption, CO2 emissions, agrifood industry, refrigeration systems.
Abstract. This paper provides a characterization of the electrical energy consumption of agrifood industries located in the central region of Portugal that use refrigeration systems to ensure the food safety. The study is based on the result analysis of survey data and energy characteristics of the participating companies belonging to the following agrifood sectors: meat, dairy, horticultural, distribution and wine. Through the quantification of energy consumption of companies is possible to determine the amount of greenhouse gases (GHGs) emissions indexed to its manufacturing process. Comparing the energy and GHGs emissions indexes of companies of a sector and between sectors is possible to create reference levels. With the results of this work is possible to rating the companies in relation to reference levels of energy and GHGs emissions and thus promote the rational use of energy by the application of practice measures for the improvement of the energy efficiency and the reduction of GHGs emissions.
Introduction
The current demand for energy has reached alarming proportions, severely affecting the future sustainability of the planet. This problem is caused by the release to atmosphere of the greenhouse gases (GHGs) like CO2, among others, resulting from the conversion process of fossil fuels in usable energy (electrical and thermal energy).
To ensure the future sustainability of the planet is necessary reduce the GHGs emissions by saving energy. In this context, the development of studies that allow the reduction or rationalization of energy consumption is important [1].
The importance of the agrifood industry in this context is related to its significance in business development and to the continuous energy consumption by the cooling systems to ensure food safety, making this sector one of the largest energy consumers.
In the European Community there are several studies and guidelines on energy efficiency and sustainability, such as the Green Paper [2]. Additionally, some European projects are aimed to provide new tools, concepts and solutions for improving refrigeration technologies along the European food cold chain such as FRISBEE (Food Refrigeration Innovations for Safety, Consumers Benefit, Environmental impact and Energy) project [3], the Chill-on project [4], aimed to promote the development of devices capable to monitoring effectively the conditions of agrifood products in the food supply chain and the ICE-E (Improving Cold Storage Equipment in Europe) project [5-6], that provide information and tools to cold store operators, designer and users, that allows the choice of energy efficient equipments.
The construction of tools based on mathematical models allows the prediction and control of food quality and safety in the cold chain, combining energy, environmental and economic aspects. This new tools, concepts and solutions provide improvements on the refrigeration technologies used along the European food cold chain.
The scientific research has also dedicated efforts to improve energy-related problems in refrigeration systems of agrifood companies such as the evaluation of energy consumption levels barriers and benefits of implementing food security management systems, development of
Applied Mechanics and Materials Vols. 675-677 (2014) pp 1880-1886 Submitted: 05.08.2014
© (2014) Trans Tech Publications, Switzerland Accepted: 16.08.2014
doi:10.4028/www.scientific.net/AMM.675-677.1880
All rights reserved. No part of contents of this paper may be reproduced or transmitted in any form or by any means without the written permission of TTP, www.ttp.net. (ID: 193.137.97.49, University of Beira Interior, Covilhã, Portugal-06/10/14,15:31:11)
eco-efficiency indexes to qualify companies performance, power management method in the sector, the results of resource efficiency in companies, local food retail chains as method of energy reduction, among many others [7-11].
Also, through the quantification of indexes related to the level of GHGs emissions applied to agrifood industries is possible to qualify companies according to their emissions performance. The amount of emissions determined in this work only represents a portion of total emissions during the life cycle of food products (i.e. extraction of raw materials, production, transportation and storage until consumption) [12]. The life cycle analysis of a food product is an important aspect because increases its commercial value and its acceptance in the markets of developed countries [13].
In Portugal, the Portuguese Federation of Agrifood Industries (PFAI) is engaged in strategies, rules and various types of investments that promote the sector development. The InovEnergy project is the most relevant Portuguese project in this context, aimed to evaluate and promote energy efficiency measures applicable to the Portuguese agrifood industry, through the identification of energy consumption profiles of the greatest number of data sets collected to date in portuguese agrifood companies [14-17].
The work developed and presented in this paper is part of this project results. This paper characterizes the energy consumption and GHGs emissions of agrifood industries located in the central region of Portugal, analysing the energy intensity (EI), the specific electrical energy consumption (SEC), the value of CO2 emissions and the carbon intensity (CI) in six sectors –meat, dairy, horticultural, distribution, fish and wine sectors– as well as performing the comparison between the industries of each sector. It aims, after a detailed energy analysis of the surveyed companies, to identify practice measures necessary to correct unfavourable practices and inefficiencies, in order to improve the energy efficiency and simultaneously contribute to the reduction of the GHGs emissions in agrifood industry.
The Portuguese agrifood industry
The agrifood industry is the industrial sector that most contributes to the Portuguese economy (14 billion euros), representing nearly twice the volume of the second industrial sector, the metallurgical. It is also the industry that invests most in Portugal, and the second industrial sector that generates more employment (about 16%). This sector is crucial to the growth strategy of the country, with direct contribution to exports increase. This sector has the capacity to ensure food self-sufficiency and still is one of the greatest potential for growth in production levels and turnover compared with European counterparts [18]. Currently, the agrifood industry represents 20% of the Portuguese manufacturing industry. After the accession of Portugal to the European Union, the construction of the single market in 1993 forced the agrifood industry to an effort to harmonize rules of handling, manufacturing and displaying, namely the rules for labelling, hygiene, safety and additives. The relationships between industry and production and between industry and universities has driven the development of a more competitive international industry.
Energy efficiency and CO2 emissions in the agrifood industry
The increasing use of energy worldwide raises concern given the scarcity of energy resources and the serious impacts on the environment (climate change and global warming) due to GHGs emissions. Recently, it was observed that in developed countries, energy consumption of residential and commercial buildings has increased its contribution from 20% to 40% of global energy consumption, surpassing the industrial and transportation sectors. Thus, it is expected the increase of energy demand as result of population increase, demand for services in buildings, and requirement of comfort levels. Given these considerations, the building energy efficiency becomes a primary goal in national and international energy policies. The current Portuguese economical situation as well as the requirements imposed regarding the high consumption of energy resources for production and distribution of final energy and annual GHGs emissions, imply to follow a concept of energy
efficiency that has been explored in specialized and scientific literature. This concepts involves the applicability of measures leading to optimize the energy cycles (production and distribution) as well as the rational use, energy conservation and decrease of GHGs emissions. In the case of industries, this condition translates into using less energy and get the same energy value with a smaller amount of GHGs emissions, i.e. at least obtain the same amount of final product and reducing the ecological footprint of companies.
The energy intensity (EI) of an industry relates the final energy consumption to the gross value added, being strongly associated with the type of industry and level of technological development, resulting in an economical efficiency index. Other index widely used is the specific energy consumption (SEC) which is the quotient of the total energy consumption and the amount of raw material/final products, in which variations in the production process and type of equipment used can lead to different values of this parameter.
Energy consumption in Portuguese manufacturing industries is still a factor to be improved in many aspects such as proper maintenance of facilities, an upgrade or renovation of equipment, and encouraging practices measures of energy efficiency. In the particular case of agrifood industry, the energy consumption can reach high values due to the food products processing, but mainly for their cold storage process. Refrigeration of cold stores is responsible for about 60-70% of electricity consumption of these facilities [9-10].
The CO2 emissions index of an industry relates the amount of CO2 resultant of its producer process with the amount of raw material/final products. The carbonic intensity (CI) is one economic index that relates the amount of CO2 resultant of the production process with the gross value added. The CO2 emissions can be direct or indirect. In this work is only studied the electrical energy consumption in agrifood industries. Electrical energy is only accounted in terms of indirect emissions (resultant of the combustion process in thermoelectric centrals). These indexes are used to compare industries in terms of GHGs equivalent emissions in order to be classified them as small or large polluting companies. Materials and methods
Surveys and audits were performed to agrifood companies located in the central region of Portugal to assess the Portuguese outlook of energy consumption and GHGs emissions in agrifood industry, as well as to define what should be the action points that would foster energy efficiency strategies. A sample of 39 companies was considered in the region of Beira Interior North: 9 companies of the meat sector, 8 companies of the dairy sector, 6 companies of the horticultural sector, 7 and 9 companies of distribution and wine sector respectively. The gap between the number of companies in each sector highlights its importance in the region under study as well as the willingness of companies to participate in the study. The characterization of companies was performed by sector and by industry, relying on the following topics: (1) General company information such activity, location, covered area, classification of economic activity, and quantitative information of raw material and final products, supplies and energy consumption; (2) Technical data collected on the facilities and equipment as cold stores features (size and layout), refrigerants used, heat transfer fluids, compressed air systems and energy efficiency measures; (3) Documents provided by companies like plant facilities and flowchart of production processes and/or storage; (4) Additional information about a previous analysis of energy efficiency, in terms of inefficiencies found in equipment and facilities. Table 1 shows the range (minimum to maximum) of annual general indexes per sector. Note that in the horticultural and distribution sectors, the amount of raw materials and final products is the same, because these companies do not have their own production process, working only as warehouses.
Table 1. Range (minimum to maximum) of general indexes per sector.
Sector Employees Business volume
(103€/year) Raw material (ton/year) Final product (ton/year) Electricity (MWh/year) Meat 4 - 48 250 – 8000 42 – 4466 27 – 3349 38 – 1014 Dairy 6 -31 130 – 6000 140 – 1500 25 – 1322 27 – 1454 Horticultural 2 - 26 200 - 2500 400 - 4650 400 - 4650 25 - 1025 Distribution 9 -67 500 - 12500 30 - 2500 30 - 2500 136 – 1027 Wine 1 -22 50 - 4687 50 - 13000 33 – 9750 [kl] 9 - 230
Results analysis and discussion
In order to evaluate the portuguese panorama of energy consumption and GHGs emissions in agrifood industry and to identify the practice measures and strategies that promote energy efficiency, surveys and audits data was obtained, crosschecked and analysed.
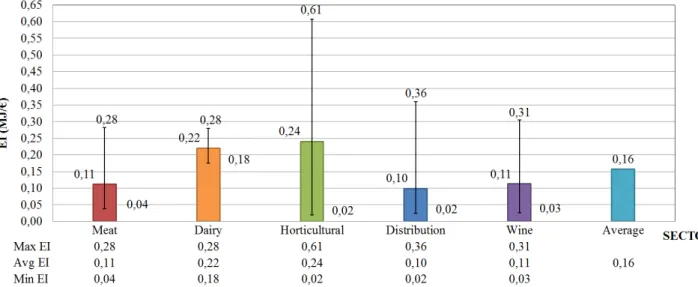
Fig. 1 shows the maximum, average and minimum values of energy intensity (EI) for each agrifood sector. All sectors present consistent values according to literature, being the largest value of EI detected in the horticultural sector. This sector has also the widest span of EI values. In the list of companies analysed in this sector, the majority is classified as small and medium enterprises. In some companies, it was found that the number of employees is not commensurate with the turnover. On the other hand, the distribution sector has lowest EI value. This sector has, notably, the highest turnover, and its energy consumption is exclusively electricity for companies that work as warehouses. Comparing the values of EI presented by the meat and dairy sectors with specific production processes and different production throughout the year, it is shown that the meat sector consumes less energy due to lower losses of raw material during the production process and higher business volumes.
Fig. 1. Range of energy intensity (EI) per agrifood industry sector.
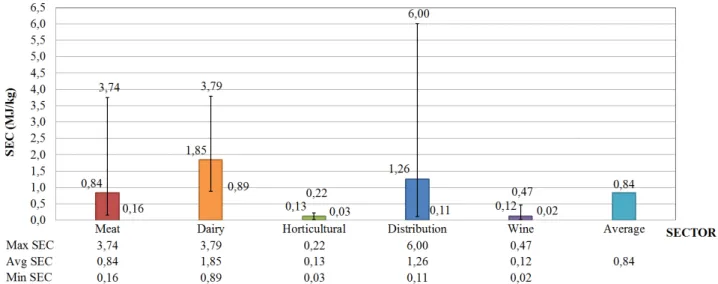
Fig. 2 shows the specific electrical energy consumption (SEC) for the selected agrifood industries. For this energy index it is shown that the dairy sector has the highest SEC value. This sector shows the largest difference between amount of final product and raw material for similar values of energy consumption of other sectors. The distribution sector has the second highest value and largest dispersion between minimum and maximum SEC values.
On the other hand, the horticultural sector presents the lowest average SEC value. The wine sector presents the lowest minimum SEC value, since the amount of energy consumed by refrigeration systems is lower as the production is seasonal, lasting approximately 2 to 3 months.
Fig. 2. Range of specific electricity consumption (SEC) per agrifood industry sector.
Fig. 3 shows the maximum, average and minimum values of GHGs emissions for each agrifood sector. This index shows that dairy sector is the biggest polluter, presenting the highest value of GHGs emissions due to high consumption of thermal energy. The distribution sector presents the greater range between the maximum and minimum values of GHGs emissions. By the other side, the horticultural and wine sectors are the lowest polluters. Like in Fig. 1, the distribution sector shows the largest range of variation due to the direct relation of emissions and electrical energy consumption. This condition is related to the dimension of the companies evaluated in this sector.
Fig. 3. Range of CO2 emissions (CO2-Emissions) per agrifood industry sector.
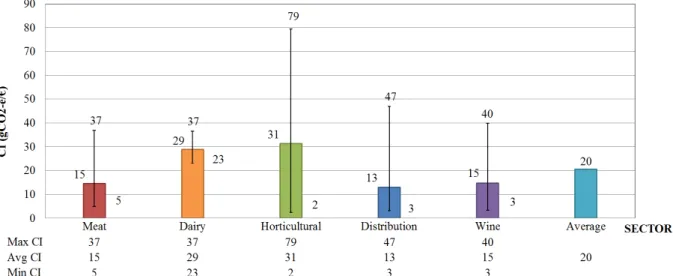
Fig. 4 shows the different values of carbon intensity (CI) for each agrifood sector. For this index the horticultural sector presents the highest CI. This sector has also the greatest range between the maximum and minimum values of CI. On the other hand, shows that the distribution sector has the lowest CI value. This happens because the distribution companies have a large turnover when compared to companies from other sectors.
Fig. 4. Range of carbonic intensity (CI) per agrifood industry sector. Conclusions
The results from surveys and audits performed to a set of agrifood industries located in central region of Portugal (Beira Interior North region), characterizes the energy panorama of agrifood sectors allowing to present the energy performance and GHGs emissions.
The range of values of EI and SEC among sectors is notorious and reveals that companies with the best indexes are able to positioning themselves better in the market. The assessment of the energy consumption and GHGs emissions in agrifood sector reveals the need to continue the research in this topic. Important issues to be analysed are logistics and production strategies, operational actions, as different electrical consumption according to peak hours or changing slightly the temperature in cold rooms without compromising product quality and safety, in order to improve the energy performance of agrifood companies, reduce their GHGs emissions and hence increase their competitiveness. References
[1] J.M. Garcia, L.M.R. Coelho, Energy efficiency strategies in refrigeration systems of large supermarkets, International Journal of Energy and Environment, 4(3) (2010), 63-70.
[2] European Commission, Green Paper - A 2030 framework for climate and energy policies, European Commission, Brussels, 27.3.2013 COM(2013) 169.
[3] E. Gogou, G. Katsaros, E. Derens, L. Li, G. Alvarez, , P. Taoukis, Development and applications of the European Cold Chain Database as a tool for cold chain management, in: 2nd IIR International Conference on Sustainability and the Cold Chain (ICCC 2013), Paris, France, 2-4 April, 2013. [4] M. Eden, C. Colmer, Improved Cold Chain Management: efficiency and food safety through international project results, Food Safety and Technology 24(1) (2010), 30- 32.
[5] J.A. Evans, E.C. Hammond, A.J. Gigiel, A.M. Foster, L. Reinholdt, K. Fikiin, C. Zilio, Assessment of methods to reduce energy consumption of food cold stores, App. Therm Eng. 62(2) (2014), 697–705.
[6] J.A. Evans, A.M. Foster, J.-M. Huet, L. Reinholdt, K. Fikkin, C. Zilio, M. Houska, A. Landfeld, C. Bond, M. Scheurs, T.W.M. van Sambeeck, Specific energy consumption values for various refrigerated cold stores, Energy and Buildings 74 (2014), 141-151.
[7] A.D. Karaman, F. Cobanoglu, R. Tunalioglu, G. Ova, Barriers and benefits of the implementation of food safety management systems among the Turkish dairy industry: A case study, Food Control, 25 (2012) 732-739.
[8] D. Maxime, M. Marcotte, Y. Arcand, Development of eco-efficiency indicators for the Canadian food and beverage industry, Journal of Cleaner Production, 14 (2006) 636-648.
[9] D.C.A. Muller, F.M.A. Marechal, T. Wolewinski, P.J. Roux, An energy management method for the food industry, Applied Thermal Engineering, 27 (2007) 2677-2686.
[10] S. Hennigsson, K. Hyde, A. Smith, M. Campbell, The value of resource efficiency in the food industry: a waste minimisation project in East Anglia, UK, J. of Cleaner Production, 12 (2004) 505-512.
[11] P. Mundler, L. Rumpus, The energy efficiency of local food systems: A comparison between different modes of distribution, Food Policy, 37 (2012) 609-615.
[12] K. Plassmann, A. Norton, N. Attarzadeh, M.P. Jensen, P. Brenton, G. Edwards-Jones, Methodological complexities of product carbon footprinting: a sensitivity analysis of a key variables in a developing country context, Environmental Science & Policy, 13 (2010) 393-404.
[13] C.F. Ruviaro, M. Gianezini, F. S. Brandão, C. A. Winck, Life cycle assessment in Brazilian agriculture facing worldwide trends, Journal of Cleaner Production, 28 (2012) 9-24.
[14] J. Nunes, P.D. Silva, L.P. Andrade, Energetic efficiency evaluation in refrigeration systems of meat industries, in: 23rd International Congress of Refrigeration - ICR 2011, Prague, Czech Republic August 21 – 26, 2011.
[15] R. Santos, J. Nunes, P.D. Silva, P.D. Gaspar, L.P. Andrade, Computational tool for the analysis and simulation of cold room performance in perishable products industry, in: 2nd IIR International Conference on Sustainability and the Cold Chain, Paris, France, April 2-4, 2013.
[16] R. Campos, E. Bastos, P.D. Gaspar, P.D. Silva, Experimental study and numerical modeling of the thermal performance of cold rooms for storage of meat products, in: 8th World Conference on Experimental Heat Transfer, Fluid Mechanics, and Thermodynamics, Lisbon, Portugal, June 16-20, 2013.
[17] J. Nunes, P.D. Silva, L.P. Andrade, P.D. Gaspar, Characterization of specific energy consumption of electricity in the portuguese sausages industry, in: Energy Quest 2014: Energy Production and Management in the 21st Century – The Quest for Sustainable Energy, Ekaterinburg, Russia, April 23 – 25, 2014.
[18] Deloitte, Macroeconomic framework of the Agrifood industry in Portugal, Deloitte Consulting (2012).