UNIVERSIDADE DA BEIRA INTERIOR
Engenharia
Planning of Power Distribution Systems with High
Penetration of Renewable Energy Sources
Using Stochastic Optimization
Sérgio da Fonseca Santos
Tese para obtenção do Grau de Doutor em
Engenharia Electrotécnica e de Computadores
(3º ciclo de estudos)
Orientador: Prof. Doutor João Paulo da Silva Catalão
Co-orientador: Prof. Doutor Carlos Manuel Pereira Cabrita
Co-orientador: Doutor Desta Zahlay Fitiwi
ii
UNIVERSITY OF BEIRA INTERIOR
Engineering
Planning of Power Distribution Systems with High
Penetration of Renewable Energy Sources
Using Stochastic Optimization
Sérgio da Fonseca Santos
Thesis submitted in fulfillment of the requirements for the degree of
Doctor of Philosophy in
Electrical and Computer Engineering
(3
rdcycle of studies)
Supervisor: Prof. Dr. João Paulo da Silva Catalão
(University of Porto)
Co-supervisors: Prof. Dr. Carlos Manuel Pereira Cabrita
(University of Beira Interior)
Dr. Desta Zahlay Fitiwi
(Comillas Pontifical University)
iii
This work was supported by FEDER funds through COMPETE 2020 and by Portuguese funds through FCT, under Projects FCOMP-01-0124-FEDER-020282 (Ref. PTDC/EEA-EEL/118519/2010), POCI-01-0145-FEDER-016434, POCI-01-0145-FEDER-006961, UID/EEA/50014/2013, UID/CEC/50021/2013, and UID/EMS/00151/2013. Also, the research leading to these results has received funding from the EU Seventh Framework Programme FP7/2007-2013 under grant agreement no. 309048. Moreover, Sérgio F. Santos gratefully acknowledges UBI / Santander Totta for the doctoral incentive grant in the Engineering Faculty.
iv
Acknowledgments
Firstly, I would like to express my sincere gratitude to my Ph.D. advisors Prof. João Paulo da Silva Catalão and Prof. Carlos Manuel Pereira Cabrita for the continuous support of my Ph.D. study and related research, for their patience, motivation and immense knowledge. Their guidance helped me at all times during the research and writing of this thesis.
Besides my advisors, I would like to address a special thanks to Dr. Desta Zahlay Fitiwi, my co-advisor and friend, for his trust, support and especially for his insightful comments throughout my studies.
I thank all the co-authors of my works and especially to my closest collaborators, Dr. Miadreza Shafie-khah, Dr. Bizuayehu Abebe Worke, Dr. Nikolaos Paterakis and Dr. Ozan Erdinç. I thank my fellow colleagues in the “Sustainable Energy Systems Lab” for the stimulating discussions and for all their help in the past years.
I also want to thank Eng. Filipe Mendonça, from EDA, S.A. - Eletricidade dos Açores, for his demonstrated availability, for the real data used in the case studies in this thesis, and especially for patiently addressing my urgent requests, always responding so promptly. I would like to thank the European Project FP7 SiNGULAR (Smart and Sustainable Electricity
Grids under Large-Scale Renewable Integration) and the Santander Research Grant from the
Engineering Faculty of UBI, which provided me with economic means to fulfill this Ph.D. Thesis.
Last but not least, I would like to thank my family, especially my parents, and all my friends who have been beside me in the last two years.
v
Resumo
Atualmente há um esforço global para integrar mais recursos energéticos distribuídos nas redes elétricas, impulsionado por fatores técnico-económicos e ambientais, particularmente ao nível da rede de distribuição. Estes recursos incluem tipicamente tecnologias facilitadoras das redes elétricas inteligentes, tais como geração distribuída, sistemas de armazenamento de energia, e gestão ativa da procura.
A integração de fontes de geração distribuída (energias renováveis, principalmente) está a aumentar progressivamente em muitas redes de distribuição, e é provável que esta tendência continue nos próximos anos devido ao avanço de soluções emergentes, esperando-se assim que as limitações técnicas existentes sejam ultrapassadas e que facilitem a integração progressiva das fontes de geração distribuída. Espera-se também que os acordos feitos pelos países para limitar as emissões de gases de efeito de estufa e para mitigar as alterações climáticas acelerem a integração de fontes de energia renováveis.
No entanto, a natureza intermitente e volátil da maioria das fontes de energia renováveis (em particular, eólica e solar) faz com que a sua integração nas redes de distribuição seja uma tarefa complexa. Isto porque tais recursos introduzem variabilidade operacional e incerteza no sistema. Assim, é essencial o desenvolvimento de novas metodologias e ferramentas computacionais inovadoras para beneficiar uma integração óptima da geração distribuída renovável e minimizar os possíveis efeitos colaterais.
Nesta tese são desenvolvidas novas metodologias e ferramentas computacionais inovadoras que consideram a variabilidade operacional e a incerteza associadas à geração a partir de fontes de energia renováveis, juntamente com a integração de tecnologias facilitadoras das redes elétricas inteligentes. As metodologias e ferramentas computacionais desenvolvidas são testadas em casos de estudo reais, bem como em casos de estudo clássicos, demonstrando a sua proficiência computacional comparativamente ao atual estado-da-arte. Devido à inerente incerteza e variabilidade das fontes de energia renováveis, nesta tese utiliza-se programação estocástica. Ainda, para assegurar a convergência para soluções ótimas, o problema é formulado utilizando programação linear inteira-mista.
Palavras Chave
Fontes de energia renováveis; Geração distribuída; Planeamento de investimentos; Programação linear inteira-mista estocástica; Redes elétricas inteligentes; Reforço da rede; Sistemas de armazenamento de energia; Variabilidade e incerteza.
vi
Abstract
Driven by techno-economic and environmental factors, there is a global drive to integrate more distributed energy resources in power systems, particularly at the distribution level. These typically include smart-grid enabling technologies, such as distributed generation (DG), energy storage systems and demand-side management.
Especially, the scale of DG sources (mainly renewables) integrated in many distribution networks is steadily increasing. This trend is more likely to continue in the years to come due to the advent of emerging solutions, which are expected to alleviate existing technical limitations and facilitate smooth integration of DGs. The favorable agreements of countries to limit greenhouse gas (GHG) emissions and mitigate climate change are also expected to accelerate the integration of renewable energy sources (RESs).
However, the intermittent and volatile nature of most of these RESs (particularly, wind and solar) makes their integration in distribution networks a more challenging task. This is because such resources introduce significant operational variability and uncertainty to the system. Hence, the development of novel methodologies and innovative computational tools is crucial to realize an optimal and cost-efficient integration of such DGs, minimizing also their side effects.
Novel methodologies and innovative computational tools are developed in this thesis that take into account the operational variability and uncertainty associated with the RES power generation, along with the integration of smart-grid enabling technologies. The developed methodologies and computational tools are tested in real-life power systems, as well as in standard test systems, demonstrating their computational proficiency when compared with the current state-of-the-art. Due to the inherent uncertainty and variability of RESs, stochastic programming is used in this thesis. Moreover, to ensure convergence and to use efficient off-the-shelf solvers, the problems addressed in this thesis are formulated using a mixed integer linear programming (MILP) approach.
Keywords
Distributed Generation (DG); Energy Storage Systems (ESSs); Investment planning; Network reinforcement; Renewable Energy Sources (RES); Smart grids; Stochastic mixed integer linear programming; Variability and uncertainty.
vii
Contents
Acknowledgments ... iv Resumo ... v Abstract... vi Contents ... viiList of Figures ... xiii
List of Tables ... xv
List of Symbols ... xvii
Relevant Acronyms ... xxv
Chapter 1 ... 1
Introduction ... 1
1.1 Background ... 1
1.2 Research Motivation and Problem Definition ... 5
1.3 Research Questions, Objectives and Contributions of the Thesis ... 6
1.4 Methodology ... 9
1.5 Notation... 9
1.6 Organization of the Thesis ... 9
Chapter 2 ... 12
Renewable Energy Systems: An Overview ... 12
2.1 Introduction ... 12
2.2 Clime Change ... 14
2.3 Renewable Energy Trend ... 15
2.4 Green Energy Production Options ... 16
2.4.1 Wind Energy ... 17 2.4.2 Solar Energy ... 19 2.4.2.1. Solar PV ... 19 2.4.2.2. Solar CSP ... 20 2.4.3 Geothermal Energy ... 22 2.4.4 Hydro Energy ... 24 2.4.5 Bioenergy ... 25 2.4.6 Ocean Energy ... 26
viii
2.5 Economic Aspect of Renewable Energy Systems ... 27
2.5.1 Driving Factors ... 28
2.5.2 Life-Cycle Costs ... 29
2.5.3 Economic Trend of Renewable Energy Systems ... 29
2.6 Benefits and Barriers of RESs ... 31
2.6.1 RES Integration Opportunities ... 31
2.6.2 RES Integration Challenges and Barriers ... 32
2.6.3 Alleviating the Challenges and Barriers ... 34
2.7 Current Trend and Future Prospects... 35
2.8 Chapter Conclusions ... 36
Chapter 3 ... 37
Impact of Operational Variability and Uncertainty on Distributed Generation Investment Planning: A Comprehensive Sensitivity Analysis ... 37
3.1 Introduction ... 37
3.2 Uncertainty and Variability in DGIP ... 40
3.2.1 Terminology ... 40
3.2.2 Sources of Uncertainty and Variability in DGIP ... 41
3.3 Mathematical Model ... 43
3.3.1 Brief Description of the problem ... 43
3.3.2 Objective Function ... 43
3.3.3 Constraints ... 47
3.3.3.1 Load Balance Constraints ... 47
3.3.3.2 Investment Limits ... 47
3.3.3.3 Generation Capacity Limits ... 47
3.3.3.4 Unserved Power Limit ... 48
3.3.3.5 DG Penetration Level Limit ... 48
3.3.3.6 Logical Constraints ... 48
3.3.3.7 Network Model Constraints ... 48
3.3.3.8 Radiality Constraints ... 49
3.4 Case Studies ... 49
ix
3.4.2 Scenario Definition ... 51
3.4.3 Impact of Network Inclusion/Exclusion on DGIP Solution ... 51
3.4.4 Results and Discussion ... 52
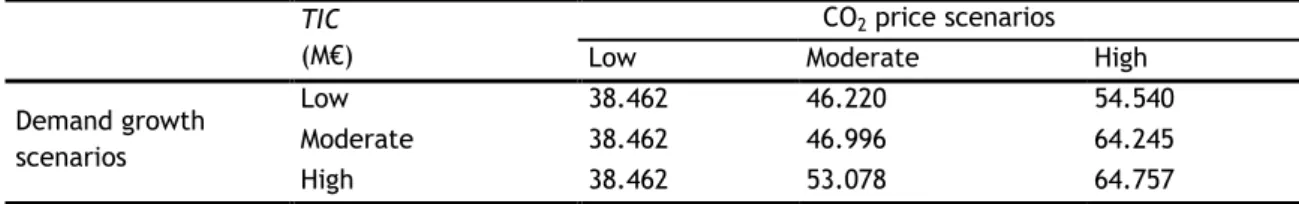
3.4.4.1 Demand Growth and CO2 Price ... 52
3.4.4.2 Interest Rate ... 53
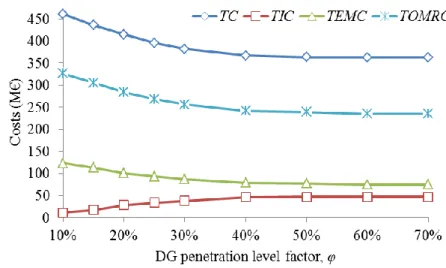
3.4.4.3 DG Penetration Level Factor ... 53
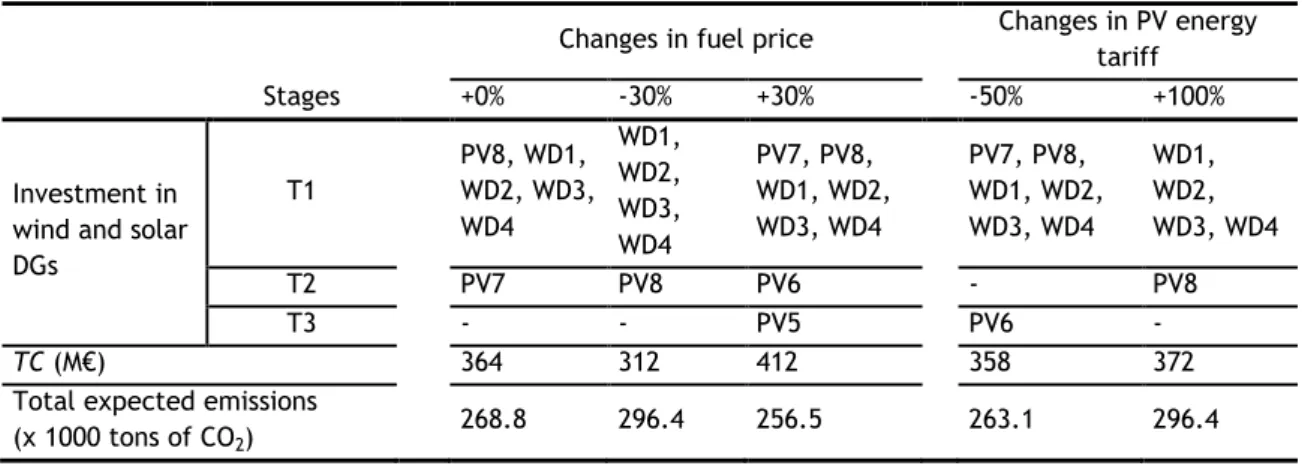
3.4.4.4 Fuel Prices and Electricity Tariffs ... 55
3.4.4.5 Wind and Solar Power Output Uncertainty ... 56
3.4.4.6 Demand and RES Power Output Uncertainty ... 57
3.4.4.7 Generator Availability ... 58
3.5 Chapter Conclusions ... 58
Chapter 4 ... 60
Multi-Stage Stochastic DG Investment Planning with Recourse... 60
4.1 Introduction ... 60
4.2 Modeling Uncertainty and Variability in DGIP ... 61
4.3 Mathematical Model ... 62
4.3.1 Overview and Modeling Assumptions ... 62
4.3.2 Brief Description of the Problem ... 63
4.3.3 Objective Function ... 64
4.3.4 Constraints ... 68
4.3.4.1 Load Balance Constraints ... 68
4.3.4.2 Linear Constraints of Generation Cost ... 68
4.3.4.3 Investment Limits ... 69
4.3.4.4 Generation Capacity Limits ... 69
4.3.4.5 Unserved Power Limit ... 70
4.3.4.6 DG Penetration Limit ... 70
4.3.4.7 Logical Constraints ... 71
4.3.4.8 Network Model Constraints ... 71
4.3.4.9 Radiality Constraints ... 72
4.4 Case Studies ... 73
x
4.4.2 Scenario Definition ... 74
4.4.3 Results and Discussion ... 76
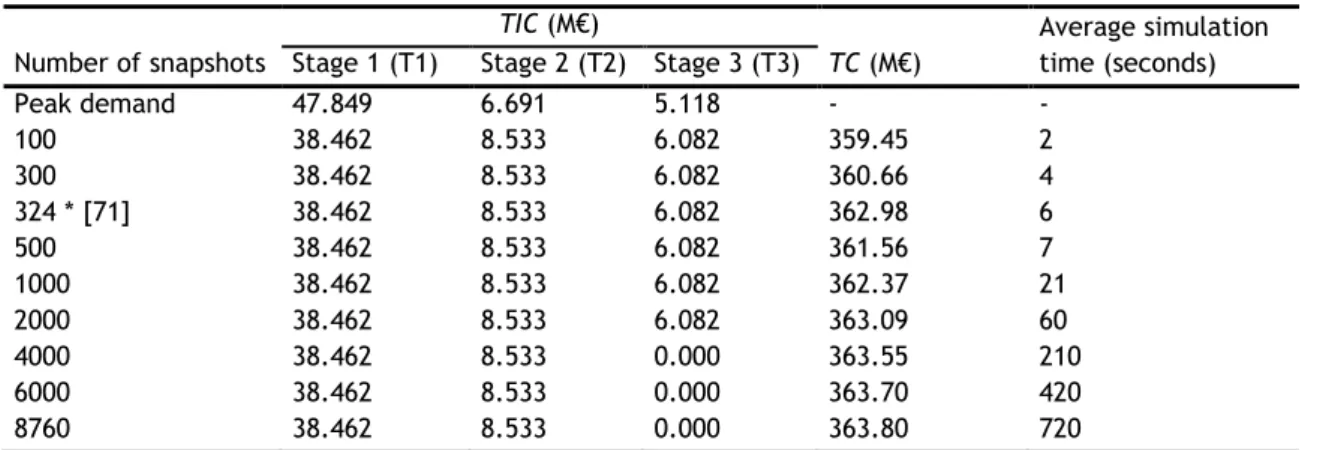
4.4.3.1 Deciding the number of representative clusters ... 77
4.4.3.2 DGIP results ... 78
4.4.3.3 The significance of the proposed models ... 79
4.5 Chapter Conclusions ... 80
Chapter 5 ... 82
Impacts of Optimal Energy Storage Deployment and Network Reconfiguration on Renewable Integration Level in Distribution System ... 82
5.1 Introduction ... 82
5.2 Mathematical Model ... 83
5.2.1 Objective Function ... 83
5.2.2 Constraints ... 87
5.2.2.1 Kirchhoff’s Current Law (Active Power Balances)... 87
5.2.2.2 Energy Storage Model Constraints ... 88
5.2.2.3 Active Power Limits of DGs ... 89
5.2.2.4 Active Power Limits of Power Purchased ... 89
5.2.2.5 Logical Constraints ... 90
5.2.2.6 Radiality Constraints ... 90
5.3 Case Studies ... 91
5.3.1 System Data and Assumptions ... 91
5.3.2 Results and Discussion ... 92
5.4 Chapter Conclusions ... 99
Chapter 6 ... 100
New Multi-stage and Stochastic Mathematical Model for Maximizing RES Hosting Capacity .. 100
6.1 Introduction ... 100
6.2 Uncertainty and Variability Management ... 104
6.3 Mathematical Model ... 106
6.3.1 Brief Description of the Problem ... 106
6.3.2 Objective Function ... 107
xi
6.3.3.1 Kirchhoff’s Voltage Law ... 112
6.3.3.2 Flow Limits ... 114
6.3.3.3 Line Losses ... 116
5.3.3.4 Kirchhoff’s Current Law (Active and Reactive Load Balances) ... 116
6.3.3.5 Bulk Energy Storage Model Constraints ... 117
6.3.3.6 Active and Reactive Power Limits of DGs ... 119
6.3.3.7 Reactive Power Limit of Capacitor Bank ... 120
6.3.3.8 Active and Reactive Power Limits of Power Purchased ... 120
6.3.3.9 Logical Constraints ... 121
6.3.3.10 Radiality Constraints ... 121
6.4 Case Studies ... 123
6.4.1 System Data and Assumptions ... 123
6.4.2 A Strategy for Reducing Combinatorial Solution Search Space ... 125
6.4.3 Results and Discussion ... 128
6.4.3.1 Considering DGs Without Reactive Power Support ... 129
6.4.3.2 Considering DGs With Reactive Power Support ... 138
6.4.3.3 Impact of Wind Turbine and Solar PV Selections on the Results ... 141
6.5 Chapter Conclusions ... 142
Chapter 7 ... 143
Conclusions, Directions for Future Work and Contributions ... 143
7.1 Main Conclusions ... 143
7.2 Directions for Future Works ... 150
7.3 Contributions of the Thesis ... 150
7.3.1 Book Chapters ... 150
7.3.2 Publications in Peer-Reviewed Journals ... 151
7.3.3 Publications in International Conference Proceedings ... 152
Appendices ... 154
Appendix A ... 155
Appendix B ... 156
Appendix C ... 157
xii Appendix E ... 161 Bibliography ... 165
xiii
List of Figures
F
IGURE 1.1 GLOBAL NEW INVESTMENTIN RENEWABLE ENERGY [1]……… 2F
IGURE 1.2 GLOBAL INVESTMENTSIN RENEWABLE ENERGY BY REGION [1]……… 3F
IGURE 1.3 NEW INVESTMENTS IN RENEWABLES ENERGY BY SECTOR (IN BILLIONS OF US DOLLARS) [5] ……… 4F
IGURE 1.4 RENEWABLE POWER GENERATION CAPACITY AS A SHARE OF GLOBAL POWER [1]……… 4F
IGURE 2.1 SUSTAINABILITY IN THE ELECTRICITY SECTOR [17]……… 13F
IGURE 2.2 a) AVERAGE ANNUAL GROWTH RATES OF RENEWABLES (2008 – 2013); b) GLOBAL ELECRICITY PRODUCTION (2013) [20]……… 17F
IGURE 2.3 WIND POWER TOTAL WORLD CAPACITY (2000-2013) [26]……… 18F
IGURE 2.4 FINAL ENERGY CONSUPTION FOR BIOENERGY IN EU [30]……… 26F
IGURE 2.5 DEVELOPMENT AND FUTURE TREND OF GENERATION CAPACITY, DEMAND AND WHOLESALEELECTRICITY MARKET PRICEIN CENTRAL EUROPE FROM 2010 [49]………. 32
F
IGURE 2.6 MAIN REASONSIN THE EU 27 FOR ISSUE “LACKOF COMMUNICATIONS” [50]……… 33F
IGURE 2.7 SOURCES OF OPERATIONAL FLEXIBILITY IN POWER SYSTEMS, ADAPTED FROM [54]………… 35F
IGURE 3.1 ILLUSTRATIONOF VARIABILITY AND UNCERTAINTY IN WIND POWER OUTPUT……… 40F
IGURE 3.2 A SCHEMATIC REPRESENTATION OF (a) POSSIBLE FUTURE SCENARIO’S TRAJECTORIESWITH MULTIPLE SCENARIO SPOTS ALONG THE PLANNING HORIZON, (b) A DECISION STRUCTURE AT EACH STAGE [89]……… 42
F
IGURE 3.3 ILLUSTRATIONOF COST COMPONENTS WITHIN AND OUTSIDE THE PLANNING HORIZON…… 44F
IGURE 3.4 IMPACT OF INTEREST RATE ON DG INVESTMENTS AND ENERGY PRODUCTION FROM WINDAND SOLAR SOURCES……… 53
F
IGURE 3.5 VARIATIONS OF EMISSIONS, INVESTMENT AND EXPECTED SYSTEM COSTS WITH DGPENETRATION LEVEL FACTOR……… 54
F
IGURE 3.6 VARIATION OF DG INVESTMENTS WITH PENETRATION LEVEL AND THEIR EFFECTON TOTALCO2 EMISSIONS……… 55
F
IGURE 4.1 A GRPHICAL ILLUSTRATION OF SCENARIO GENERATION………..……. 62F
IGURE 4.2 A SCHEMATIC REPRESENTATION OF (a) POSSIBLE FUTURE SCENARIO TRAJECTORIES AND(b) A DECISION STRUCTURE [88]………. 64
F
IGURE 4.3 A SAMPLE DEMAND PROFILE FOR DAY 11 IN THE SECOND STAGE (i.e. τ = 2) OF THEFIRST PERIOD, REFLECTING DEMAND GROWTH UNCERTAINTY……… 75
F
IGURE 4.4 WIND AND SOLAR PV POWER OUTPUT UNCERTAINTY CHARACTERIZATION EXAMPLE………. 75F
IGURE 4.5 EFFECTOF SNAPSHOT REDUCTION ON THE INVESTMENT COST………. 77F
IGURE 4.6 EVOLUTION OF EMISSIONS OVER THE PLANNING STAGES………. 79xiv
F
IGURE 4.7 COST OF IGNORING UNCERTAINTY………. 80F
IGURE 5.1 SINGLE LINE DIAGRAM OF THE TEST SYSTEM IN BASE CASE……… 92F
IGURE 5.2 OLTIMAL PLACEMENT AND SIZE OF DGS AND ESSS FOR DIFFERENT CASES (* ONLY IN CASES E AND F)……… 96F
IGURE 5.3 AVERAGE VOLTAGE PROFILES IN THE SYSTEM FOR DIFFERENT CASES……….….… 97F
IGURE 5.4 CUMULATIVE DISTRIBUTION FUNCTION OF AVERAGE VOLTAGES IN THE SYSTEM FORDIFFERENT CASES……….……… 97
F
IGURE 5.5 TOTAL SYSTEM LOSSES PROFILE………. 98F
IGURE 6.1 SINGLE-LINE DIAGRAM OF THE IEEE 41- BUS DISTRIBUTION NETWORK SYSTEM………. 123F
IGURE 6.2 CUMULATIVE DISTRIBUTION FUNCTION (CDF) OF VOLTAGES IN THE BASE CASE………….… 124F
IGURE 6.3 DECISION VARIABLE FOR ESS AT EACH NODE (LAST STAGE)……… 126F
IGURE 6.4 INVESTMENT SOLUTION FOR CAPACITOR BANKS AT EACH NODE (LAST STAGE)………. 126F
IGURE 6.5 INVESTMENT SOLUTION FOR DGs AT EACH NODE (LAST STAGE)………. 127F
IGURE 6.6 PROFILES OF VOLTAGE DEVIATIONS WITHOUT SYSTEM EXPANSION IN THE FIRST STAGE…… 132F
IGURE 6.7 PROFILES OF VOLTAGE DEVIATIONS AT EACH NODE AFTER EXPANSION IN THE FIRST STAGE 132F
IGURE 6.8 VARIANCEOF VOLTAGE DEVIATIONS AT EACH NODEAS A RESULT OF VARIATIONS IN SYSTEMOPERATIONAL STATES………. 133
F
IGURE 6.9 NETWORK LOSSES WITH AND WITHOUT SYSTEM EXPANSION (FIRST STAGE)………. 134F
IGURE 6.10 EVOLUTION OF SOLAR AND WIND ENERGY PRODUCTION SHARE WITH VARYING POWERFACTOR………. 135
F
IGURE 6.11 EVOLUTION OF SOLAR PV ENERGY PRODUCTION SHARE WITH VARYING POWER FACTOR.. 135F
IGURE 6.12 VOLTAGE DEVIATION AT EACH NODE DURING PEAK DEMAND HOUR FOR DIFFERENT POWERFACTOR VALUES………..………. 136
F
IGURE 6.13 VOLTAGE DEVIATION AT EACH NODE DURING VALLEY HOUR FOR DIFFERENT POWERFACTOR VALUES……….……… 137
F
IGURE 6.14 AVERAGE VOLTAGE DEVIATIONS AT EACH NODE FOR DIFFERENT POWER FACTOR VALUES… 137F
IGURE 6.15 EVOLUTION OF WIND AND SOLAR PV ENERGY PRODUCTION SHARE WITH VARYING POWERFACTOR………... 138
F
IGURE 6.16 EVOLUTION OF TOTAL ENERGY AND EMISSION COSTS WITH VARYING POWER FACTOR…… 139F
IGURE 6.17 AVERAGE VOLTAGE DEVIATIONS AT EACH NODE FOR DIFFERENT POWER FACTOR VALUES. 140F
IGURE 6.18 VOLTAGE DEVIATIONS AT EACH NODE DURING VALLEY HOUR FOR DIFFERENT POWERFACTOR VALUES………. 140
F
IGURE 6.19A
VERAGEV
OLTAGED
EVIATIONSATE
ACHN
ODEF
ORD
IFFERENTDG S
IZES……….…… 142xv
List of Tables
TABLE 2.1 RENEWABLE ELECTRIC POWER CAPACITY (TOP REGIONS/COUNTRIESIN 2013) [20]… 17
TABLE 2.2 WIND POWER GLOBAL CAPACITY AND ADDITIONS [20]………. 18
TABLE 2.3 WIND POWER GENERATION TECHNOLOGIES [20]……… 19
TABLE 2.4 SOLAR PV GLOBAL CAPACITY AND ADDITIONS [20]………. 21
TABLE 2.5 SOLAR ENERGY TECHNOLOGIES [20]……….………. 21
TABLE 2.6 CONCENTRATING SOLAR THERMAL POWER (CSP) [20]……… 21
TABLE 2.7 SOLAR (CSP) ENERGY TECHNOLOGIES [20]………. 22
TABLE 2.8 GEOTHERMAL POWER GLOBAL CAPACITY AND ADDITIONS [20]……… 23
TABLE 2.9 GEOTHERMAL POWER ECHNOLOGIES [20]……….……… 23
TABLE 2.10 HYDRO POWER GLOBAL CAPACITY AND ADDITIONS [20]……… 24
TABLE 2.11 HYDRO POWER TECHNOLOGIES [20]……… 25
TABLE 2.12 OCEAN POWER TECHNOLOGIES [20]………. 27
TABLE 3.1 DATA FOR EXISTING GENERATORS………. 50
TABLE 3.2 DATA FOR CANDIDATE GENERATORS………. 50
TABLE 3.3 DEMAND GROW AND CO2 PRICE SCENARIOS………. 51
TABLE 3.4 IMPACT OF DEMAND GROWTH AND CO2 PRICE UNCERTAINTY ON DG INVESTMENTS…… 52
TABLE 3.5 VARIATION OF OBJECTIVE FUNCTION VALUE WITH DEMAND GROWTH AND CO2 PRICE SCENARIOS……… 53
TABLE 3.6 IMPACT OF PRICE AND DG TARIFFS ON DG INVESTMENT DECISIONS……….. 56
TABLE 3.7 IMPACT OF WIND AND SOLAR PV OUTPUT UNCERTAINTY ON DG INVESTMENT DECISIONS………. 56
TABLE 3.8 IMPACT OF SNAPSHOT AGGREGATION ON DG INVESTMENT DECISIONS……… 57
TABLE 4.1 EXPRESSION OF COST COMPONENTS IN THE OBJECTIVE FUNCTION……… 65
TABLE 4.2 DATA FOR EXISTING GENERATORS………. 73
TABLE 4.3 DATA FOR CANDIDATE GENERATORS………. 74
xvi
TABLE 4.5 IMPACT OF SNAPSHOT REDUCTIONON SYSTEM VARIABLES……… 77
TABLE 4.6 DG INVESTMENTS IN EACH STAGE……….…. 78
TABLE 5.1 DISTINGUISHING THE DIFFERENT CASES……… 93
TABLE 5.2 RESULTS OF RELEVANT VARIABLES FOR DIFFERENT CASES………. 94
TABLE 5.3 OPTIMAL SIZES AND LOCATIONS OF DGS AND ESSS FOR DIFFERENT CASES……… 95
TABLE 5.4 TOTAL DGS AND ESSS FOR DIFFERENT CASES……… 96
TABLE 5.5 OPTIMAL RECONFIGURATION OUTCOME FOR DIFFERENT CASES (LIST OF SWITCHES TO BE OPENED)……….……… 98
TABLE 6.1 COMPUTATIONAL SIZE OF THE OPTIMIZATION PROBLEM……… 128
TABLE 6.2 OPTIMAL INVESTMENT SOLUTION OF CAPACITOR BANKS AT THE END OF THE PLANNING HORIZONT……….………. 129
TABLE 6.3 OPTIMAL INVESTMENT SOLUTIONS OF DGs AT THE END OF THE PLANNING HORIZONT 130 TABLE 6.4 OPTIMAL INVESTMENT SOLUTION OF ESS AT THE END OF THE PLANNING HORIZONT…. 130 TABLE 6.5 VALUES OF SYSTEM VARIABLES WITH VARYING POWER FACTOR OF RES-BASED DGs…. 134 TABLE 6.6 VALUES OF SYSTEM VARIABLES WITH VARYING POWER FACTOR OF RES-BASED DGs…. 139 TABLE 6.7 VALUES OF SYSTEM VARIABLES WITH DIFFERENT SIZES OF RES-BASED DGs……… 141
xvii
List of Symbols
The main notations used in Chapters 3, 4 and 5 are listed below. Other symbols are defined where they first appear.
Chapter3
Sets and Indices
𝑘/Ω𝑘 Index/Set of DG alternatives of the same type 𝑚, 𝑛/Ω𝑛 Indices/Set of nodes
𝑝/Ω𝑝 Index/Set of DG types
𝑠/Ω𝑠,𝑤/Ω𝑤 Indices/Sets of scenarios and snapshots, respectively
𝑠𝑠/Ω𝑠𝑠 Index/Set of substations
𝑡/𝛺𝑡 Index/Set of planning stages (t = 1, 2… T)
E Index for existing DGs
N Index for new DGs
SS Substation
T Planning horizon
Parameters
𝑏𝑛𝑚 Susceptance of line 𝑛 − 𝑚 (p.u.)
𝑑𝑛,𝑠,𝑤,𝑡 Electricity demand at each node (MW)
𝐸𝑅𝑝,𝑘𝑁 , 𝐸𝑅𝑝,𝑘𝐸 Emission rate of a new or existing generator (tons of CO2/MWh)
𝑓𝑛𝑚𝑚𝑎𝑥 Flow limit of line 𝑛 − 𝑚 (MW)
𝑔𝑛𝑚 Conductance of line 𝑛 − 𝑚 (p.u.)
𝑖 Interest rate
𝐼𝐶𝑝,𝑘𝑁 Installation cost of DG (€)
𝐼𝑛𝑣𝐿𝑖𝑚𝑡 Available annual budget for investment (€)
𝑀𝐶𝑝,𝑘𝑁 , 𝑀𝐶𝑝,𝑘𝐸 Maintenance cost of new and existing DGs (€), respectively
𝑀𝑛𝑚 Big-M parameter corresponding to line 𝑛 − 𝑚
𝑁𝑛 Number of nodes
𝑁𝑆𝑆 Number of substations
𝑂𝐶𝑝,𝑘𝑁 , 𝑂𝐶𝑝,𝑘𝐸 Operation cost of new and existing DGs (€/MWh), respectively
𝑉𝑛𝑜𝑚𝑖𝑛𝑎𝑙 Nominal voltage of the system (V)
𝜂𝑝,𝑘 Lifetime of DGs (years)
𝜆𝐸𝑀𝐼𝑠,𝑤,𝑡 Emission price (€/tons)
𝜆𝑠,𝑤,𝑡 Average cost of electricity (€/MWh)
𝜋𝑤 Weight associated to representative snapshot w (hours)
𝜌𝑠 Probability of scenario s
xviii 𝜐𝑠,𝑤,𝑡 Penalty for unserved energy (€/MWh)
𝜑 DG penetration limit factor (%)
Variables and Functions
𝑓𝑛𝑚,𝑠,𝑤,𝑡 Power flow through feeder 𝑛 − 𝑚
𝑔𝑝,𝑘,𝑛,𝑠,𝑤,𝑡𝐸 ,𝑔𝑝,𝑘,𝑛,𝑠,𝑤,𝑡𝑁 Power generated by existing and new DG
𝑔𝑠𝑠,𝑠,𝑤,𝑡𝑆𝑆 Power purchased from upstream (grid)
𝑢𝑝,𝑘,𝑛,𝑡𝐸 Utilization indicator variable (1 if an existing generator is utilized; 0
otherwise)
𝑥𝑝,𝑘,𝑛,𝑡𝑁 Binary investment variable for DG
𝑧𝑛𝑚 Binary variable associated to line 𝑛 − 𝑚 (1 if the line is connected; 0
otherwise)
𝐸𝐶𝑡𝐸, 𝐸𝐶𝑡𝑁 Expected cost of energy generated by existing and new DGs (€)
𝐸𝐶𝑡𝑆𝑆 Expected cost of purchased energy (€)
𝐸𝑀𝐶𝑡𝐸, 𝐸𝑀𝐶𝑡𝑁 Expected cost of emissions for existing and new DGs (€)
𝐸𝑁𝑆𝐶𝑡 Expected cost of unserved energy (€)
𝐼𝑛𝑣𝐶𝑡𝑁 Amortized NPV investment cost of DG (€)
𝑀𝑛𝑡𝐶𝑡𝑁, 𝑀𝑛𝑡𝐶𝑡𝐸 Annual maintenance cost of new and existing DGs, respectively (€)
𝛿𝑛,𝑠,𝑤,𝑡 Unserved power (MW)
∆𝑉𝑛,𝑠,𝑤,𝑡 Voltage deviation at each node (kV)
𝜃𝑛𝑚,𝑠,𝑤,𝑡 Voltage angle difference between nodes 𝑛 − 𝑚 (radians)
Chapter 4
Sets and Indices
𝑘/𝛺𝑘 Index/Set for DG alternatives of the same type
𝑙/𝛺𝑙 Index/set for generation cost linearization
𝑛/𝛺𝑛 Index/set of nodes
𝑝/𝛺𝑝 Index/set for DG types
𝑠/𝛺𝑠 Index/set for scenarios
𝑠𝑠/𝛺𝑠𝑠 Index/set for substations
𝑡/𝛺𝑡 Index/set for planning stages (t = 1, 2… T)
𝑤/𝛺𝑤 Index/set for snapshots
N1 DG investment pool in the first period
N2 DG investment pool in the second period 𝛺𝑐 Set of all network corridors
𝜏/𝛺𝑃1; 𝜁/𝛺𝑃2 Indices/Sets of planning stages in periods P1 and P2, respectively
Parameters
xix 𝑑𝑛,𝑠,𝑤,𝑡 Electricity demand at each node (MW)
𝑓𝑛𝑚𝑚𝑎𝑥 Flow limit of line 𝑛 − 𝑚 (MW)
𝑔𝑛𝑚 Conductance of line 𝑛 − 𝑚 (S)
𝑖 Discount rate (%)
𝐸𝑅𝑝,𝑘𝑁 , 𝐸𝑅𝑝,𝑘𝐸 Emission rate of new or existing generator (tons/MWh)
𝐸𝑅𝑠𝑠𝑆𝑆 Emission rate at substation 𝑠𝑠
𝐷𝑠,𝑤,𝑡 Total demand in the system for each scenario, snapshot and year (MW)
𝐺𝑚𝑎𝑥𝑝,𝑘,𝑠,𝑤𝐷𝐺 Maximum generation limits of existing or new DGs (MW), where
𝐷𝐺 ∈ {𝐸, 𝑁}
𝐺𝑚𝑖𝑛𝑝,𝑘,𝑠,𝑤𝐷𝐺 Minimum generation limits of existing or new DG (MW), where 𝐷𝐺 ∈
{𝐸, 𝑁}
𝐼𝐶𝑝,𝑘𝑁 Investment cost of DG (€)
𝐼𝑛𝑣𝐿𝑖𝑚𝑡 Maximum available budget for investment (€)
𝐿 Number of piecewise linear segments
𝑀𝑛𝑚 Big-M parameter corresponding to line 𝑛 − 𝑚
𝑁𝑛 Number of nodes
𝑁𝑆𝑆 Number of substations
𝑀𝐶𝑝,𝑘𝑁 , 𝑀𝐶𝑝,𝑘𝐸 Annual maintenance cost of new or existing DGs (€)
𝑇 Length of the planning horizon 𝑇1 Length of the first investment period 𝑇2 Length of the second investment period 𝑉𝑛𝑜𝑚𝑖𝑛𝑎𝑙 Nominal voltage of the system (kV)
𝛼, 𝛽, 𝛾, 𝜉 Relevance factors of the cost terms 𝜂𝑝,𝑘 Life-time of DG (years)
𝜇𝑠,𝑤,𝑡𝐸𝑀𝐼 Emission price (€/tons)
𝜋𝑤 Weight associated to snapshot w (in hours)
𝜌𝑠 Probability of scenario s
𝜎𝑠𝑠,𝑠,𝑤,𝑡 Price of purchased electricity (€/MWh)
𝜑 DG penetration limit (%)
𝜐𝑠,𝑤,𝑡 Penalty for unserved energy (€/MWh)
𝜅𝑠,𝑤,𝑡 Cost of losses (€/MWh)
Variables and Functions
𝑓𝑛𝑚,𝑠,𝑤,𝑡 Power flow through feeder 𝑛 − 𝑚
𝑔𝑠𝑠,𝑠,𝑤,𝑡𝑆𝑆 Power purchased from upstream (grid)
𝑔𝑝,𝑘,𝑛,𝑠,𝑤,𝑡𝐸 ,𝑔𝑝,𝑘,𝑛,𝑠,𝑤,𝑡𝑁 Power generated by existing or new generator
𝐸𝐶𝑡𝑆𝑆 Expected NPV cost of purchased energy (€)
𝐸𝐶𝑡𝑁, 𝐸𝐶𝑡𝐸 Expected NPV cost of energy production using new and existing DGs (€)
xx 𝐸𝑁𝑆𝐶𝑡 Expected NPV cost of unserved power (€)
𝐼𝑛𝑣𝐶𝑡𝑁 NPV investment cost of DGs (€)
𝐿𝑜𝑠𝑠𝑡 Expected cost of network losses (€)
𝑀𝑛𝑡𝐶𝑡𝑁, 𝑀𝑛𝑡𝐶𝑡𝐸 Expected NPV annual maintenance cost of new and existing DGs,
respectively (€)
𝑂𝐶𝑝,𝑘,𝑠,𝑛𝑤,𝑡𝑁 , 𝑂𝐶𝑝,𝑘,𝑠,𝑛,𝑤,𝑡𝐸 Cost of production using new or existing DGs (€/MWh)
𝑢1𝑝,𝑘,𝑛,𝜏𝐸 Binary variable for indicating the utilization of an existing generator in
the 1st period
𝑢2𝑝,𝑘,𝑛,𝑠,𝜁𝐸 Binary variable for indicating the utilization of an existing generator in
the 2nd period
𝑥𝑝,𝑘,𝑛,𝑡𝑁1 “Here and now” investment variable of DG (in the 1
st period), 0 if not
installed; otherwise, non-zero
𝑥𝑥𝑝,𝑘,𝑛,𝑠,𝑡𝑁1 “Wait and see” (Recourse) investment variable of DG (in the 2nd
period), 0 if not installed; otherwise, non-zero
𝑦𝑝,𝑘,𝑛,𝑠,𝑡𝑁2 Investment variable of DG in the 2nd period, 0 if not installed;
otherwise, non-zero
𝑧𝑛𝑚 Binary utilization variable associated to line 𝑛 − 𝑚
𝛿𝑛,𝑠,𝑤,𝑡 Unserved power (MW)
𝜆𝐸𝑝,𝑘,𝑛,𝑠,𝑤,𝑡,𝑙 SOS2 variable in generation cost curve linearization of existing DGs
𝜆𝑁1𝑝,𝑘,𝑛,𝑠,𝑤,𝑡,𝑙 SOS2 variable for piecewise linearization of generation cost curve of
new DGs in the first pool
𝜆𝑁2𝑝,𝑘,𝑛,𝑠,𝑤,𝜁,𝑙 SOS2 variable for piecewise linearization of generation cost curve of
new DGs in the second pool
∆𝑉𝑛,𝑠,𝑤,𝑡 Voltage deviation at each node (kV)
𝜃𝑛𝑚,𝑠,𝑤,𝑡 Voltage angle difference between nodes 𝑛 − 𝑚 (radians)
Chapter 5
Sets/Indices
𝑔/𝛺𝑔/ 𝛺𝐷𝐺 Index/set of generators/DGs
𝑘/𝛺𝑘 Index/set of branches
𝑠/𝛺𝑠 Index/set of scenarios
𝑡/𝛺𝑡 Index/set of time stages
𝑤/𝛺𝑤 Index/set of snapshots
𝜍/𝛺𝜍 Index/set of substations
Parameters
𝐸𝑅𝑔𝐸, 𝐸𝑅𝑔𝑁, 𝐸𝑅𝜍𝑆𝑆 Emission rates of existing and new DGs, and energy purchased,
xxi 𝐼𝐶𝑔,𝑖, 𝐼𝐶𝑘, 𝐼𝐶𝑡𝑟, 𝐼𝐶𝑒𝑠,𝑖 Investment cost of DG, line, transformer and energy storage, respectively
(M€)
𝐿𝑇𝑒𝑠, 𝐿𝑇𝑔, 𝐿𝑇𝑘, 𝐿𝑇𝑡𝑟 Lifetimes of energy storage, DG, distribution line, and transformer
system, respectively (years)
𝑀𝐶𝑒𝑠𝐸, 𝑀𝐶𝑒𝑠𝑁 Maintenance cost of existing / new storage per year (M€)
𝑀𝐶𝑔𝐸, 𝑀𝐶𝑔𝑁 Maintenance costs of existing and new DGs (M€/yr)
𝑀𝐶𝑘𝑁, 𝑀𝐶𝑘𝐸 Maintenance cost of new and existing line (M€/yr)
𝑀𝐶𝑡𝑟𝑁, 𝑀𝐶𝑡𝑟𝐸 Maintenance cost of new/existing transformer per year (M€)
𝑂𝐶𝑔,𝑖,𝑠,𝑤,𝑡𝐸 , 𝑂𝐶𝑔,𝑖,𝑠,𝑤,𝑡𝑁 Operation cost of unit energy production by existing and new DGs
(€/MWh)
𝜂𝑐ℎ,𝑒𝑠, 𝜂𝑑𝑐ℎ,𝑒𝑠 Charging/discharging efficiency
𝜆𝑠,𝑤,𝑡
𝐶𝑂2𝑒 Price of emissions (€/tons of CO
2 equivalent)
𝜆𝑒𝑠𝑠,𝑤,𝑡 Variable cost of energy storage (€/MWh)
𝜆𝜍𝑠,𝑤,𝑡 Price of electricity purchased (€/MWh) 𝜇𝑒𝑠 Scaling factor
𝜌𝑠, 𝜋𝑤 Probability of scenario s and weight (in hours) of snapshot group w
𝜐𝑠,𝑤,𝑡 Penalty for unserved power (€/MW)
Variables
𝐷𝑠,𝑤,𝑡𝑖 Active power demand at node i (MW)
𝐸𝑒𝑠,𝑖,𝑠,𝑤,𝑡 Reservoir level of ESS (MWh)
𝐼𝑒𝑠,𝑖,𝑠,𝑤,𝑡𝑐ℎ , 𝐼𝑒𝑠,𝑖,𝑠,𝑤,𝑡𝑑𝑐ℎ Charging/discharging indicator variables
𝑃𝑒𝑠,𝑖,𝑠,𝑤,𝑡𝑐ℎ , 𝑃𝑒𝑠,𝑖,𝑠,𝑤,𝑡𝑑𝑐ℎ Charged/discharged power (MW)
𝑃𝑔,𝑖,𝑠,𝑤,𝑡𝐸 , 𝑃𝑔,𝑖,𝑠,𝑤,𝑡𝑁 Active power produced by existing and new DGs (MW)
𝑃𝑘,𝑠,𝑤,𝑡 Power flow through branch k (MW)
𝑃𝜍,𝑠,𝑤,𝑡𝑆𝑆 Active power imported from grid (MW)
𝑢𝑔,𝑖,𝑡, 𝑢𝑘,𝑡 Utilization variables of existing DG and lines
𝑥𝑔,𝑖,𝑡, 𝑥𝑒𝑠,𝑖,𝑡, 𝑥𝑘,𝑡, 𝑥𝑡𝑟,𝑠𝑠,𝑡 Investment variables for DG, storage systems, transformer and
distribution lines, respectively 𝛿𝑖,𝑠,𝑤,𝑡 Unserved power at node i (MW)
𝜑𝑘,𝑠,𝑤,𝑡 Losses associated to each feeder (MW)
Functions
𝐸𝐶𝑡𝐷𝐺 Expected cost of energy from DGs (M€)
𝐸𝐶𝑡𝐸𝑆 Expected cost of energy from energy storage (M€)
𝐸𝐶𝑡𝑆𝑆 Expected cost of energy purchased from upstream (M€)
xxii 𝐸𝑚𝑖𝐶𝑡𝑁, 𝐸𝑚𝑖𝐶𝑡𝐸 Expected emission cost of power production using new and existing DGs,
respectively (M€)
𝐸𝑚𝑖𝐶𝑡𝑆𝑆 Expected emission cost of purchased power (M€)
𝐸𝑁𝑆𝐶𝑡 Expected cost of unserved power (M€)
𝐼𝑛𝑣𝐶𝑡𝐷𝑁𝑆, 𝑀𝑛𝑡𝐶𝑡𝐷𝑁𝑆 NPV investment/maintenance cost of DNS components (M€)
Chapter 6
Sets/Indices
𝑐/Ω𝑐 Index/set of capacitor banks
𝑒𝑠/Ω𝑒𝑠 Index/set of energy storages
𝑖/Ω𝑖 Index/set of buses
𝑔/Ω𝑔/ Ω𝐷𝐺 Index/set of DGs
𝑘/Ω𝑘 Index/set of branches
𝑠/Ω𝑠 Index/set of scenarios
𝑡/Ω𝑡 Index/set of time stages
𝑤/Ω𝑤 Index/set of snapshots
𝜍/Ω𝜍 Index/set of substations
Parameters
𝐶𝑖𝑗 Cost of branch i-j (€)
𝐸𝑒𝑠,𝑖𝑚𝑖𝑛, 𝐸𝑒𝑠,𝑖𝑚𝑎𝑥 Energy storage limits (MWh)
𝐸𝑅𝑔𝑁, 𝐸𝑅𝑔𝐸, 𝐸𝑅𝜍𝑆𝑆 Emission rates of new and existing DGs, and energy purchased at
sub-stations, respectively (tons of CO2 equivalent—tCO2e/MWh)
𝑔𝑘, 𝑏𝑘, 𝑆𝑘𝑚𝑎𝑥 Conductance, susceptance and flow limit of branch k (Ω, Ω, MVA)
𝐼𝐶𝑔,𝑖, 𝐼𝐶𝑘, 𝐼𝐶𝑒𝑠,𝑖, 𝐼𝐶𝑐,𝑖 Investment cost of DG, line, energy storage system and capacitor banks,
respectively (€)
𝐿 Total number of linear segments (€)
𝐿𝑇𝑔, 𝐿𝑇𝑘, 𝐿𝑇𝑒𝑠,𝐿𝑇𝑐 Lifetimes of DG, line, energy storage system and capacitor banks,
respectively (years)
𝑀𝐶𝑐, 𝑀𝐶𝑒𝑠 Maintenance cost of capacitor bank and energy storage system per year
(€)
𝑀𝐶𝑔𝑁, 𝑀𝐶𝑔𝐸 Maintenance costs of new and existing DGs per year (€)
𝑀𝐶𝑘𝑁, 𝑀𝐶𝑘𝐸 Maintenance costs of new and existing branch k per year (€)
𝑀𝑃𝑘, 𝑀𝑄𝑘 Big-M parameters associated to active and reactive power flows through
branch k, respectively (€)
𝑁𝑖, 𝑁𝜍 Number of buses and substations, respectively
𝑂𝐶𝑔,𝑖,𝑠,𝑤,𝑡𝑁 , 𝑂𝐶𝑔,𝑖,𝑠,𝑤,𝑡𝐸 Operation cost of unit energy production by new and existing DGs
(€/MWh)
xxiii 𝑃𝑠𝑜𝑙,ℎ Hourly solar PV output (MW)
𝑃𝑟 Rated power of a DG unit (MW)
𝑃𝑤𝑛𝑑,ℎ Hourly wind power output (MW)
𝑄𝑐0 Rating of minimum capacitor bank
𝑅𝑐 A certain radiation point (often taken to be 150 W/m2)
𝑅ℎ Hourly solar radiation (W/m2)
𝑟𝑘, 𝑥𝑘 Resistance and reactance of branch k, respectively
𝑅𝑠𝑡𝑑 Solar radiation in standard condition (usually set to 1000 W/m2)
𝑣𝑐𝑖 Cut-in wind speed (m/s)
𝑣𝑐𝑜 Cut-out wind speed (m/s)
𝑣ℎ Observed/sampled hourly wind speed (m/s)
𝑉𝑛𝑜𝑚 Nominal voltage (kV)
𝑣𝑟 Rated wind speed (m/s)
𝑍𝑖𝑗 Impedance of branch i-j (Ω)
𝛼𝑙, 𝛽𝑙 Slopes of linear segments
𝜂𝑒𝑠𝑐ℎ, 𝜂𝑒𝑠𝑑𝑐ℎ Charging and discharging efficiencies of a storage system (%)
𝜆𝑠,𝑤,𝑡
𝐶𝑂2𝑒 Price of emissions (€/tCO 2e)
𝜆𝑑𝑐ℎ𝑒𝑠,𝑖,𝑠,𝑤,𝑡 Cost of energy discharged from storage system (€/MWh)
𝜆𝜍𝑠,𝑤,𝑡 Price of electricity purchased from upstream (€/MWh)
𝜌𝑠, 𝜋𝑤 Probability of scenario s and weight (in hours) of snapshot group w
𝜐𝑠,𝑤,𝑡 Penalty for unserved power (€/MWh)
Variables
𝐷𝑠,𝑤,𝑡𝑖 , 𝑄𝑠,𝑤,𝑡𝑖 Active and reactive power demand at node i (MW, MVAr)
𝐸𝑒𝑠,𝑖,𝑠,𝑤,𝑡 Stored energy (MWh)
𝐼𝑒𝑠,𝑖,𝑠,𝑤,𝑡𝑐ℎ , 𝐼𝑒𝑠,𝑖,𝑠,𝑤,𝑡𝑑𝑐ℎ Charge-discharge indicator variables
𝑃𝑔,𝑖,𝑠,𝑤,𝑡𝑁 , 𝑃𝑔,𝑖,𝑠,𝑤,𝑡𝐸 Active power produced by new and existing DGs (MW)
𝑃𝜍,𝑠,𝑤,𝑡𝑆𝑆 , 𝑄𝜍,𝑠,𝑤,𝑡𝑆𝑆 Active and reactive power imported from grid (MW)
𝑃𝑘, 𝑄𝑘, 𝜃𝑘 Active and reactive power flows, and voltage angle difference of link k,
respectively (MW, MVAr, radians)
𝑝𝑘,𝑠,𝑤,𝑡,𝑙, 𝑞𝑘,𝑠,𝑤,𝑡,𝑙 Step variables used in linearization of quadratic flows (MW, MVAr)
𝑃𝐿𝑘, 𝑄𝐿𝑘 Active and reactive power losses, respectively (MW, MVAr)
𝑃𝐿𝜍,𝑠,𝑤,𝑡, 𝑄𝐿𝜍,𝑠,𝑤,𝑡 Active and reactive losses at substation 𝜍 (MW, MVAr)
𝑃𝑒𝑠,𝑖,𝑠,𝑤,𝑡𝑐ℎ , 𝑃𝑒𝑠,𝑖,𝑠,𝑤,𝑡𝑑𝑐ℎ Power charged to and discharged from storage system (MW)
𝑄𝑖,𝑠,𝑤,𝑡𝑐 Reactive power injected by capacitor bank at node i (MVAr)
𝑄𝑔,𝑖,𝑠,𝑤,𝑡𝑁 , 𝑄𝑔,𝑖,𝑠,𝑤,𝑡𝐸 Reactive power consumed/produced by new and existing DGs (MVAr)
𝑢𝑔,𝑖,𝑡, 𝑢𝑘,𝑡 Utilization (status) variables of DG and line (1 if it is connected; 0,
xxiv 𝑉𝑖, 𝑉𝑗 Voltage magnitudes at nodes i and j (kV)
𝑥𝑔,𝑖,𝑡, 𝑥𝑒𝑠,𝑖,𝑡, 𝑥𝑐,𝑖,𝑡, 𝑥𝑘,𝑡 Investment variables for DG, energy storage system, capacitor banks and
distribution lines
𝛿𝑖,𝑠,𝑤,𝑡 Unserved power at node i (MW)
𝜃𝑖, 𝜃𝑗 Voltage angles at nodes i and j (radians)
Functions
𝐸𝐶𝑡𝑆𝑆 Expected cost of energy purchased from upstream (€)
𝐸𝑁𝑆𝐶𝑡 Expected cost of unserved power (€)
𝐸𝑚𝑖𝐶𝑡𝐷𝐺 Expected emission cost of power production using DG (€)
𝐸𝑚𝑖𝐶𝑡𝑁, 𝐸𝑚𝑖𝐶𝑡𝐸 Expected emission cost of power production using new and existing DGs,
respectively (€)
𝐸𝑚𝑖𝐶𝑡𝑆𝑆 Expected emission cost of purchased power (€)
𝐼𝑛𝑣𝐶𝑡𝐶𝐴𝑃, 𝑀𝑛𝑡𝐶𝑡
𝐶𝑎𝑝 NPV investment/maintenance cost of capacitor banks (€)
𝐼𝑛𝑣𝐶𝑡𝐷𝐺, 𝑀𝑛𝑡𝐶𝑡𝐷𝐺, 𝐸𝐶𝑡𝐷𝐺 NPV investment/maintenance/expected energy cost of DGs, respectively
(€)
𝐼𝑛𝑣𝐶𝑡𝐸𝑆, 𝑀𝑛𝑡𝐶𝑡𝐸𝑆, 𝐸𝐶𝑡𝐸𝑆 NPV investment/ maintenance/ expected energy cost of an energy
storage system, respectively (€)
xxv
Relevant Acronyms
AC Alternating Current
BRICS Brazil, Russia, India, China, South Africa CIU Cost of Ignoring Uncertainty
CO2 Carbon Dioxide
COE Cost of Energy
CSP Concentrated Solar Power
DC Direct Current
DERs Distributed Energy Resources DG Distributed Generation
DGIP Distributed Generation Investment Planning DNSs Distribution Network Systems
DSO Distribution System Operator
ECIU Expected Cost of Ignoring Uncertainty
EU European Union
EVPI Expected value of perfect information GAMS General Algebraic Modelling System
GHG Greenhouse Gas
IEA International Energy Agency
IREN International Renewable Energy Agency LCOE Levelized Costs of Electricity
MILP Mixed Integer Linear Programming
NOx Nitrogen Oxide
NPV Net Present Value
OMR Operation, Maintenance and Reliability
OM&ENS Operation, Maintenance and Energy Not Served PDFs Probability Distribution Functions
PV Solar Photovoltaic Power RESs Renewable Energy Sources
S-MILP Stochastic Mixed Integer Linear Programming SOS2 Special Ordered Sets of type 2
SOx Sulphur Oxide
TEMC Total Emissions Cost TIC Total Investment Cost TLC Total Losses Cost
TOMRC Total Operation, Maintenance and Reliability Cost TOMUEC Total Operation, Maintenance and Unserved Energy Cost TSOs Transmission System Operators
xxvi
US United States
1
Chapter 1
Introduction
1.1 Background
Electrical energy is one of the most important factors in today's modern societies, specifically the relationship with a complex energy system that eases transportation, allows the manufacture of consumer products and facilitates the dissemination of information and knowledge through the media. The energy in modern societies provides comfort, well-being, security and leisure to the society.
The vast majority of the energy consumed today in the societies comes from non-sustainable energy sources, also called conventional energy sources. Conventional energy sources constitute fossil fuels such as coal, natural gas and refined petroleum products and nuclear power. Only a small part of the energy produced in the world comes from renewables, often called unconventional energy sources.
Renewable energy sources (RESs) include solar, hydro, wind, biomass, geothermal power or tidal energy. The fact that most of the energy used nowadays comes from conventional sources raises several concerns, especially in relation to energy dependence, security, affordability and sustainability. Such concerns are leading to the current perspective of large-scale RES integration, which is one of the most important trends in the electrical systems around the world.
RESs have enormous potential because, in principle, they can meet several times the world’s energy demand [1]. They can provide sustainable energy services because of the vast availability of such resources, wide-spread across the globe. Thus, it is now widely recognized that the integration of RESs brings a lot of benefits to all electric system stakeholders from economic, environmental, social and/or technical perspectives.
RES integration can increase the electricity markets diversification, contributing to the realization of a long-term sustainable energy strategy, and the much needed reduction of GHG emissions locally and globally by reducing the carbon footprint of power generation using conventional means.
Generally, there is a global consensus on climate change mitigation and limiting GHG emissions that along with energy dependence, security and other structural issues are forcing states to create new market policies and introduce new energy policies (policies related to RES, in particular) that support the development and utilization of RESs.
2 The integration of RESs in electrical systems (particularly, at distribution levels) is expected to accelerate as a result of the agreements of several countries [2] to limit the emissions and mitigate climate change. The level of distributed generation (DG) introduced in distribution systems follows an upward trend, and it is generally acknowledged that DGs will contribute immensely to the effort of resolving most of the aforementioned concerns both globally and locally, including the realization of RES integration goals set forth by different entities [3]. The availability of several mature DG technologies and their decreasing trend of costs, along with the complicated nature of building new transmission lines, the increasing demand for greater reliability of supply, among others, has encouraged significant investment in DGs (particularly in the renewable type, such as wind and solar).
As already mentioned, the integration of RESs in power systems has been growing since 2005 in a gradual and sustainable manner [4]. So far, the renewable energy investment targets, including climate change policies and improved cost-competitiveness, have been sufficient to allow the steady growth of global electricity production share of RESs at the expense of polluting power sources. A very high renewable investment was recorded in 2011 buoyed by the different initiatives such as "green stimulus" in Germany and Italians’ solar roofs [3]. However, in 2015, RES investment showed a 5% increase compared to 2014 as shown in Figure 1.1. It can be seen in Figure 1.1 that the total investment in 2015 was six times the value recorded in 2004. For the first time in 2015, the amount of investment increased and overall RES generation capacity added in developing countries exceeded that of the developed economies [1]. The developing countries that contributed most to such a significant increase were China, India and Brazil, whose combined investment surged by 19% compared to 2014. In particular, China contributed most (approximately 17%) to this achievement, by aggressively investing in renewables. In India and Brazil, the net increases in RES investment in 2015 with reference to 2014 are over 22% and 10%, respectively.
Figure 1.1 - Global overview of new investments in renewable energy [1]
.
53 83 108 123 114 164 191 151 136 142 130 20 29 46 60 64 75 87 106 98 131 156 73 112 154 182 179 239 279 257 234 273 286 0 50 100 150 200 250 300 350 2005 2006 2007 2008 2009 2010 2011 2012 2013 2014 2015 Bil ion s of U S dol la rs World total Developed countries Other developing countries World total
3 The developing countries that contributed most to such a significant increase were China, India and Brazil, whose combined investment surged by 19% compared to 2014. In particular, China contributed most (approximately 17%) to this achievement, by aggressively investing in renewables. In India and Brazil, the net increases in RES investment in 2015 with reference to 2014 are over 22% and 10%, respectively. Other countries that also made significant investments in 2015 were South Africa (329% compared to 2014) as well as Mexico and Chile whose investments in 2015 increased by 105% and 151% compared to 2014, respectively. All together, they are the top 10 countries that have invested more in renewable energy in 2015 along with Morocco, Uruguay, the Philippines, Pakistan and Honduras. Investments can be clearly seen in Figure 1.2, which shows the renewable investment trajectories by country and/or region. In comparison, RES investments in Europe fell by 21%, despite the wind energy financing record of 17 billion US dollars, an increase of 11%. In the United States, investments increased by 19%, two thirds of which were in solar energy.
Among the several renewable energy types, the one that saw significant growth was the large-scale hydro. However, excluding this one, it can be seen that from all renewable energy sources, wind and solar were the ones that attracted the highest investments in 2015 (constituting 62 and 56 GW of new installed capacity, respectively), well above the 2014 values. In Figure 1.3, one can see the new investments in renewable energy by sector, and it appears that, for the first time, investment in solar energy was higher than that of any other renewable type (excluding large-scale hydro).
In 2015, although there was a new record, the generation capacity (Figure 1.4) added is far from what would be desired to address the current global challenges, mentioned earlier. The United Nations conference in Paris on climate change, known as COP21, generated an unprecedented agreement among 195 countries to achieve zero emissions in the second half of the century [2]. Thus, the large-scale integration of renewable energy sources (especially, in distribution systems) will require significant investments in infrastructures.
4
Figure 1.3 – New investments in renewable energy by sector (in billions of US dollars) [5].
Figure 1.4 – Renewable power generation capacity as a share of global power [1].
However, large-scale integration of RES-based DGs often poses a number of technical challenges in the system from the stability, reliability and power quality perspectives. This is because integrating RESs introduces significant operational variability and uncertainty to the distribution system, making operation, planning and control rather complicated.
Solar 2,4 Biofuels 0,5 Wind;0,4 Geothermal 0,01 Small Hydro 0,03 Biomass 0,07 Marine 0,03 19,5% 27,3% 41,7% 31,6% 39,8% 48,6% 40,2% 49,0% 53,6% 7,5% 8,2% 9,2% 10,2% 11,4% 12,7% 13,8% 15,2% 16,2% 5,2% 5,3% 5,9% 6,1% 6,9% 7,8% 8,5% 9,1% 10,3% 0,0% 10,0% 20,0% 30,0% 40,0% 50,0% 60,0% 2007 2008 2009 2010 2011 2012 2013 2014 2015 Renewable capacity change as a % of globalcapacity change (net) Renewable power as a % of global power capacity renewable power as a % of global power generation
5 Hence, such a high-level integration effort is likely to be supported by certain smart-grid technologies and concepts that have the capability to enhance the flexibility of the entire distribution systems. Energy Storage Systems (ESSs) can play a vital role in integrating variable energy sources. In addition, a dynamic Reconfiguration of Distribution Systems (RDS) can be very important because it can considerably enhance the flexibility of the system and voltage profiles, thereby increasing chances of accommodating large-scale RES power.
1.2 Research Motivation and Problem Definition
As demonstrated in the background,
RESs make a crucial part of the solution for environmental sustainability; hence, they will play an important role in power systems. The integration of RESs should, in principle, reduce the risk of fuel price volatility and geopolitical pressures and ensure that these do not pose a significant impact on the overall public welfare. However, large-scale penetration of RESs will necessarily involve a process of adapting and changing the existing infrastructure because of their intrinsic characteristics, such as intermittency and variability.The growing need for intermittent RESs, in conjunction with the electrical mix changes in the long-term, will probably affect the distribution and transmission systems. In this context, a change in power generation options, resulting from a high contribution of RESs, may require network grid updates. Regulatory agencies are heavily committed to increasing RES integration, not only due to environmental but also technical and economic reasons, as explained in the previous section.
The main challenge with most RESs is their inherent variability and uncertainty, making operation, control and planning very complicated. DG penetration increases the variation of voltage and current in the network. Hence, increasing DG penetration may have a negative or a positive impact depending on various factors such as the size of the system and the loads type, requiring comprehensive modeling and simulations to assess its impact. If not properly planned, this may lead to an uncertain increase in the feeders’ power flows, resulting in network congestion and increased losses in the network. It is in this context that the first two problems, addressed in this thesis, appear.
The integration of smart-grid enabling technologies has the capability to alleviate the negative consequences of large-scale integration of DGs. In other words, in order to facilitate (speed up) the much-needed transformation of conventional (passive) Distribution Network Systems (DNSs) and support large-scale RES integration, different smart-grid enabling technologies such as reactive power sources, advanced switching and storage devices are expected to be massively deployed in the short-term.
6 The integration of Energy Storage Systems (ESSs) along with RESs has become one of the most viable solutions to facilitate the increased penetration of DG resources. Energy storage systems “level” the mismatch between renewable power generation and demand. This is because these devices store energy during periods of low electricity demand (price) or high RES power production, and then release it during periods of peak demand and low RES production. Therefore, in addition to their technical support to the system, ESSs bring substantial benefits for end-users and DG owners through reliability and power quality improvement as well as cost reduction. Besides, ESSs are being developed and applied in power grids to cope with a number of issues such as smoothing the energy output from RESs and improving the stability of the electrical system. ESSs also increase savings during peak hours and minimize the impact of intermittent generation sources, leading to a more efficient management of the integrated system. Despite the high capital costs of many ESS technologies, their deployment in distribution systems is in the upward trend. Cost-cutting and the strong need of integrating RES-based DGs is expected to push the demand for the simultaneous deployment of ESSs in distribution network systems. In other words, distributed ESSs will increase dramatically in the years to come. Hence, proper planning of such systems is crucial for a healthy operation of the system as a whole.
Electrical distribution systems are interconnected by switches but predominantly operated radially. These switches are often used for emergency purposes such as to evade load curtailment during fault cases. However, the system can be reconfigured to find the best topology that minimizes power losses in the system and improve operational performance. This in turn improves the flexibility in the system, which may help to accommodate (absorb) more variable power. Investigating the capability of network switching and/or expansion along with ESS deployment in RES integration level is another problem addressed in this thesis. Generally, this thesis develops strategies, methods and tools that are very crucial to guide such a complex decision-making process, i.e. maximizing the penetration level of RESs in DNSs without jeopardizing the power quality, system stability and integrity.
1.3 Research Questions, Objectives and Contributions of the
Thesis
This thesis presents a comprehensive analysis of DG investment planning decisions (renewables in particular). New analysis tools and methods are developed in this thesis that take into account the operational variability and uncertainty associated with the RES power generation along with the integration of smart-grid enabling technologies. The ultimate aim of all this is to enable existing systems to accommodate large-scale variable energy sources (wind and solar type DGs in particular) while maintaining the power quality and system stability at the required/standard levels at a minimum possible cost.
7 In particular, the following research questions are addressed:
What is the current status of RES penetration across the world (with a special focus at distribution levels)? What are the main impeding factors for RES integration? How can the potential benefits of RESs be reaped without significant negative consequences?
What are the parameters of uncertainty and/or variability that most influence the decision-making process in terms of investment solutions in DGs (especially, renewables)?
How should different sources of uncertainty be modeled in the complex decision-making problem concerning DG investment planning?
From a quantitative and qualitative point of view, what are the impacts of network switching and/or reinforcement, as well as deployment of ESSs on the level of renewable power integrated in the system?
How can the penetration of renewable energy sources in the power distribution system be maximized with currently available technologies?
o What is the effect of reactive power support capability on the RES-based DG
integration level?
o What are the implications of integrating smart-grid enabling technologies in
the distribution systems with respect to maximizing RES integration, reducing energy losses, costs and improving voltage profiles?
The main objectives of this thesis are:
To carry out a state-of-the-art review on the current status of RES penetration across the world (with a particular focus at distribution levels), their economic aspects, current integration challenges and future prospects, and other related issues.
To develop appropriate optimization models and methods for planning distribution systems under uncertainty and large-scale penetration of variable energy sources.
To perform a comprehensive analysis with the aim of identifying the stochastic parameters that most influence the decision-making process in terms of investment solutions in DGs (especially, renewables).
To develop methods for handling the most significant sources of uncertainty in the complex decision-making problem concerning DG investment planning.
8
To investigate the impacts of network switching and/or reinforcement, as well as deployment of ESSs on the level of renewable power integrated in the system.
To develop mechanisms for maximizing the penetration level of variable energy sources in the power distribution systems with the help of currently available technologies.
To optimally deploy smart-grid enabling technologies in the distribution systems, and investigate the implications in terms of RES-based integration level and overall system performance.
The contributions of this thesis (all already published in prestigious venues) are summarized as follows:
An overview on RESs and the underlying issues related to the RES theme such as climate change and its mitigation, RES characteristics and technological aspects, the most important economic aspects as well as the challenges and opportunities of integrating RESs in power systems. This contribution is published in the form of a
Book Chapter in ELSEVIER [6].
The development of an improved multi-stage and multi-scenario DG investment planning mathematical formulation that investigates the effect of uncertainty and operational variability on DG investment solutions. This contribution is published in the IEEE Transactions on Sustainable Energy [7].
The development of a two-period planning framework that combines both robust short-term and strategic medium to long-term decisions in dynamic and stochastic DG investment problems. This contribution is published in the IEEE Transactions on
Sustainable Energy [8].
The development of a multi-stage and stochastic model, which considers simultaneous integration of ESSs and RES-based DGs as well as network reconfiguration/reinforcement. This contribution is published in Applied Energy –
ELSEVIER [9].
The presentation of a novel approach which simultaneously considers the optimal sizing, time and placement integration of smart-grid enabling technologies to support a large-scale RES-based DG integration. A comprehensive analysis of considering RES based DGs with and without reactive power support capabilities is also included. This contribution is published in the IEEE Transactions on Sustainable Energy,
9
1.4 Methodology
The mathematical models developed in this thesis are based on well-established methods, namely, mixed-integer linear programming (MILP), multi-objective optimization and two-period stochastic programming. In order to achieve the main research objective, beyond simulation models, this thesis develops methods and solution strategies to analyze the expansion planning of DNSs under uncertainty, and a dramatically changing power generation scheme over time.
The proposed optimization models and the solutions strategies are implemented in GAMS© and solved in most cases using the CPLEX™ algorithm, mostly by invoking default parameters. The clustering methodology is implemented in the MATLAB© programming environment, and Visual Basic™ with Excel© used as an interface for this purpose.
1.5 Notation
The present thesis uses the notation commonly used in the scientific literature, harmonizing the common aspects in all sections, wherever possible. However, whenever necessary, in each section, a suitable notation may be used. The mathematical formulas will be identified with reference to the subsection in which they appear and not in a sequential manner throughout the thesis, restarting them whenever a new section or subsection is created. Moreover, figures and tables will be identified with reference to the section in which they are inserted and not in a sequential manner throughout the thesis.
Mathematical formulas are identified by parentheses (x.x.x) and called “Equation (x.x.x)” and references are identified by square brackets [xx]. The acronyms used in this thesis are structured under synthesis of names and technical information coming from both the Portuguese or English languages, as accepted in the technical and scientific community.
1.6 Organization of the Thesis
The thesis comprises seven chapters which are organized as follows:
Chapter 1 is the introductory chapter of the thesis. First, the background of the thesis is presented. Then, the research motivations and the problem definition are provided. Subsequently, the research questions and contributions of this thesis are presented. Then, the methodology used throughout the thesis is introduced, followed by the adopted notations. Finally, the chapter concludes by outlining the structure of the thesis.
10 In Chapter 2, a comprehensive overview of RES is presented. First, RESs are framed in the climate change perspective, followed by a renewable energy trend. Then, the green energy production options are presented and the individual characterization in recent years of each one is made jointly with the respective technologies. Subsequently, the most important economic aspects on RESs to be considered when investing in this type of technology are presented. Finally, the benefits and RES integration barriers as well the present/future perspectives are discussed.
In Chapter 3, a DG investment planning model is formulated as a novel multi-stage and multi-scenario optimization problem, in order to perform a comprehensive sensitivity analysis and identify the uncertain parameters which significantly influence the decision-making in distributed generation investments and quantify their degree of influence. A real–world distribution network system is used to carry out the analysis.
Taking the findings of the analysis in Chapter 3 as input, a detailed model is developed to guide the complex decisions-making process of DG investment planning in distribution system in the face of uncertainty. This is presented in Chapter 4. The problem is formulated from a coordinated system planning viewpoint, in which the net present value of costs rated to losses, emission, operation and maintenance, as well as the cost of unserved energy are simultaneously minimized. The formulation is anchored on a two-period planning horizon, each having multiple stages. The operational variability and uncertainty introduced by intermittent generation sources, electricity demand, emission prices, demand growth and others are accounted for via probabilistic and stochastic methods, respectively. Metrics such as cost of ignoring uncertainty and value of perfect information are used to clearly demonstrate the benefits of the proposed stochastic model.
Chapter 5 presents a novel mechanism to quantify the impacts of network switching and/or reinforcement as well as deployment of ESSs on the level of renewable power integrated in the system. To carry out this analysis, a dynamic and multi-objective stochastic mixed integer linear programming (S-MILP) model is developed, which jointly takes the optimal deployment of RES-based DGs and ESSs into account in coordination with distribution network reinforcement and/or reconfiguration.
A new multi-stage and stochastic mathematical model, developed to support the decision-making process of planning distribution network systems (DNSs) for integrating large-scale “clean” energy sources is presented in Chapter 6. Another aim of this chapter is to examine the theoretical aspects and mathematical formulation in a comprehensive manner. The proposed model is formulated from the system operator’s viewpoint, and determines the optimal sizing, timing and placement of distributed energy technologies (particularly, renewables) in coordination with some enabling technologies. Moreover, heuristic strategies for reducing the combinatorial solution search space in relation to the optimal placement of DGs, ESSs and reactive power sources are investigated.
11 Chapter 7 presents the main conclusions of this work. Guidelines for future works in these fields of research are provided. Moreover, this chapter reports the scientific contributions that resulted from this research work and that have been published in journals with high impact factor (first quartile), as book chapters or in conference proceedings of high standard (IEEE).
![Figure 1.4 – Renewable power generation capacity as a share of global power [1].](https://thumb-eu.123doks.com/thumbv2/123dok_br/18881038.932513/30.892.293.638.108.499/figure-renewable-power-generation-capacity-share-global-power.webp)
![Table 2.3 - Wind Power Generation Technologies [20]](https://thumb-eu.123doks.com/thumbv2/123dok_br/18881038.932513/45.892.141.799.880.1105/table-wind-power-generation-technologies.webp)
![Figure 2.5 - Development and future trend of generation capacity, demand and wholesale electricity market price in Central Europe from 2010 [49]](https://thumb-eu.123doks.com/thumbv2/123dok_br/18881038.932513/58.892.264.683.869.1106/figure-development-generation-capacity-wholesale-electricity-central-europe.webp)
![Figure 2.6 - Main reasons in the EU 27 for issue “Lack of communication” [50].](https://thumb-eu.123doks.com/thumbv2/123dok_br/18881038.932513/59.892.222.717.671.1120/figure-main-reasons-eu-issue-lack-communication.webp)
![Figure 2.7 - Sources of Operational flexibility in power systems, adapted from [54].](https://thumb-eu.123doks.com/thumbv2/123dok_br/18881038.932513/61.892.174.776.683.1104/figure-sources-operational-flexibility-power-systems-adapted.webp)