MASTERS IN FINANCE
MASTERS FINAL WORK PROJECT
EQUITY RESEARCH – JERÓNIMO MARTINS
Vasco Miguel Pereira da Silva Nobre
MASTERS IN FINANCE
MASTERS FINAL WORK PROJECT
EQUITY RESEARCH – JERÓNIMO MARTINS
Vasco Miguel Pereira da Silva Nobre
Supervisor: Prof. Ana Isabel Ortega Venâncio
i
Acknowledgements
This challenge is an achievement of a long-standing dream and as such would not have been possible without the help of all those who were present.
To my supervisor Ana Venâncio, my deeply gratitude for the constructive evaluations, guidance and support, before this tremendous challenge.
To my family a big thank you, especially, my parents and my brother who give me the possibility and the opportunity of completing my master's degree and the constant support and motivation.
To my girlfriend, Ana Rita, who has always been present since my graduation and help me to overcome all my goals.
ii
Abstract
Jerónimo Martins is an international retail group based in Portugal, operating in the food distribution and specialized on retail field. The company occupies a leading market position in all the countries where the group operates due to value creation and sustainable development strategies.
The objective of this study is to determine the enterprise and equity values of Jerónimo Martins Group, by developing an equity report.
For that purpose, we analyze the company’s performance alongside its growth perspective and all other factors that have a significant impact on the operational outcome. The methods used to value the company where the Discounted Cash-Flow model, more specifically, the Flow to Equity model because the weight of debt in firm’s capital structure is not significant. As a robustness check, we use other Discounted Cash-Flow models and Relative Valuation. In addition, we perform a Monte Carlo simulation to evaluate the risk of the valuation.
We estimate that Jerónimo Martin’s enterprise value is between 9.290 € million and 16.231€ million, corresponding to a price target between 13.2 € and 25 €, which represent a decrease of 20% compared with the stock price at 14 of October 2017. The Relative Valuation estimates a price target of 10.15 €.
We recommend the investors to sell their stock of Jerónimo Martins Group.
Keywords: Equity research; Jerónimo Martins; Firm valuation; Equity value; Discounted
iii
Resumo
Jerónimo Martins é um grupo de retalho internacional com sede em Portugal que atua no setor de Distribuição Alimentar e no Retalho especializado. A empresa ocupa uma posição de mercado líder em todos os países onde o grupo atua devido às estratégias de criação de valor e desenvolvimento sustentável.
O objetivo deste estudo é avaliar o valor das ações do Grupo Jerónimo Martins e calcular o valor da empresa. Para alcançar uma conclusão, foi realizado um relatório de equity
research.
Para este efeito, nós analisamos o desempenho da empresa juntamente com as perspetivas de crescimento e todos os outros fatores que têm um impacto significativo no resultado operacional. Os métodos utilizados para avaliar a empresa são Flow to Equity (FTE) e os múltiplos comparáveis, visto que o peso da dívida em relação às vendas é reduzido. Tratando-se de uma análise robusta, usámos outros modelos Discount Cash-Flow, bem como a Relative Valuation. Adicionalmente, realizámos uma simulação Monte Carlo para avaliar o risco de avaliação.
Nós estimamos que o valor da empresa da JM se encontra entre de 9.290 milhões de euros e 16.231 milhões de euros, correspondente a um valor de 13.2 € e 25€ por ação, que representa uma queda de quase 20% quando comparado com o valor real das ações a 14 de outubro de 2017.
Recomendamos os investidores a vender as suas ações do Grupo Jerónimo Martins.
Palavras-chave: Equity research; Jerónimo Martins; Firm valuation; Equity value;
iv List of contents Acknowledgements ... i Abstract ... ii Resumo ... iii List of figures ... vi List of tables ... vi
List of Abbreviations ... viii
1. Introduction ... 1
2. Literature review... 3
2.1. The importance of firm valuation ... 3
2.2. Valuation methods ... 3
2.2.1. Discounted Cash-Flow (DCF) ... 4
2.2.2. Contingent Claim Valuation ... 6
2.2.3. Assed Based Valuation ... 7
2.2.4. Relative Valuation ... 7
3. Company overview ... 9
3.1. History ... 9
3.2. Strategy and operations ... 10
3.3. Economic and financial performance ... 12
3.4. Future strategies ... 17
4. Business risks and opportunities... 18
4.1. Macroeconomic framework ... 18
4.2. Sector framework ... 21
4.3. Strategic analysis ... 22
4.4. Industry ... 23
5. Valuation ... 24
5.1. Discounted Cash Flow Method ... 24
5.1.1. Cost of equity ... 24
5.1.2. Revenues assumptions ... 26
5.1.3. EBITDA assumptions ... 27
5.1.4. Capital Expenditures and Depreciations Assumptions ... 28
5.1.5. Changes in Working Capital Assumptions ... 30
5.1.6. Tax Rate Assumptions ... 31
5.2. Firm value ... 31
6. Robustness Check ... 33
v
8 Risk Factors ... 36
9. Relative Valuation ... 38
9.1. Peer Group Analysis ... 40
10. Conclusions ... 42
vi
List of figures
Figure 1- JM Distribution of Sales 2012 – 2016 ... 12
Figure 2- JM Revenues and number of Stores between 2012 and 2016 ... 15
Figure 3- Jerónimo Martins Stock Prices ... 17
Figure 4- Portugal GDP Annual Growth Rate... 19
Figure 5- Poland GDP Annual Growth Rate ... 20
Figure 6- Colombia GDP Annual Growth Rate ... 20
Figure 7- Risk-free rate of Germany government bonds 10 years maturity ... 25
Figure 8 – Monte Carlo Simulation, Price Target ... 34
Figure 9 – Peer Group Market Share. ... 41
List of tables Table I - Methods used in valuation ... 4
Table II - Multiples ... 8
Table III - JM Business Unit Sales ... 10
Table IV - JM Operations Sales by business segments ... 11
Table V - JM Main Indicators of Consolidated Income Statement 2012 – 2016 ... 13
Table VI - Jerónimo Martins Financial Statement Consolidated 2012 – 2016 ... 16
Table VII - SWOT Analysis ... 23
Table VIII - Equity Risk Premium ... 25
Table IX - Cost of Equity (Re) ... 26
Table X - Revenues ... 27
Table XI - Assumption ... 28
vii
Table XIII - Gross fixed assets and CapEx ... 29
Table XIV - Depreciations, amortizations, provisions and impairment ... 29
Table XV - Working Capital Assets ... 30
Table XVI - Working Capital Liabilities ... 30
Table XVII - Net Working Capital ... 31
Table XVIII - Free Cash Flow to Equity ... 31
Table XIX - FCFE Price Target ... 32
Table XX - JM Re and g of Capex Sensitivity Analysis ... 33
Table XXI - Inputs of Monte Carlo Simulation ... 34
Table XXII - Multiples, Price to Earnings (PER) ... 38
Table XXIII - Multiples, Price to Book – Value (PBV) ... 38
Table XXIV - Multiples, Price to Sale (PS) ... 39
Table XXV – Peer Group Market Share and Stock Price ... 40
viii
List of Abbreviations
APV – Adjusted Present Value CAPEX – Capital Expenditures CAPM – Capital Asset Pricing Model CDS – Credit Default Swap
D – Net Debt
DCF – Discounted Cash Flow
DDM – Dividend Discount Model E – Equity EBIT – Earnings Before Interests and Taxes
EBITDA – Earnings Before Interests, Taxes, Depreciation and Amortization EPS – Earnings per Shares
EV – Enterprise Value EU – European Union
EVA – Economic Value Added FCFE – Free Cash Flow to Equity FCFF – Free Cash Flow to Firm G – Growth Perpetuity Rate GDP – Gross Domestic Product JM – Jerónimo Martins
PBV – Price to Book Value PEG – Price/Earnings to Growth PER – Price/Earnings ratio PSR – Price/Sales
PTC – Production Tax Credits PV – Present Value
ix Source 𝑅𝑓 – Risk free rate
SWOT – Strengths, Weaknesses, Opportunities and Threats T – Marginal tax rate
1
1. Introduction
Jerónimo Martins (JM) is an international group leader whose business focus in food distribution and specialized retail in three different countries, Portugal, Poland and Colombia. The main goal of the company’s is to provide quality services by reinforcing the price competition, satisfying the expectations of their stakeholders and at the same time contributing for the sustainable development in the regions where the company operates.
In terms of performance, JM group has increased their value continually, especially between 2012 and 2016, when JM opened their first store in Colombia and reinforced their present in Portugal in Poland. By the end of 2016, JM had more than 3550 stores, of which 221 are located in Colombia. The revenues have been increasing reaching a total of €14.610 million in 2016. This was only possible due to its strategy based on Corporate Responsibility, Value Creation and Sustainable Development.
In this study, we perform an equity research to evaluate the enterprise value of JM, as well as the intrinsic value of its stocks. To this end, we analyze the business performance, the financial data, opportunities and risks of the firm.
We apply the Discounted Cash Flow (DCF) model, more specifically the Flow to Equity (FTE) model. We choose this method because the revenues are constantly growing and the debt represents a small fraction of the capital structure of the firm. As a robustness check, we apply the Weighted Average Cost (WACC) model and the Relative Valuation by comparing the JM with its peers. Additionally, we perform a Monte Carlo Simulation to understand the main drivers of growth.
At 14 October of 2017 JM stock price was € 15.760, we recommend that the investors should sell their stocks, since we considered the prediction of € 13.2 more realistic.
2
This equity research follows the following structure : the next section presents the literature review appealing to the importance of valuation and valuations models; section three analyzes JM’s economics and financial performance; section four identifies the business risks and opportunities that the company may face in long run; section five presents the valuation methodologies and the assumptions; the last section concludes the equity research and presents the recommendation to the investors.
3
2. Literature review
2.1. The importance of firm valuation
Valuation “lives” in the heart of finance (Damodaran, 2006). It can be described as the process to calculate the impact of a company’s strategies and policies on value creation (Fernandez, 2007).
Despite the several types of valuation, there are three factors that affect the firm value: risk, cash and timing. For Luehrman (1997), managers who want to perform a valuation, they need to value opportunities, operations and ownership claims. According to Goedhart et al (2010) to create value the company must focus on market opportunities and assess the industry sector where it operates. However, valuation not only includes objective factors but also subjective and contingent factors (Neves, 2002).
The key role of valuation, as Fernandez (2007) stated, is to estimate the firm value and its stock price and with these results recommend investors to sell, buy or hold their stocks. Luehrman (1997) refers that valuation is not only used by financial analysts but also by managers to determine the future strategies and resources decisions.
2.2. Valuation methods
In valuation, we must select the methods more appropriate for the company being valued. As stated by Damodaran (2006 and 2012), the methods are divided into four groups: Discounted Cash Flows (DFC), Relative Valuation, Contingent Claim Valuation and Asset Based Valuation (Table I).
4
Table I
Methods used in valuation
Source: Damodaran (2006 and 2012)
2.2.1. Discounted Cash-Flow (DCF)
Discounted Cash Flows (DCF) is one group of methods that estimates the intrinsic value of an asset as a function of the future cash flow generated by the asset and not how much it is worth it. The cash-flows are then discounted at a rate that describes their risk (Damodaran 2006, Goedhart et al, 2005; Fernandez, 2007). The DCF method are the most flexible and accurate methods. These methods are not only used to value firms but also used to value other financial assets and have an important role calculating the Initial Public Offering (IPO) price. They provide the initial price of the firm and their stock price (Luehrman, 1998).
In the finance literature, there are several Discounted Cash Flows methods. We will focus on the most used models: Equity Valuation Models and Firm Valuation Models (Damodaran, 2006).
The models used in Equity Valuation are Dividend Discounted Model (DDM) and Flow to Equity. Both models consider only the value to the equity investors and the cash flows are discounted by the rate that best suitable for the equity risk of the firm, in other words, the cost of equity (Damodaran, 2006; Fernández, 2005)
The Dividend Discounted Model (DDM) is the oldest approach and it is relevant for firms that pay a constant growing dividend (Foerster, Sapp, 2005; Farrel, 1985), however, the
5
main disadvantage of this method is its variability with the inputs (Damodaran, 2002). Williams (1938) was the first to find that there was a connection between the value of the shares and its dividends. The theory was created by Durant (1957) subsequent analyzed by Gordon (1962) who created the Gordon Growth model. Flow to Equity Model (FTE) is not a radical departure from the DDM, the different is that the FTE model considers all the potentials dividends. Not only it includes the distributed dividends but also the dividends that the company created and did not distributed. As Steiger (2008) state, this model is only suitable for the equity holders. This model is usually used to value financial institutions and help in decision in shareholders restructuring. In both cases is important to follow a close approach of mutual evaluation of operational and financial decisions (Goedhart et al 2005a). In the FTE model, the firm has low levels of debt and it assumes that they will not vary much over time (Damodaran, 2006).
The Firm Valuation, Models estimates the value the whole company by analyzing all the cash flows related to shareholders and creditors and discounting them at the appropriate cost of capital (Damodaran 2006). The most used models are Weighted Average Cost of Capital (WACC) model, Adjusted Present Value (APV) model and Economic Value Added (EVA) model. These models are based on the Free Cash-Flow to the Firm (FCFF), which is described as the amount of operating cash flow remaining after reinvestments (Fernández, 2007), or the amount of cash that the company has after reinvestments or operations (Brealey et al. 2006). The cash flows equal the operating earnings, after taxes, and after the necessary reinvestments, and before paying any debs (Damodaran, 2006; Fernández, 2002 and 2007). The value of the firm is calculated by dividing the cash flows result by Weighted Average Cost of Capital (WACC) rate (Sabal, 2005; Luehrman 1997b). According to several authors, the WACC model should only be used by companies that aim for a debt-to-capital ratio constant over time (Damodaran, 2002 and
6
2006; Fernández, 2002; Miles & Ezzell, 1980). Goedhart et al (2005a) state that this model should be used when valuating firms with several businesses and in valuating of investments projects. The EVA model, as Damodaran (2006) describes, it an example of excess return model, which results from the investments made. In other words, EVA is used by companies to estimate the value to the shareholders by calculating the residual and performance income of their investments (Brealy et al, 2008).
The APV model, like the WACC model, values the overall business. Myers (1974) was the first to discover this model. Since the APV model is one of the most direct, flexible, trustfully and versatile models (Luehrman, 1997), the managers can use this model to understand and analyze the value of firm in a different perspective. To calculate the APV model, we must compute the tax shield. As Sabal (2007) state, the tax shield should be estimated period-by period, which would make the result more trustworthy, so having a constant tax rate, as in the WACC model, is no longer the better option. However, Damodaran (2006) considers that the APV model has several disadvantages such as the accuracy of the assumptions, the tax shield can only be computed for profitable company (Brealey & Myers, 1996).
2.2.2. Contingent Claim Valuation
Contingent Claim Valuation uses the option pricing models such as the Black-Scholes model and the Binomial Pricing model (Damodaran, 2012). The use of this method in company valuation, helps the firms to predicts the value of certain opportunities that the company can take in the future. However, some authors consider that the contingent claim valuation is costly and less intuitive and the final value can have more estimation errors than the DCF models (Damodaran, 2012; Luehrman, 1997a). Nevertheless, Copeland and
7
Keenan (1998) refer that besides all the problems, the option pricing models are a better tool than the DCF model.
2.2.3. Assed Based Valuation
Asset Based valuation calculates the company’s value through the value of its own assets (Fernández, 2007).
In this method, there are three types of valuation. The first is Liquidation Value, which is the sale profits of the assets hold by the company. The second is, as Meitner (2006) state, the Replacement Cost that represents the cost to substitute all the assets that a firm has today. The third type is the Book Value, which evaluates the value of the company by the accounting value of its assets (Damodaran, 2012). The disadvantage of using the asset based valuation is that this method does not considers the future evolution of the company or the markets, they only can determinate the value of the company in a certain moment in time (Damodaran, 2006; Fernández, 2002).
2.2.4. Relative Valuation
The Relative Valuation model values a company based on the values of similar company in the market (Damodaran, 2006 and 2012).
This method is divided in three steps. The first step is to search for companies that work in the same industrial areas or sector, with similar risk, growth expectations and same cash flows level as the company in question. The second step is to use the research on market prices and make a system that can produce unique variable prices that can be
8
comparable. The third and last step is to adapt the system to differences across the companies.
The Relative Valuation model assumes that the markets are efficient. This is the easier model and it provides a faster estimate of the value of the company. However, it is only possible to compute this model if there are enough comparable firms. Nevertheless, as Damodaran (2006) states, the definition of a comparable company is subjective. In fact, it depends in the assumptions used. For this reason, this method is used as a complement or a second phase to the DFC model (Goedhart et al, 2005b; Fernández, 2007). According to Fernández (2013), the principal and most common used multiples are divided into three groups. Table II presents the multiples.
Table II Multiples
Source: Fernández (2013)
The choice of the most adequate multiples depends on the specific characteristics of the company and the market where the company operates (Fernández, 2013; Lie, 2002). However, Liu et al (2002) consider that the multiples evaluate different levels of performance. This implies that a company should choose several multiples to better describe and evaluate the different levels of performance.
9
3. Company overview
Jerónimo Martins (JM) operates in the food distribution and specialized retail. JM has more than 3550 stores located in three countries: Portugal, Colombia and Poland.
3.1. History
In 1792, JM was created and opened a single mini market in the center of Lisbon. After 186 years and different owners, in 1978, the owners of JM made one of the most important decision of the company, entering the modern food distribution in Portugal with the creation of Pingo Doce. Pingo Doce stores were opened in 1980. In 1989, the JM group dispersed 15% of their shares in the NYSE Euronext Lisbon through a Public Offer for Sale, since then, the value has increased and about 35% of their capital is dispersed in the market.
The internationalization began in Poland, in 1994, with the purchase of cash and carry Eurocash in Poland. Shortly after the purchase, the process “Biedronka” was on the move. Nowadays, is the largest supermarket chain in Poland.
In 2011, the group announced a new destiny for their internationalization, Colombia. Only in 2013, the firm opened the first stores with the name of Ara.
Between 2012 and 2015, JM saw the financial crisis as an opportunity to change their strategies points and reinforce their market position in Poland and investing in Colombia. In 2013, JM stock price reached a maximum value of €18.47.
10
In 2016, JM counts with more than 3550 stores, which 221 corresponds the total number of stores in Colombia, a stronger market present in Portugal and in Poland, reaching 14.610 million in revenues.
3.2. Strategy and operations
The core business of JM includes the business segments: retail and wholesale (food distribution) and specialized retail concepts.
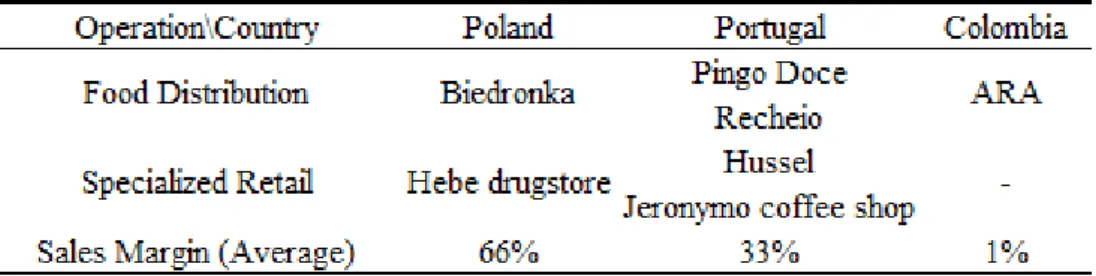
In the retail segment, JM is leader with the insignias Pingo Doce in Portugal and Biedronka in Poland, Retail is also composed by ARA stores in Colombia. JM plans to expand the ARA stores in the near future.
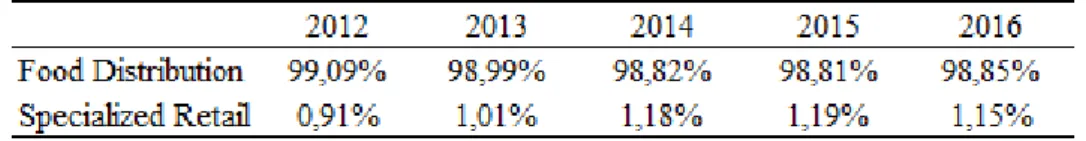
In the wholesale segment, JM operates through Recheio, which represent almost 20% of the sales in 2016 just in Portugal and 6% of total sales. In terms of sales, the retail and wholesale segment contributes almost with 98.85% of the total sales, see Table IV. In the specialized retail concepts segment, JM operates through the concepts: Hussel and Jeronymo coffee shop, both implemented in Portugal, and Hebe drugstore, created in Poland. This segment has a marginal contribution for the total sales of the group.
Table III presents the JM business segments and insignias.
Table III JM Business Unit Sales
11
Table IV represents the evaluation of sales by operation between 2012 and 2016.
Table IV
JM Operations Sales by business segments
Source: JM
JM’s strategy relies on three axes: Corporate Responsibility, Value Creation and Sustainable Development. Corporate Responsibility is based on the improvement of the quality of life in the regions where the group has business, with the task of suppling healthy food products and more solutions, fighting for human rights and working conditions, preservation of natural resources and reassuring a more cohesive and balanced social fabric, based on the actual financial situation of the countries where JM operates. In Value Creation, JM strategies rely on balance sheet strength, risk management, economies of scale and synergies and innovation to gain competitive advantages. However, the main objective of these aspects is to achieve the leading position in every country where JM operates. JM also focus on the development of the current and new chains and brand and a constant growth of the business units, in terms of sales and margins. To reach these objectives, JM group is following several lines of action. They include improve operational efficiency, identify new opportunities for a profitable growth, incorporate technological updates and a reinforce lead in turns of price competitiveness. In terms of price, JM strategy relies on the brand reputation in the quality-price of their products, which represent an advantage compared with rival companies, Furthermore, JM strategy for expansion is based on the increased of stores, especially in Colombia.
12
Sustainable Development is based on involving the social and environment concerns into the value chain, in order to reach a sustainable development, JM defined several priority commitments such as promoting health through food, supporting the surrounding communities and respect the environment of the communities in the regions where JM operates.
3.3. Economic and financial performance
The focus of JM growth was in Food Distribution with operations in Portugal, Poland and Colombia. The Figure 1 presents JM Distribution of sales from 2012 until 2016. In 2016, Poland was the country with the major value with 68% of JM total output and since 2012, the output in Poland as increase constantly. In 2016, Portugal had a total of 31%, however, since 2012, the output from Portugal as decreased a total of 6%, the remaining output had part in Colombia with only a total of 2% which is expected since the first stored to open in Colombia was in 2013.
Figure 1- JM Distribution of Sales 2012 – 2016 Source: JM Poland Portugal Colombia 0,0% 20,0% 40,0% 60,0% 80,0% 2012 2013 2014 2015 2016 Poland 63,3% 65,6% 67,2% 67,8% 67,7% Portugal 36,7% 34,2% 32,3% 31,3% 30,7% Colombia 0,0% 0,2% 0,5% 0,9% 1,6%
13
The Table V presents the JM main indicators from the income statements since 2012 to 2016. According to the table, the total revenues in 2016 increased by 6,51% as a result of a growth in all business areas, in particular, the growth in 6.25% of Biedronka. In 2013, the total revenues had a deceleration due to inflations, deceleration of economic growth and the change of the customer patterns. In term of EBITDA, in 2014 JM had decrease of almost 6% caused by a high level of food deflation in Portugal, Poland and the impact of new investment in Colombia and in Poland, ARA and Hebe, respectively. In 2016, due to a continuation of high level of food deflation and a significantly increase of personnel costs in Portugal and in Poland, the EBITDA only increased 7.78% compared to the results obtained in 2015-2014 which was 9.06%. Jerónimo Martins Earning Before Interests and Taxes (EBIT) in the first two years, 2012 and 2013, as an increase tendency, however, between 2013 and 2014, the value of EBIT dropped significantly, which may be due to the increase of operational costs. Between 2014 and 2016 the EBIT shown an increase tendency due to the increase of sales and services. Net Profit, in 2014, contracted by 17% in comparison with the value in 2013, this contract was mainly due to the increase of operational cost, in 2016 the net profit increase almost 10% due to sales growth, balance sheet solidity and cost control.
Table V
JM Main Indicators of Consolidated Income Statement 2012 – 2016
Source: JM
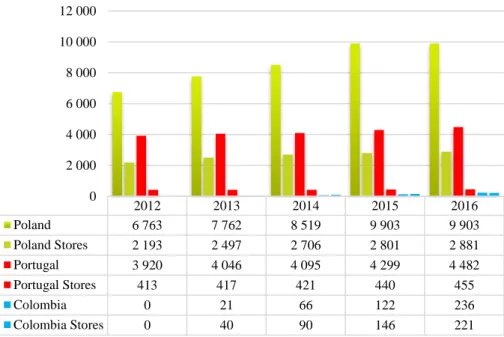
The Figure 2 represents JM’s revenues between 2012 and 2016.
Thus, in Portugal, the revenues increased by 1.2% in 2014 versus 3.21% in 2013, This difference is due to high level of food deflation especially in the second and third quarter.
14
JM kept their strategies of quality and variety of products and achieved a 1.7% of total revenues and a 1.2% like-to-like. In 2016 and 2015, the revenues increased by 4.26% and 4.89% obtain in 2015, respectively. This increase was possible due to the competitive of food retail strategy promotions relying in. In terms of revenues, Pingo-Doce had an increase of 4.4% and a like-for-like of 1.2% in relation to 2015 while, Recheio had a revenues growth of 5.9% in relation to 2015.
In Poland, the revenues registered an increase of 9.75% in 2014 versus 14.7% in 2013, this different is due to food deflation of 0.9%, besides the investment in 194 new stores. The increase in sales, the like-for-like had a negative value of 0.8% but in terms of volume sales, Poland recorded a gradual improvement over the quarters. In 2016, it occurred a deceleration in revenues of 6.42% comparing to 9.24% in 2015. Beside this different, the like-for-like recorded a growth in almost 10% with influence of negative inflation. The almost 6.5% growth in revenues was due to an increase in Poland minimum wage, a new allowance for family with more than one children and with constant innovations in market approach.
Colombia account for a small position of JM consolidated total revenues. In 2013, ARA accounts of 0.2%. In 2014, the revenues increase to 66 million, a growth of 214%. In 2016, ARA closed the year with a revenue of 236 million which represents a total growth of 93%, this growth was mainly due to an increase in the number of stores.
15
Figure 2- JM Revenues and number of Stores between 2012 and 2016 Source- JM
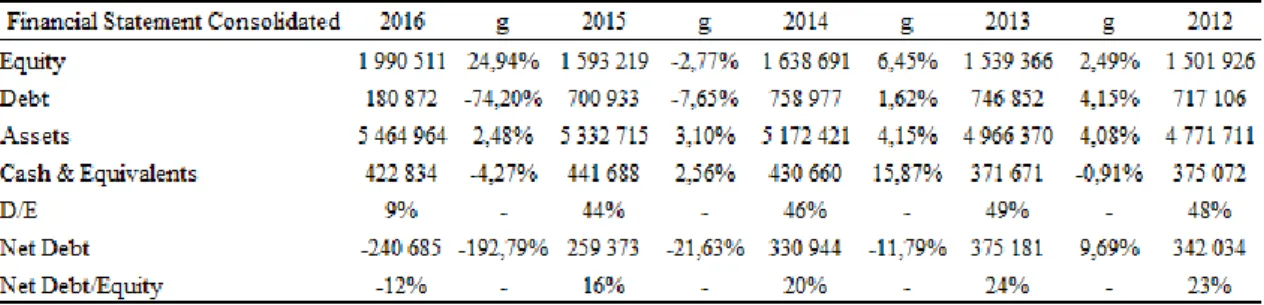
The Table VI represents the main financial statement indicators from the consolidated JM between 2012 and 2016. Thereby, the Net of debt has increased continuously from 2012 until 2013, mostly due to an increase in medium long-term debt. In 2016, JM repaid the medium and long-term debt and added a short-term debt due to future Colombia strategy operations.
JM Net Debt/Equity ratio was stable between 2012 until 2014. In 2014, JM had an increase of 20%. Furthermore, in 2016, the result suffers a major decrease with a result of negative 12%. 2012 2013 2014 2015 2016 Poland 6 763 7 762 8 519 9 903 9 903 Poland Stores 2 193 2 497 2 706 2 801 2 881 Portugal 3 920 4 046 4 095 4 299 4 482 Portugal Stores 413 417 421 440 455 Colombia 0 21 66 122 236 Colombia Stores 0 40 90 146 221 0 2 000 4 000 6 000 8 000 10 000 12 000
16
Table VI
Jerónimo Martins Financial Statement Consolidated 2012 – 2016
Source: JM
Jerónimo Martins, SGPS, SA with a ISIN code of PTJMT0AE0001 is currently in PSI 20 stock market with a weight of 11.70%, PSI ALL-SHARES with a correspond weight of 17.70% and PSI consumers services with a 65.38% of weight, Bloomberg and Reuters. In terms of Iberian, JM as a weight of 1.33% in the Iberian index.
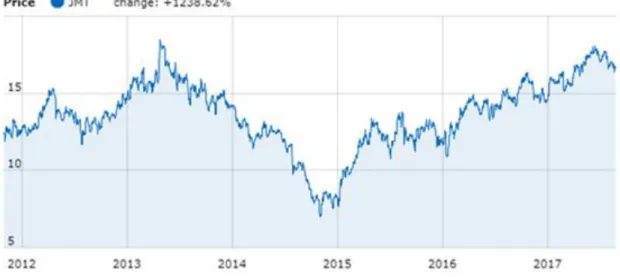
As we can see in Figure 3, the stock prices of Jerónimo Martins group as since 2012 to middle 2013 as increased constantly until it reaches the max value, since the beginning of JM stock price history, of € 18.47 in 25 of April 2013. However, between middle 2013 to 2015 the prices as gone to a lower of € 7.110 at 3 of November 2014, after reaching the lower value, the stock prices since that day as increased until reaching a higher value of €18.010 in 07 of Jun 2017. At 14 October of 2017, the stock price of Jerónimo Martins, SGPS, SA was € 15.76 which correspond a decrease of almost 20% compared with our prevision € 13.2.
17
Figure 3- Jerónimo Martins Stock Prices Source: https://www.euronext.com
3.4. Future strategies
The JM group strategies for the future, relies on the same plans already explained in section 4.3., that is, promoting better health through food, through better brand products, providing healthier solutions and giving more information to its customers. To respect the environment by reducing the carbon emissions and reducing the quantity of water used per year. Buying with responsibility, means that 80% of the total purchases of JM group are from local suppliers, for all insignias.
In terms of Financial strategies, JM group intends to keep investing in all three countries, especially in Colombia, which is the only country where JM is not already a leader in the market. However, the economic growth rate of Colombia, according to predictions, is going to fall and this could represent a risk. Another strategy is to keep investing in new types of products and manufacturing more brand products. Furthermore, according to the previous president of JM Group, Alexandre Soares dos Santos, JM intended to expand to other countries in two or three years’ time.
18
4. Business risks and opportunities
In this section, we will shortly describe the macroeconomic context of the main regions where JM operates: Europe and South America.
4.1. Macroeconomic framework
First, we begin by analyzing the macroeconomic performance of Portugal and Poland, since both are part of Europe.
In 2012, Europe faced a financial crisis with a gross domestic product (GDP) contracting of 4.0% compared to 1.8% in 2011. To overcome the financial crises it was implemented tight budgetary policy that caused a growing deflation, higher number of unemployment and lowest interest rates. However, in 2015, European Central Bank (ECB) started a plan to restart the economy by fixing low inflation rate and increasing the private consumption with the goal of stimulate the economy, not only in the Euro Zone but in the rest of the world.
As stated by Ocampo (2013), in Colombia, since 1990, the government did a large investment in economic private sector and spend a large quantity to invest, in particularly social services. In 2013, the financial global crisis hits Colombia with a problem of managing due to a constant insecurity in international economic environment and caused by local long-term trends, such as, the loss of competitivity in the sectors of agricultural and manifesting and the major problem of internal inequalities. Furthermore, in order to achieve a higher economic growth, Colombia had to reform their social and economic policies.
19
In terms of Economic growth, Portugal and Poland represent a bull effect, unlike Colombia economic growth, which represents a bear effect.
Since 2010, the GDP of Portugal fall constantly until 2013. In 2014, the Portuguese economy was growing due to a real increase of the GDP of 0.9%. Furthermore, Portugal had an increase of 1.8%, in 2015. In 2016, the GDP of Portugal had an increase of 1.5%. The forecasts for the Portuguese economy growth is positive, since the expected value for 2018 is between 4% and 5% (Figure 4).
Figure 4- Portugal GDP Annual Growth Rate Source: www.tradingeconomics.com
Unlike Portugal, Poland had a constant positive economic growth, only in 2012 it has a reduction of 5% to 1.6% and to 1.4% in 2013. However, in 2014, there GDP increased to 3.3% and consequently in 2015 to 3.8%. In 2016, Poland had a growth rate of 2.8%. Regarding the future, has expected, a similar evolution as Portugal, that is, a constant increasing of GDP and in 2018 is expected a GDP annual growth rate of 4% to 5% (Figure 5).
20
Figure 5- Poland GDP Annual Growth Rate Source: www.tradingeconomics.com
Between 2010 and 2011, Colombia had a real growth rate of 6.6%, however in 2012 it has dropped to 4.0%. In 2013, it raised again to 4.9%. However, from 2013 to 2016, it had a deceleration up to 2.0%. In terms of forecast, the expected scenario for Colombia is a slowdown of 0%-0.5% (Figure 6).
Figure 6- Colombia GDP Annual Growth Rate Source: www.tradingeconomics.com
21 4.2. Sector framework
The retail market, in Portugal, since 2012 and 2013 has suffered a slowdown, due to a high level of unemployment and the restriction implement by the International Monetary Fund (IFM) which cause a decrease of Portugal GDP (figure 4) and a decrease in the consumer confidence. However, the growth rate of the retail market in 2013 was 1.8% compared with 2012. In 2014, the retail market had the first positive signal that it was growing but the high level of unemployment and the deflation of the prices caused a reduced growth. In 2015, the real GDP as increased which caused a slow growth in the retail market and an increase of Portuguese confidence in the economy. In 2016, the food retail had a growth of 4,2% compared with 2015, this growth was due to an increase of real GDP, a decrease of unemployment and an increase of Portuguese’s confidence in Portugal economy.
In Poland, the food retail market registered a growth of 1.5% in 2013, even with a decelerated GDP growth (Figure 5), the fact the cost of life was more expensive in Poland, several independent company had to close their stores. In 2014, with the acceleration of the Poland economy growth, the food retail market increased by 2.3% compared with 2013, mainly due to a grew of private brand consumption. In comparison with 2014, in 2015, the food retail market increased by 2.1%, mainly due to a continues growth of real GDP and the prices deflation. In 2016, besides the slow growth of GDP, the food retail market registered an increase of 4.2% compared with 2015.
In Colombia, the food retail market grew by 4.2% in 2013, compared with the 3% growth in 2012. This growth was mainly due to an increase of real economic growth. In 2014, it opened more than 300 stores of retail, which cause an increase on the food retail market of 8.6%. However, in 2015, the food retail market had a small increase of 5.1% and the
22
opening of 197 new stores, which represent the deceleration of Colombia real GDP growth. In 2016, beside the deceleration in Colombia economy, the food retail market registered an increase of 7.4% compared to 2015.
The forecasts for Portugal and Poland is to increase their food retail market, since the historical data proves that the increase in the food retail market is directly related with the increase in the real GDP growth. On the contrary, the forecast of Colombia retail food market is to slowly decrease alongside their economy deceleration.
4.3. Strategic analysis
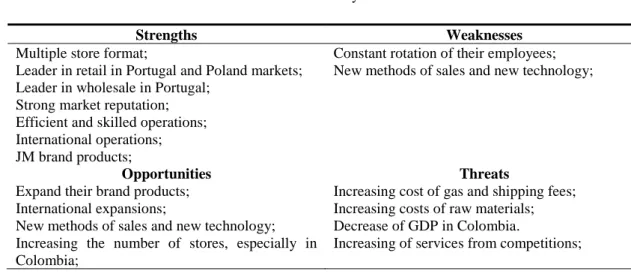
The main strength of JM relies on being a market leader in retail distribution in Portugal and Colombia, and also market leader of wholesale in Portugal. The group has a diversified stores and efficient and skilled operators. The weaknesses are the lack of countries where JM’s operates, this represents an incapability of having global impact, the constant rotation of their employees, due to the part time programs especially in the summer vacations, the lack of stores in Colombia and small probability of increasing the market share in Poland, since JM has a group already dominating market position. The growth in the emerging economies represents an opportunity for JM. The possibility of expanding the number of stores in Colombia, the increase in the demand of JM brand products represents a possible investment in new brand products, new technology and new sales methods. The possible concerning threats the company may face are lower profitability, due to growing competition, the increase of fuel prices and due to the competition services, in order words, the increase cost in exportation and importation. Table VII presents JM’s SWOT analysis.
23
Table VII SWOT Analysis
Strengths Weaknesses
Multiple store format;
Leader in retail in Portugal and Poland markets; Leader in wholesale in Portugal;
Strong market reputation; Efficient and skilled operations; International operations; JM brand products;
Constant rotation of their employees; New methods of sales and new technology;
Opportunities Threats
Expand their brand products; International expansions;
New methods of sales and new technology; Increasing the number of stores, especially in Colombia;
Increasing cost of gas and shipping fees; Increasing costs of raw materials; Decrease of GDP in Colombia.
Increasing of services from competitions;
We also performed the five forces of Porter, which is represented in Appendix 1.
4.4. Industry
Between 2012 – 2017, the Food Retail & Distribution industry’s increased constantly their growth of sales, due to the increase of economic growth rate and the confidence of the customers, the increase of competition, which represents a threat for the JM group, and the growth of new methods of selling.
The Industry of JM outcomes from a Joint Venture between Jerónimo Martins and Unilever, which JM as 45% of the company and Unilever has the remaining, 55%. With this Joint Venture, the group manufactures several brands in Portugal, such as, Olá, Dove, Knorr, Planta and Gallo. The Join Venture represents a major opportunity, since JM can benefit of selling and represent such brand that have a global reputation. Meanwhile, the Unilever benefits for having a partner which is the market leader in Poland and in Portugal.
24
5. Valuation
In this section, we define the valuation methodologies and the key value drivers to estimate JM’s firm value and stock price by using the Discounted Cash Flow (DCF) model and Relative Valuation model.
5.1. Discounted Cash Flow Method
DCF model is a method used by several financial analysts, to calculate the firm value. To apply this model, we use JM’s consolidated financial reports between 2012 to 2016. We choose the Flow to Equity (FTE) model, as JM revenues are constant overtime and since the debt accounts for a small weight in the firm capital structure. Furthermore, we also estimated JM’s firm value using the Weighted Average Cost of Capital (WACC) model.
In the next sub-sections, we define the key value drivers used in this valuation.
5.1.1. Cost of equity
To compute the cost of equity (𝑅𝑒), specified in the Equation 1, we use the following assumptions:
[1] (𝑅𝑒) = 𝑅𝑓+ (𝐿𝑒𝑣𝑒𝑟𝑒𝑑 𝐵𝑒𝑡𝑎 ∗ 𝐸𝑅𝑃)
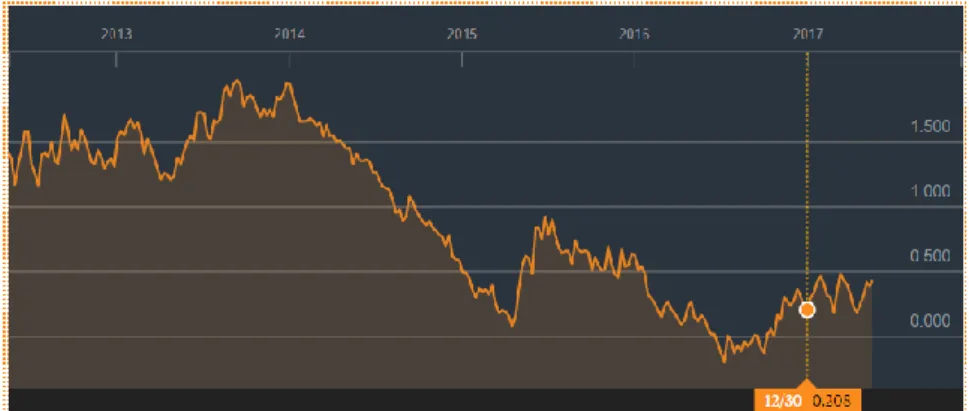
1. Risk-free rate (𝑟𝑓) is the yield to maturity of Germany government bonds with 10 years maturity. The value obtained was 0.208% using as source the Bloomberg platform (see Figure 7).
25
Figure 7- Risk-free rate of Germany government bonds 10 years maturity Source: Bloomberg
2. The risk premium (𝐸𝑅𝑃) is the weighted average of the total Equity Risk Premium (based on Rating) of the countries where the firm has operations (Portugal, Poland and Colombia). Table VIII presents the calculations of the equity risk premium. The equity risk premium is 7,64%.
Table VIII Equity Risk Premium
3. To obtain the levered Beta (𝛽𝐿), we use equation (2). We use the unlevered beta, retrieved from Damodaran (2017) of 0.53 by the marginal tax rate of 23.73% and the net debt divided to equity ratio of -4.19%. In the end, the levered beta equals to 0.51.
26
[2] 𝐿𝑒𝑣𝑒𝑟𝑒𝑑 𝐵𝑒𝑡𝑎 (𝛽𝐿) = 𝑈𝑛𝑙𝑒𝑣𝑒𝑟𝑒𝑑 𝐵𝑒𝑡𝑎 (𝛽𝑈) [1 + (1 − 𝑡) (𝑁𝑒𝑡 𝐷𝑒𝑏𝑡
𝐸𝑞𝑢𝑖𝑡𝑦 )]
Table IX presents the Cost of Equity. The cost of equity is 4.10%.
Table IX
Cost of Equity (Re)
The cost of debt was also calculated in order to perform other models, see appendix 4.
5.1.2. Revenues assumptions
To estimate the revenues between 2017 and 2019, we used the average nominal growth rate since 2012 until 2016 for each insignia of JM (see Table X). Furthermore, for the perpetuity calculation, we use the forecasted economic growth rate for each country. Poland economic growth rate will be 1.1% and was used for Biedronka and Hebe. Portugal economic growth rate will be 2.5% and was used in Pingo Doce and Recheio. Colombia economic growth rate will be 0.7% and was used in Ara. For the other adjustments, we could not divide it by country, thus we use the forecast for the eurozone of 1.8%, since most of their sales in 2016 were done in Europe.
27
Table X Revenues
Source: JM
5.1.3. EBITDA assumptions
To estimate the EBITDA, we analyze the EBITDA margin for each JM’s insignia. We compute the historical average between 2012 and 2016.
Table XI presents the historical nominal growth rate. We also calculate the EBITDA margins for each insignia of JM, presented in Table XII.
28 Table XI Assumption Source: JM Table XII EBITDA by insignia Source: JM
5.1.4. Capital Expenditures and Depreciations Assumptions
Capital Expenditures (CapEx) is the difference of gross fixed assets from one year to the other, which means the investments and reinvestments made in one year. In this case, we used the historical data for the ratio CapEx/Sales between 2012 and 2016.
29
Fixed assets include the tangible and intangible assets. CapEx is computed using Equation 3:
[3] 𝐶𝑎𝑝𝐸𝑥 = 𝐺𝑟𝑜𝑠𝑠 𝐹𝑖𝑥𝑒𝑑 𝐴𝑠𝑠𝑒𝑡𝑠𝑛−1− 𝐺𝑟𝑜𝑠𝑠 𝐹𝑖𝑥𝑒𝑑 𝐴𝑠𝑠𝑒𝑡𝑠𝑛
We assume that the CapEx/Sales equals to 1.4%. We assume that JM is going to invest in short, median- term, in Colombia.
Table XIII presents the CapEx assumptions.
Table XIII
Gross fixed assets and CapEx
Source: JM
Depreciations, Amortizations, Provisions and Impairment were calculated using an average of the historical data. The estimations are present in Table XIV.
Table XIV
Depreciations, amortizations, provisions and impairment
30
5.1.5. Changes in Working Capital Assumptions
The forecasted values for the working capital of current assets and current liabilities are presented in Table XV and Table XVI, respectively. We compute the average of each working capital item by sales. The Net Working Capital is presented in Table XVII, which corresponds to the current assets subtracted by the current liabilities.
Table XV Working Capital Assets
Source: JM
Table XVI
Working Capital Liabilities
31
Table XVII Net Working Capital
Source: JM
5.1.6. Tax Rate Assumptions
Using the historical data since 2012 to 2016, the average effective tax rate is 23.94%. We use, the marginal tax rate of 21% plus surtax rate of 1.5% and plus the state surtax rate 3%, the total is 25.5%.
5.2. Firm value
Table XVIII presents the JM’s Free Cash Flow to Equity (FCFE). The balance sheet and income statement between 2012 to 2016, is presented in Appendix 5 and the forecasted income statements are presented is Appendix 6.
Table XVIII Free Cash Flow to Equity
32
[4] 𝐹𝐶𝐹𝐸 = 𝑁𝑒𝑡 𝑖𝑛𝑐𝑜𝑚𝑒 + 𝐷𝑒𝑝𝑟𝑒𝑐𝑖𝑎𝑡𝑖𝑜𝑛 − 𝐶𝑎𝑝𝑖𝑡𝑎𝑙 𝐸𝑥𝑝𝑒𝑛𝑑𝑖𝑡𝑢𝑟𝑒𝑠 − ∆ 𝑊𝑜𝑟𝑘𝑖𝑛𝑔 𝐶𝑎𝑝𝑖𝑡𝑎𝑙 + (𝑁𝑒𝑤 𝐷𝑒𝑏𝑡 𝐼𝑠𝑠𝑢𝑒𝑑 − 𝐷𝑒𝑏𝑡 𝑟𝑒𝑝𝑎𝑦𝑚𝑒𝑛𝑡𝑠)
The result obtained in 2016 is due to a repaid the medium and long-term debt and added a short-term debt.
After we obtained the FCFE for the explicit and perpetual period, the values were discounted by the cost of equity. To obtain the equity value, we must subtract the minority interest. We reach an Equity Value of € 8.522.288 million. At 14 October of 2017, the stock price of Jerónimo Martins group was € 15,760 and our price target is € 13,2 (Table XIX), which represents a depreciation of almost 20%.
The Firm Value is computed by adding the net debt, the minority interests and the other liabilities. The Firm Value equals € 9.290.531 million.
Table XIX FCFE Price Target
33
6. Robustness Check
In this section, we perform a Sensitivity Analysis and a Monte Carlo simulation in order to confront the target price obtained, since the estimation was based on a set of assumptions.
We perform a Sensitivity Analysis, as represented in Table XX, using as key value drivers the growth rate of capex and the cost of equity (Re). Both have an important role for the estimation of the stock prices, especially the Re, since it takes into account the equity risk premium of each country where JM operates.
After analyzing the results obtained in ceteris paribus framework, we conclude that a variation on the Cost of Equity of 0.4% has an impact of 1% in the stock prices. However, a variation of the growth rate in 0,1%, the stock prices changes between 3.1% and almost 4.7%
The Sensitivity Analysis does not include the last stock price of Jerónimo Martins, which was 15.760 at 14 of october of 2017.
Table XX
34
7. Monte Carlo Simulation
The Monte Carlo Simulation was estimated using the inputs presented in Table XXI, and the output is presented in Figure 8.
Table XXI
Inputs of Monte Carlo Simulation
35
The values were estimated after 10.000 observations. With a standard deviation of 9%, the average stock price value of JM was € 12.10, which compared with our price target corresponds to a depreciation of 9% but compared with JM real stock price, corresponds to a depreciation of almost 30%.
36
8 Risk Factors
Investment Risks for JM, consists of several types of risk, such as, Generic Competition, Competitive Products, Regulatory and Legal Risk, Pricing, Research and Development and the Global Economic Environment
In the case of Generic Competition, the risk is based on the potential growth of the competition, in Portugal and Colombia, due to different strategies taken, which may cause pricing wars that can mean significant market losses. The Competitive Products risk are based on the quality of the products of the competition, whether self-manufactured or exclusivity of distribution and the price-quality gap, which can also cause a significant lose of market cap. In terms of Pricing risk, the JM group can control the prices of their products partially, since there are several products that depend on external conditions, such as the atmospheric conditions, consumer confidence in the economy and the expected growth rate of the economy, especially in Colombia, due to the forecast of its deceleration (Figure 6). The Regulatory and Legal represent a major risk for the JM group, since each government, where JM operates, have their own regulations and laws regarding the prices of several types of products and different tax rates and fees, which can represent a major threat to the strategies planned by JM. In terms of Research and Development, the risk is based on the technological advances, such as new types of sales methods, the research of new products, new types of marketing and different modes of payment. In terms of the Global Economic Environment, the principal risk that could represent a major risk for the Food Retail and Distribution market is another financial crisis. For the JM Group it also represents a major risk, since JM is presented in three countries and is currently planning to internationalize for the third time and a financial crisis can threaten all the strategy planned for the next few years and put the very existence of JM group at risk.
37
However, the JM group is a conservative company, which means that their investments are made to be stable and long-lasting investments, in order to have a reduced exposure to risk. With this control and a well-planned strategy, JM group can maintain their leadership in Portugal and Poland. However, the economic growth rate of Colombia is the major risk that JM group faces. They are, currently, investing hard in Colombia and if it failis to succeed, JM group can face difficult times.
38
9. Relative Valuation
We performed a Relative Valuation by comparing the performance of JM and the performance of 163 firms reported by Damodaran for retail sector (grocery and food) sector. We use three equity multiples: Price to Earnings (PER), presented in Table XXII, Price to Book-Value (PBV), presented in Table XXIII, and Price to Sale (PS) presented in Table XXIV. In Appendix 7 we also estimated three firm multiples.
Table XXII
Multiples, Price to Earnings (PER)
Table XXIII
39
Table XXIV Multiples, Price to Sale (PS)
By analyzing the tables above, the first table of each multiple corresponds to the estimation of JM stock price and equity value, the second tables correspond to the values from the retail sector.
Using the Price to Earnings multiple, we have a stock price of € 12.29 and an equity value of € 7.735, however, when compared to the value of the sector, JM should have a share price of € 31.96 and an equity value of 20.114. Using the Price to book-value (PBV) multiple, in comparation with the retail sector, JM almost the same share price and almost
40
the same equity value, € 6.56 and 4.130. The last multiple estimated was the Price to Sale (PS), we obtained a share price of 0.89 and an equity value of 562, which compared with the values calculated from the sector, is low.
9.1. Peer Group Analysis
In order to have a complete analysis of the Relative Valuation model, we also compared the performance of comparable companies. In the case of JM, there are several comparable companies in the same market (Food Retail & Distribution).
Table XXV, represents the Peer Group Market based on Japanese, U.S and European companies.
Table XXV
Peer Group Market Share and Stock Price
In accordance with Figure 9 and Table XXV, in terms of market cap, JM has 2,29% of the market share. However, his direct rival (Sonae Group) have only 0,48%. In comparison with the all market, the results obtained are in line with our SWOT analysis, it means that JM does not have a global impact.
Company Name Stock Price (EUR) Market CAP
Wal-Mart Stores Inc 82,35 63,82%
Retail Partners Co 10,63 12,68% Albis Co Ltd 31,38 7,34% Ahold Delhaize 18,82 5,17% Tesco PLC 234,09 3,74% Carrefour 17,88 3,07% Jeronimo Martins SGPS SA 16,17 2,29% Metro AG 17,48 1,41% Sonae Group 1,10 0,48%
41 Figure 9 – Peer Group Market Share.
In terms of Multiples, represented in Table XXVI, JM has the higher Price to Sale and Price to Book value, in comparison with their peer group. However, in terms of Price to Earnings, JM stock price is only 12.29 € which compared with the highest value, Tesco PLC, represents a difference of 24.39 €.
Table XXVI
Peer Group Market Multiples
Company Name Price to Earnings Price to Sale Price to Book
Tesco PLC 36,68 0,30 1,59
Wal-Mart Stores Inc 25,77 0,58 3,78
Ahold Delhaize 19,36 0,37 1,56 Carrefour 18,93 0,17 1,37 Metro AG 17,00 0,17 1,99 Albis Co Ltd 15,49 0,41 1,53 Jeronimo Martins SGPS SA 12,29 0,89 6,56 Sonae Group 10,52 0,38 1,11 Retail Partners Co 2,50 0,30 0,91
42
10. Conclusions
The main objective of this equity research is to forecast JM’s Firm and Equity Value, in order to provide important information to the potential investors, stakeholders and shareholders.
The JM group is one of the most important groups in Portugal and one of the worldwide player in the retail distribution market.
The first method we used to estimate the JM stock price was the FTE model. We reached a value of € 13.2 for the stock price and € 9.289.985 million of JM firm value. The target price is below the stock price at 14 October 2017 (€ 15.76), which represents a depreciation of almost 20%. The same results were obtained in the sensitivity analysis, which we conclude that a price of € 15 does not appear in our results, since in our result the max value is € 13.82. Furthermore, the results obtained in the relative valuation also proved the JM stock price is overvalued. In the end, we performed the Monte Carlo simulation, with a standard deviation of 9%, the average stock price of JM was € 12.10, which also validates that the JM real stock price is overvalued.
In conclusion, we recommend the investors to SELL their shares and, to the future investors, wait for the stock price to depreciate in short-term.
43
References
Bloomberg (2017) Portuguese Government Bond 10YR Note Portugal PL. Available at: https://www.bloomberg.com/quote/GSPT10YR:IND
Bloomberg (2017). Germany Generic Govt 10Y Yield. Available at: https://www.bloomberg.com/quote/GDBR10:IND
Brealey, R. Myers, S. and Allen, F. (2008) Principles of Corporate Finance (Ninth edition), McGraw-Hill.
Copeland, T. and Keenan, P. (1998) How much is flexibility worth? McKinsey Quarterly.
Damodaran (2017) Damodaran online. Available at:
http://pages.stern.nyu.edu/~adamodar/
Damodaran, A. (2002) Investment Valuation: Tools and Techniques for determining the
value of Any Asset, 2ª Edição, Wiley (New York);
Damodaran, A. (2006) Valuation Approaches and Metrics: A Survey of the Theory and
Evidence. New York Stern School of Business.
Damodaran, A. (2012) Equity Risk Premiums (ERP): Determinants, Estimation and
Implications. New York Stern School of Business.
Durand, D. (1957) Growth Stocks and the St. Petersburg Paradox. Journal of Finance, vol. 12, pp. 348-‐ 363.
Farrel, J. (1985) The Dividend Discount Model: A Primer. Financial Analysts Journal, pp: 16-25.
Fernandez, P. (2002) Valuation methods and shareholder value creation. Academic Press.
Fernández, P. (2005) Discounted cash flow valuation methods: Examples of perpetuities,
constant growth and general case, IESE Research Papers D/604, IESE Business School;
Fernandez, P. (2007) Company valuation methods. The most common errors in
valuations. IESE Business School, University of Navarra, working paper no.449.
Foerster, S. R. & Sapp, S. G. (2005) The Dividend Discount Model in the Long-‐Run: A
Clinical Study. Journal of Applied Finance, pp. 1–40.
Goedhart, M. Koller, T. and Wessels, D. (2005b) The right role for multiples in valuation. McKinsey on Finance 15, pp. 7-11.
Goedhart, M. Koller, T. and Wessels, D. (2010) Valuation: Measuring and Managing the
Value of Companies, (Fourth Edit.). John Wiley & Sons.
Goedhart, M. Koller, T. Wessels, D. McKinsey and Company (2005a), Valuation:
44
Gordon, M. (1962) The Investment, Financing, and Valuation of the Corporation, The Irwin Series in Economics;
Jerónimo Martins (2012). Relatório e Contas 2012. Available at: http://www.jeronimomartins.pt/media/512044/rc-2012-site-jm_pt.pdf
Jerónimo Martins (2013). Relatório e Contas 2013. Available at: http://www.jeronimomartins.pt/media/568557/rc_pt_jm_2013.pdf
Jerónimo Martins (2014). Relatório e Contas 2014. Available at: http://www.jeronimomartins.pt/media/618854/relatoriocontasjeronimomartins2014.pdf Jerónimo Martins (2015). Relatório e Contas 2015. Available at: http://www.jeronimomartins.pt/media/665173/relatoriocontasjeronimomartins2015.pdf Jerónimo Martins (2016). Relatório e Contas 2016. Available at: http://www.jeronimomartins.pt/media/743606/relatoriocontasjm2016.pdf
Jerónimo Martins (2017). Estrutura do Capital. Available at: http://www.jeronimomartins.pt/investidor/accao-jm/estrutura-do-capital.aspx
Jerónimo Martins (2017). Principais indicadores (últimos 5 anos). Available at: http://www.jeronimomartins.pt/investidor/informacao-operacional-financeira/principais-indicadores-5anos.aspx
Lie, E. Lie, H. (2002) Multiples used to estimated Corporate Value, Financial Analysts Journal, Vol. 58, No. 2, pp. 4-22;
Liu, J. Nissim, D. Thomas, J. (2002) Equity Valuation Using Multiples, Journal of Accounting Research, Vol. 40, No. 1, pp. 135-172
Luehrman, T. (1997a) What’s It Worth? A General Managers Guide to Valuation. Harvard Business Review, pp. 132-142.
Luehrman, T. (1997b) Using APV (Adjusted Present Value): a better tool for valuing
operations. Harvard Business Review, pp. 145-154.
Luehrman, T. (1998) Investment Opportunities as Real Options: Getting Started on the
Numbers. Harvard Business Review, pp. 138-150.
Meitner, M. (2006) The Market Approach to Comparable Company Valuation. Springer Science & Business Media.
Miles, J. Ezzell, J. (1980) The Weighted Average Cost of Capital, Perfect Capital Markets,
and Project Life: A Clarification, The Journal of Financial and Quantitative Analysis,
Vol. 15, No. 3, pp. 719-730.
Myers, S. (1974) Interactions of Corporate Financing and Investment Decisions -
45
Neves, J. (2002) Avaliação de empresas e negócios: Fundamentos, Técnicas e
Aplicações. Mcgraw-Hill.
Ocampo, J. A. (2015) Performance and challenges of the Colombian economy. Available at: http://www.itf.org.ar/pdf/documentos/90_2013.pdf.
Reuters (2017). Bank of Portugal raises economic growth outlook for 2017-2019. Available at: https://www.reuters.com/article/portugal-economy/bank-of-portugal-raises-economic-growth-outlook-for-2017-19-idUSE8N1IJ00G
Sabal, J. (2005) WACC or APV? The Case of Emerging Markets, Department of Financial Management and Control, ESADE Universitat Ramon Llull.
Sabal, J. (2007) WACC or APV? Journal of Business Valuation and Economic Loss Analysis.
Steiger, F. (2008) The Validity of Company Valuation Using Discounted Cash Flow
Methods. European Business School.
Trading Economics (2017). Colombia GDP growth rate. Available at: https://tradingeconomics.com/colombia/gdp-growth
Trading Economics (2017). Poland GDP growth rate. Available at: https://tradingeconomics.com/poland/gdp-growth
Williams, J. (1938) The Theory of Investment Value. Harvard University Press, Cambridge.
46
Appendix 1 – Five Forces of Porter
THREAT OF NEW ENTRANTS (Low):
With the increase of the industry profits, there are several companies that will try to enter in the Food Retail and Distribution market, however, the new companies/entrants will consequently cause a decrease of the industry profits. Eventually, the new entrants will have several barriers, such as, difficultly accessing to distributions and suppliers due to their fidelity, the customer loyalty with brand, the strong market present of their rivals and patents and copy rights.
THREAT OF SUBSTITUTES (High):
There are several factors that can make the customer change their loyalty to other company, such as, the price that the rival companies can sell, another type of products with better quality, the reduction of the brand quality.
DEGREE OF INDUSTRY RIVALRY (High):
In terms of industry rivalry, there are several companies, which are already very well established in the market, making difficult to new company to enter in the Food Retail & Distribution market. There are several factors that influence the company’s rivalry, such as, innovation, especially in technology, sustainable development and position, the level of advertising and the politic and strategy of the company.
BARGAINING POWER OF BUYERS (Medium):
The bargaining power of buyers is the capability of the buyers to reduce the prices, in other words, it is the ability to level the cost by changing one product to other less expensive. In this case, the power of buyer is low if there are less alternative products in
47
the market, and it is high if there are several options available. The factors that can influence the power of buyers are the constant changing cost of a buyer, the sensitivity price of the buyer and the competitive advantage of brand products on the company.
BARGAINING POWER OF SUPPLIERS (Low):
The bargaining power of suppliers consists of the power that the suppliers have in the product price, however, it depends on the supplier if has a strong market presents. In the case of small supplier company’s, it is difficult to change the price, since there are several companies that are available to take their place. The factors that can influence the power of suppliers are the input differentiation, the costs of diversity, the strength of distribution centers and the input variety available.
Appendix 2 – Beta
Appendix 3 – Unlevered Cost of Capital
4. Risk-free rate (𝑟𝑓) is 0.208% using as source the Bloomberg platform (see Figure 7).
5. The risk premium (𝐸𝑅𝑃) is 7,64%, see Table XVIII
6. We used the unlevered beta, retrieved from Damodaran (2017) of 0.53
Unlevered cost of Capital
48 The unlevered cost of capital is 4.23%.
Appendix 4 – Country Risk Premium and Cost of Debt
7. Risk-free rate (𝑟𝑓) is 0.208% using as source the Bloomberg platform (see Figure
7).
8. The country risk premium (𝐶𝑅𝑃) is the weighted average of the total Country Risk Premium (based on Rating) of the countries where the firm has operations (Portugal, Poland and Colombia). The Table presents the calculations of the country risk premium. The country risk premium is 1,95%.
9. To obtain the Cost of Debt (𝑅𝑑), we use equation below. To obtain the Default spread, we devided the net interest by the interest cover ratio and we reach a result of 2.57. Furthermore, we retreated of Damodaran (2017) the spread equivalent to B1/B+, which was 3.75%.
The cost of debt is 5.91%.
Country Risk Premium
𝑅𝑑 = 𝑅𝑓+ 𝐷𝑒𝑓𝑎𝑢𝑙𝑡 𝑠𝑝𝑟𝑒𝑎𝑑 + 𝐶𝑅𝑃
49
Cost of Debt
50
51
52
53