M
ASTER
R
EAL
E
STATE
M
ANAGEMENT AND
E
VALUATION
M
ASTER
´
S
F
INAL
W
ORK
D
ISSERTATION
P
ORTUGAL
P
RIVATE
R
ENTAL
S
ECTOR
C
OMPETITIVENESS IN A
E
UROPEAN
C
ONTEXT
P
AULO
D
UARTE
P
AULINO
S
ARDINHEIRO
M
ASTER
R
EAL
E
STATE
M
ANAGEMENT AND
E
VALUATION
M
ASTER
´
S
F
INAL
W
ORK
D
ISSERTATION
P
ORTUGAL
P
RIVATE
R
ENTAL
S
ECTOR
C
OMPETITIVENESS IN A
E
UROPEAN
C
ONTEXT
P
AULO
D
UARTE
P
AULINO
S
ARDINHEIRO
S
UPERVISION:
P
ROFESSORD
OUTORJ
OAQUIML
EITÃOM
ONTEZUMA DEC
ARVALHO3
Acknowledgments
I would like to thank all property professionals that participated in the empirical study, Professor Joaquim Montezuma de Carvalho, who was my mentor, Mary Ann Selly from Expert Choice, and my wife and family who tolerate my absence, specially my eldest son for being so responsive despite having missed all the games in the season.
4
Resumo
O mercado imobiliário Europeu enfrenta grandes desafios impostos não só pelo setor bancário e as suas dificuldades de liquidez mas também pela fraca performance económica dos países da zona euro. O mercado residencial está no centro deste problema económico e regista um excesso de oferta bem como uma deslocação significativa da procura para o mercado de arrendamento. Este constrangimento sectorial constitui ao mesmo tempo uma oportunidade para a entrada de novos
investidores no mercado, na perspectiva de aquisição para arrendamento. Para muitos investidores internacionais a Europa é entendida como um Mercado apetecível tendo em conta as oportunidades decorrentes dos ajustamentos de preços. Assim, afigura-se-nos da maior relevância um estudo sobre o nível de competitividade do mercado de arrendamento de português num contexto Europeu. O presente trabalho tem como objetivo estudar os sistemas ranking para suporte à decisão na avaliação do risco de investimento e medir o nível de atractividade que lhes confere . Os sistemas de rankings e ratings têm sido utilizados por profissionais em todo o mundo como facilitadores da tomada de decisão, sendo de aplicação diversa em diferentes setores da economia. O objetivo deste trabalho consiste, em primeiro lugar, analisar a metodologia que permite a construção de um ranking como ferramenta de suporte à decisão e, em segundo lugar, desenvolver um estudo empírico utilizando a metodologia Analytical Hierarchy Process para avaliar a competitividade de Portugal no mercado de arrendamento ao nível
Europeu.
Palavras-chave
Mercado de arrendamento; Sistemas de Ranking, Analytical Hierarchy Process; Investimento; Habitação; Buy-to-let, Teoria da Decisão
5 Abstract
The European real estate market faces enormous challenges driven by the banking sector and countries inability to generate wealth. The residential sector is challenged with an oversupply of houses and a shift towards the private rental sector. This constraint constitutes an opportunity for buy-to-let investors to enter the market therefore, as Europe can be seen as a destination market on its own, the assessment of countries competitiveness in the private rental sector becomes a relevant essay.
The present work aims to study the ranking systems as a decision-framework to assess property investment risk. Rankings and ratings have been widely used by professionals around the world to facilitate judgments and support decisions, and have a wide
application to different economic sectors. The purpose of this paper is, first of all, to study the ranking methodology as a decision-framework that allows investors and property professionals to understand the problem and, secondly, to develop an empirical-study using the Analytical Hierarchy Process methodology to measure Portugal property rental sector competitiveness in an European context.
Keywords
Rental market, Ranking systems, Analytical Hierarchy Process; Private investment; Housing; Buy-to-let, Decision theory
6 1 List of Tables
Table I: TEGoVA Property and Market rating system criteria for completed properties - Property type example: Residential
Table II: Summary and criteria selection
Table III: Random Index
Table IV: Empirical study criteria
Table V: Case-study AHP scale, based on Saaty’s scale of relative importance
Table VI: Preferred criteria to assess property residential risk in a buy-to-let investment Expert Choice software output
Table VII: Consistency Adjustment table - Preferred criteria to assess property residential risk in a buy-to-let investment – Expert Choice software output
Table VIII: Comparison matrix for gross rental yield Table IX: Alternatives data
Table X: Comparison matrix for Income Tax, normalization process and Eigenvector Table XI Comparison matrix for Capital Gains Tax, normalization process and Eigenvector
Table XII Comparison matrix for Round-trip transaction costs, normalization process and Eigenvector
Table XIII: Comparison matrix for Potential Landlords & Tenants Problems, normalization process and Eigenvector
Table XIV: Comparison matrix for GDP Growth, normalization process and Eigenvector
7
Table XV: Comparison matrix for Risk of Direct, Investment, normalization process and Eigenvector
Table XVI: Comparison matrix for Global Competitive Index, normalization process and Eigenvector
8 2 List of Figures
Figure 1: Structure of analysis of regional clusters by Bouwfonds Figure 2: Example of the Analytical Hierarchy Process model Figure 3: Empirical study AHP model
Figure 4: Survey Statistics – Pie charts
Figure 5: Priority results chart for the alternatives according to Gross Rental Yield and consistency level
Figure 6: Ranking results that demonstrates residential private rental sector competitiveness on a buy-to-let perspective in an European context – 6 countries empirical study.
Figure 7: Priority results chart for the Alternatives according to Income Tax and respective consistency level
Figure 8: Priority results chart for the Alternatives according to Capital Gains tax and respective consistency level
Figure 9: Priority results chart for the Alternatives according to Round-trip Transaction Costs and respective consistency level
Figure 10: Priority results chart for the Alternatives according to Potential Landlords and Tenants Problems and respective consistency level
Figure 11: Priority results chart for the Alternatives according to GDP Growth and respective consistency level
Figure 12: Priority results chart for the Alternatives according to Risk of Direct Investment and respective consistency level
Figure 13: Priority results chart for the Alternatives according Global Competitive Index and respective consistency level
9 3 List of Abbreviations
GDP – Gross domestic product
TEGoVA - European Group of Valuers Associations PaM. - Property and Market rating
GPG – Global Property Guide
GDP per Cap – Gross domestic product per capita PRS – Property risk scoring
AHP - Analytical Hierarchy Process GPR - Global Competitive Report
WCY - World Competitiveness Yearbook CI - Consistency Index
CR - Consistency rate
RI - Random Consistency Index
RICS – Royal Institution of Chartered Surveyors ULI – Urban Land Institute
10 4 Index Acknowledgments ... 3 Abstract ... 5 1 List of Tables ... 6 2 List of Figures ... 8 3 List of Abbreviations ... 9 4 Index ... 10 5 Introduction ... 12 6 Literature review ... 13
6.1 Basis of concept and use ... 13
6.2 Property and Market rating system ... 14
6.3 Rankings by clustering specialization sectors ... 16
6.4 Empiric Five-star ratings ... 18
6.5 Property Risk Scoring ... 19
6.6 AHP application in Property Investment... 21
6.7 Summary and criteria selection ... 23
7 Analytical Hierarchy Process ... 24
7.1 Overview ... 24
7.2 Questionnaire design and scale ... 25
7.3 Consistency ... 26
8 Empirical study ... 27
8.1 Introduction ... 27
8.2 Criteria definition – Level 1 ... 27
8.3 Alternatives – Level 2 ... 29
8.4 AHP Model ... 30
8.5 Scale ... 30
11
8.7 Comparison matrix output for the 1st level ... 32
8.8 Survey Consistency ... 33
8.9 Determining the comparison matrix, the Eigenvector and the consistency for the 2nd level in the hierarchical model ... 35
8.10 Empiric study results and ranking calculation process... 35
9 Final conclusions ... 36
10 Annexes ... 40
10.1 Annex 1 Alternative Data ... 41
10.2 Annex 2 - Determining the comparison matrix, the Eigenvector and the consistency for the 2nd level in the hierarchical model ... 43
10.3 Annex 3 – Calculation process for all Alternatives in relation to each prioritized criterion ... 51
10.4 Annex 5 – Eurostat statistics – GDP growth ... 53
10.5 Annex 7 - Survey... 54
12 5 Introduction
Real Estate investors, like any other investor, are strongly driven by the outcome of their investments and respective risk inherent in each investment. Both risk and income valuations are no more than an expectation based on historic performance, operations and the probability of different scenarios occurring. Despite risk being different from uncertainty, in this paper we treat it as the same, unless we address it separately.
Professional and academic experts around the world have long studied the theme of risk vs returns and developed a diversity of mathematical models that have been applied by decision-makers to support the decision-process. The great challenge, however, has always been on the tipping point, ie, the decision itself.
According to Dr. Antonio Damásio (2010), the ability to manipulate data and make analysis between costs and benefits are easily accessed by humans, but making a decision is something completely different that goes beyond the rational cognitive process.
There are several ways of making decisions, the primitive one, by using chance which is normally used when both alternatives seem similar and there is lack of information about each of the alternatives. A more rational way is by weight advantages and disadvantages and deciding or not towards one of the options. Decisions can also be made in a group, the general consensus being that several minds are better at judgments than a single one. The challenge in group sessions is the creation of unanimity among participants, nevertheless involving several people in a decision process is always positive, as they raise more questions than a single person would do.
13
The search for the most accurate method that grants decision-makers greater accuracy at tipping point has led to the common use of ranking systems. The present literature review presents different methodologies based on ranking, rating or scoring systems used by real estate professionals to assess risk and competitiveness. An empirical study materializes one of the methods and allows the construction of a decision-framework to assess Portugal competitiveness in the private rental sector in a European context.
6 Literature review
6.1 Basis of concept and use
Despite the different terminology, all methods converge to the same purpose - building a decision-framework. The ranking system materializes a relationship between elements. When compared with each other, the first is either “ranked higher than”, “ranked lower than” or “ranked equal to” the second. The rating on the other hand is a judgment or assessment of a certain capacity to accomplish a goal. It could be a quality assessment, quantity assessment or both. Scoring is equal to ranking has it serves the purpose of prioritizing elements.
Since the beginning of the 20th century corporations have been using ratings to measure risk, specifically bonds risk. The first rating system was developed by Moody’s in 1913, followed by Standard & Poors in 1916, to express the valuation or future value of a company, country, asset or situation.
Ratings are widely used in the financial markets to standardise information related to operational or financial risks. The subject of credit rating has been heavily discussed in the last 3 to 4 years since the sub-prime crises force the collapse of the financial markets and pull the plug on countries that were overspending and leveraging their GDP.
14
The Basel Committee on Banking Supervision has been highlighting and reinforcing since the beginning of the century the need for a standard banking rating system and minimum capital requirements for banks, N. E. Hutchison et al (2003). Forced by the recent global crisis Banks have tightened risk assessment criteria and ratings systems have never been more discussed than before.
6.2 Property and Market rating system
The European Group of Valuer’s Associations (TEGoVA) suggests that a similar system to the Banking rating system should be created for the real estate market, and presented in 2003 their model for a rating system – Property and Market rating (PaM). The ranking system has a diverse application from risk analysis of portfolios for securitization purposes, to property analysis, in the context of investment and disinvestment decisions, and loan analysis in the process of granting property loans. Based on the same system used by rating agencies and the banking sector, TEGoVA proposes to score property from 1, representing “Excellence”, to 10 representing “Disaster”.
The criteria used by TEGoVA rating system is the result of a survey targeted to real estate professionals that pointed 4 criteria classes of property assessment: market, location, property, and quality of the property cash flow. Each criteria-class was then divided in sub-areas with respective weights that resulted from further research and expert surveys to different market specializations, namely, Residential, Retail, Office and Warehousing, Distribution and Production. We will focus on the residential sector and respective criteria as this is the scope of our work in the paper.
15
Table I: TEGoVA Property and Market rating system criteria for completed properties - Property type example: Residential
The rating is built from the standard weights that originated from Expert surveys accomplished by TEGoVA and applied to both criteria and sub-criteria. During the property assessment the valuer will judge according to the given scale of 1 to 10 each of the criteria. Each class-criterion rating is calculated by multiplying each
sub-16
criterion score by its weight. The residential property rating in a certain market is therefore obtained by the sum of the class-criteria x its respective weights.
TEGoVA suggests that in order for this rating system to be used by professionals and the market in general, yearly surveys will have to be conducted so that the structural weight system expresses current market conditions and perspectives.
6.3 Rankings by clustering specialization sectors
Bouwfonds, an European real estate investment & management firm, presented in 2009 a research about European housing markets, with the purpose of evaluating the attractiveness of regional areas within Europe for residential investment. Acknowledging European economic heterogeneity between and within countries, they established regional clusters across Europe, with the understanding that regions with the same economic structure have the same market dynamics.
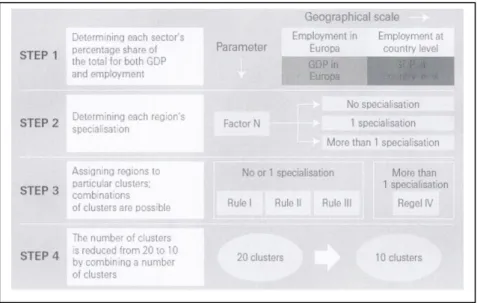
Regional clusters were built based on two economic parameters (GDP and employment) and geographical scale. Each parameter was subdivided by specialization sector (ex: agriculture, commercial services, education, financial institutions, etc). As statistical offices across Europe use different methods of reporting, Bouwfounds introduced the geographical scale parameter in the equation. The clustering methodology follows 4 phases: 1) Determining each specialization sector percentage share of the total for both GDP and employment, 2) Determining each region’s specialization, 3) Assigning regions to particular clusters, 4) Consolidate the number of clusters by aggregating them into larger clusters in order to have greater representation of economic dynamics. The output is a representation of European economic regions clustered by sector specialization. The assumption made in the Bouwfonds European Real Estate Market
17
Compared Report is that property markets in the same cluster have the same dynamics and a strong correlation between the parameters on the demand side of that property market, Bouwfonds (2009).
Figure 1: Structure of analysis of regional clusters by Bouwfonds
To measure market attractiveness Bouwfonds used a double-side filter technique which filters each region according to “opportunities” and “threats”. 7 categories were classified by scale (number of households, population density and GDP) and growth (in households and employment). Scale was considered more important than growth, as larger markets have greater supply of residential property and higher marketability, Bouwfonds (2009).
The assigned categories correspond to four levels of attractiveness (A1, A2, A3 and B), one neutral (C) and two of less attractive regions (D1 and D2). A1 represents the largest regions with above-average growth figures; A2 and A3 are the immediate sublevels with less growth and smaller in size. B represents the regions considerably smaller than previous ones but present the highest expected growth. Among the first 3 the ones that fulfill the criteria of category B are given an additional “+” designation. The region with the label A1+ is therefore the largest region with the highest expected growth.
18
Category C is a residual group not selected on the basis of the opportunities and threats filter and therefore are neutrally attractive. The last category D, is divided between D1 and D2, where D1 represents regions with low but positive growth but small in scale, and D2 represents regions with negative growth and are excluded based on their regional cluster classification.
The 2009 Bouwfonds report ranked 21 regional clusters with category A1 and A1+ (7 in France, 4 in Spain, 1 Finland , 1 Norway, 1 Netherlands, 1 Greece and 6 in Italy), from a total of 585 regions analyzed. Portugal had only one region at the A (A2 -Grande Lisboa).
6.4 Empiric Five-star ratings
The site Global Property Guide (GPG) has become a reference for residential-property investors world-wide and has been featured in International media in reference to local expert information which has been published. GPG compiles data from residential markets across 133 countries using local experts around the world to source information from the different expertise that are relevant to the understanding of the housing market, namely tax and legal, prices and yields, economic indexes and other relevant data.
The GPG uses 19 criteria to report the dynamic of individual real estate markets. According to the site prices and yields are references from prime areas in capital cities.
Market indicators presented by GPG are: Price/square meter; Rental Yields; Price/GDP per Cap; Roundtrip Cost; Rental Income Tax; Capital Gains Tax; House Price Change 1 Year; House Price Change 5 Years; House Price Change 10 Years; Landlord & Tenant Law (5 point rating); GDP Per Capita; GDP/Cap Growth 1 Year; GDP/Cap Growth 5 Year; Economic Freedom Rating (third party rating); Economic Freedom rating 5
19
Years; Competitiveness Rating (third party rating); Property Rights Index; Currency Overvaluation/ Undervaluation; and Taxes on Residents.
The above information allows readers of GPG site to evaluate arbitrarily the country attractiveness in respect to their investment intentions. Following the main purpose of this global site, which is providing residential buy-to-let investors with specific key performance indicators and general market information to support investment decisions in the local residential markets, GPG as developed a five-star rating based on 9 factors, considered to be the most relevant for decision-makers: Gross rental yield; Income tax; Capital gains tax; Round-trip transaction costs; Potential landlord and tenant problems; Long-term GDP growth; Potential over-supply; Affordability; and a view of long-term appeal to investors.
The rating from 5 to 0 stars classifies each country’s attractiveness from “Grab your bags and buy now” to “Burn your money instead”. The scoring is based on expert knowledge judgment from GPG team, sourced by the 19 variables listed that provide a general overview of each country.
6.5 Property Risk Scoring
The Investment Property Forum/Investment Property Databank back in 2000 high-lighted the need to improve the level of risk measures and respective communication from Asset and Fund managers and advisors to their clients. In the 2002 Carsberg Report on UK Residential Property Review supported the Red Book requirement for reporting a unique value, but stressed the importance of reporting the level of risk in all valuations. The report also emphasizes the importance of expressing risk especially in volatile markets, Adair & Hutchison, (2005).
20
In the last decade the subject of risk measurements has been taken more seriously and Fund managers have become more strategic in their approach, adopting risk analysis techniques used by business particularly in the equity markets, N. E. Hutchison et al (2005). In a research paper N. E. Hutchison et al (2005) presented a Property Risk Scoring (PRS) methodology to communicate risk to property investors. Previously, Sir Bryan Carsberg, a leading opinion-maker in the British residential sector, had recommended the use of a common methodology to report uncertainty and risk on property valuations, which according the authors reinforces the importance of a risk scoring system for the property sector, Adair & Hutchison, (2005).
Based on the D&B model, a five-point scoring system from 1 to 5 was applied, representing the risk assessment at the time of decision.
Following the D&B model the risk categories used by the authors were: “1” (minimal risk); “2” (lower than average risk); “3” (average risk); “4“ (greater than average risk); “5” ( high risk) and “-“ ( insufficient information). Based on the Carsberg report and IPD databank that highlighted 4 areas of greatest concern, the following areas were considered to be essential for risk assessment, Hutchison, Adair & Leheny (2005):
Market Transparency Risk. Information is crucial to access risk knowledge, as a dynamic market with transactions evidence will allow the valuer to conclude his work with 95% or more confidence, scoring therefore 1, while a valuation with little transaction evidence would score 5 as a result of greater uncertainty in the valuation.
Investment Quality Risk. A range of factors are pointed out as influential’s on the quality of the investment to be made, namely: income security; rental growth; lease length; rent review clause; user clause; repairing obligations;
21
location; sector bias; liquidity issues; management issues; overall economic context; national markets factors; local market factors; yield level/shift; asset volatility; letting ability; business risk; legislative risk; void period risk
Covenant Strength Risk. This is an important risk assessment which is commonly supported by third parties such as D&B.
Depreciation and Obsolescence Risk. Despite its less importance in the valuation framework, it could dictate a reduction in rental or capital value, especially in commercial buildings that are more sensitive to technology, environment or changes in business practices.
The PRS uses the Analytical Hierarchy Process (AHP) to calibrate each variable that composes the score. This technique has been used in many areas of study, such as auditing, portfolio selection, personal recruitment and budget allocation. AHP differs from other criteria decision making tools because it allows very complex, multi-dimensional problems to be structured in a clear systematic way N. E. Hutchison et al (2005).
6.6 AHP application in Property Investment
Lai & Fisher (2007) evaluated Foreign Property Investment in Taiwan with the intent of explaining how foreign investors select their investments by analyzing their decision framework. The output would measure the attractiveness of Taiwan in a global context and suggest the desirable environment to attract foreign investors.
According to the authors the Global Competitive Report (GPR), provided by the World Economic Forum and the World Competitiveness Yearbook (WCY), published by
22
International Institute of Management offer foreign investors the basic information for selecting property target markets.
As a nation doesn’t produce value on its own, in essence it provides a competitive framework that allows organizations to produce goods and services, which means that the right conditions to develop competitiveness among enterprises is based on the market attractiveness, Mohd Safian & Abdul Hadi (2011). Their research concluded that international investors are driven by the following factors: Economic, Social, Market, Political and Product. Each factor is composed by the following sub-criteria:
Economic factors: Operational risk; Land cost; National competitiveness; Economic development; Cost of salaries of real estate industry; Amount of foreign investment; National income;
Political factors: Political stability ; Government’s restrictions on investment in real estate market, Incentives tax; Government administration efficiency; Loan policy and interest rate; Foreign exchanges policy;
Market factors: Market size; Investment capital; Access to real estate information; Provision of professional service; Provision of infrastructure;
Social factors: Language communications, Labor supply; Educational standard of labor.
Products factors: Profit margin of products, Marketability of products, Special advantage of products
23
Between other relevant considerations they concluded that Economics factors are the major determinant for foreign investment in Taiwan followed by Political and market conditions.
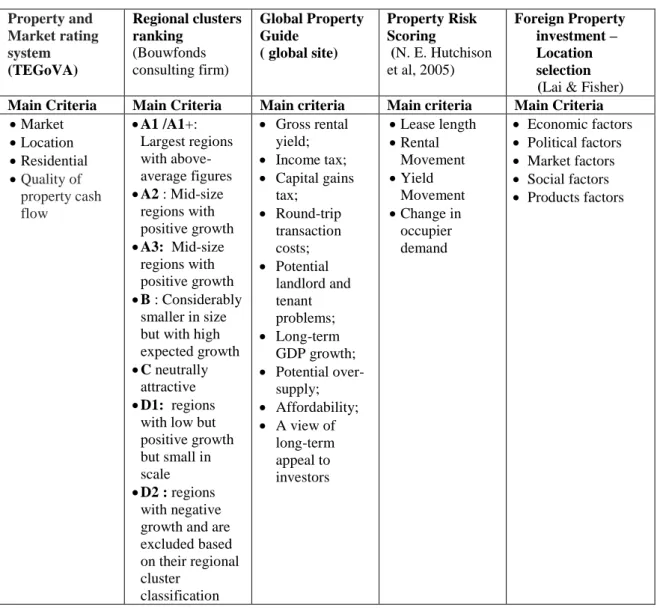
6.7 Summary and criteria selection
Table II: Summary and criteria selection
Property and Market rating system (TEGoVA) Regional clusters ranking (Bouwfonds consulting firm) Global Property Guide ( global site) Property Risk Scoring (N. E. Hutchison et al, 2005) Foreign Property investment – Location selection (Lai & Fisher) Main Criteria Main Criteria Main criteria Main criteria Main Criteria
Market Location Residential Quality of property cash flow A1 /A1+: Largest regions with above-average figures A2 : Mid-size regions with positive growth A3: Mid-size regions with positive growth B : Considerably smaller in size but with high expected growth
C neutrally attractive
D1: regions with low but positive growth but small in scale
D2 : regions with negative growth and are excluded based on their regional cluster classification Gross rental yield; Income tax; Capital gains tax; Round-trip transaction costs; Potential landlord and tenant problems; Long-term GDP growth; Potential over-supply; Affordability; A view of long-term appeal to investors Lease length Rental Movement Yield Movement Change in occupier demand Economic factors Political factors Market factors Social factors Products factors
Among the different methodologies presented to assess risk/investment opportunities the AHP method is in our opinion the most appropriate to the intended empirical study.
24 7 Analytical Hierarchy Process
7.1 Overview
The application of AHP begins with a problem being decomposed into a hierarchy of criteria in order to be more easily analyzed and compared (figure 1). After this logical hierarchy is constructed, decision-makers can systematically assess alternatives by making pair-wise comparisons for each of the chosen criteria. This comparison may use concrete data from the alternatives or human judgments as a way to input subjacent information, Saaty & Vargas (2001).
Figure 2: Example of the Analytical Hierarchy Process model
AHP converts empirical comparisons into numeric values that are further processed and compared. The weight of each variable allows the assessment of each element within a hierarchy creating a ranking framework. The process of pair-wise comparison is based on square matrix A, in which the set of elements are compared with itself, N. E. Hutchison et al. (2005)
Each element of A, aij, represents the level of importance of “i” compared to “j”
according to the 1-9 scale score. It is an assumption of AHP that aji is the inverse of aij
(ex: a12 = 7 then a21=1/7. The values on the diagonal of matrix A will obviously be unity
as a criterion is always of equal importance with itself, N. E. Hutchison et al. (2005).
(1) AHP Matrix A =
1 a12 a13 . . . a1n a21 1 a23 . . . a2n a31 a32 1 . . . a3n …. …. …. …. an1 an2 an3 . . . 1
25
“n” is the total number of criteria being analyzed through pair-wise comparison.
As a Decision Framework is an open source of different variables building up the problem, or in this case the solution to the problem, the relevance and added value of AHP is in the raking process of the criteria that sustain the decision.
Cognitive psychologists have recognized for some time that there are two kinds of comparisons that humans make: absolute and relative. In absolute comparisons, alternatives are compared with a standard or baseline which exists in one’s memory and has been developed through experience. In relative comparisons alternatives are compared in pairs according to common attribute. The AHP has been used with both types of comparisons to derive ratio scales of measurements, Saaty &Vargas (2001).
7.2 Questionnaire design and scale
Questionnaire design may lead to different results, Sato (2003, 2009). On a research to evaluate “the political attitude of citizens when the self-defense force was dispatched to a country in the state of warfare, two questionnaire methods, the Feeling Thermometer (FT) and the Analytical Hierarchy Process, were used simultaneously. Different questions formats yield different results, even though they were asking the exact same content. The research based on FT and AHP methods showed that both yielded a similar aggregated ranking of alternatives but in regression analysis, Feeling scores may not be effective in predicting respondent’s preferences. The results provide some evidence through regression and correlation analysis, that the Feeling Thermometer method might provide erroneous information and thus would not be appropriate for measuring human perception, Sato (2003, 2009).
26
AHP uses a fundamental scale that represents the intensity of judgments varying from Equal Importance - where two activities contribute equally to the objective; to Extreme Importance - where the participant favors one activity over another in the highest possible order, Saaty & Vargas (2001). See table 7 for reference on the scale used in the case study
7.3 Consistency
The redundancy of the pair-wise comparisons and scale of preferences will create some inconsistency among participants. Consistency is based on the transitive property where an element a is related to an element b, and b is in turn related to an element c, then a is also related to c. The judgment consistency of all participants is of major importance, has it represents reasoning in the judgment process.
Saaty´s algorithm that derives from the pair-wise comparison is known as Eigenvector, which determines the weight of a particular criterion towards the goal. This Eigenvector is a mathematical computing similar to Google’s Page Rank algorithm, which ranks the importance of web pages according to an eigenvector of a weighted link matrix. The inconsistency valuation is based on the Maximum Eigenvalue given by the following formula:
(2) Eigenvalue (λmax): ∑ Eigenvectork x ∑ aij (k=1,…n; i=1…n; j=1...n)
Saaty created a Consistency Index (CI) to measure the consistency level of the given judgment:
(3) CI = (λmax – n) / (n -1) “n” represents the number of evaluated criteria. In order to confirm if the Consistency Index is appropriate, Saaty suggests the use of a consistency rate (CR) which is determined by the ratio between the Consistency Index
27
and the Random Consistency Index (RI). The matrix will be considered consistent if the resulting ratio is less than 10%, Vargas (2010). The calculation is given by the following formula:
(4) CR = CI / RI < 0,1 ~10%
Table III: Random Index
8 Empirical study
8.1 Introduction
The competitiveness of the private rental sector depends on its ability to attract institutional, large and small private investors that look at the residential market as a sustainable and long term investment. To evaluate its competitiveness the following criteria were selected:
Table IV: Empirical study criteria
8.2 Criteria definition – Level 1
Gross rental yield: This criterion is referring to the gross annual rental income, expressed as a percentage of property purchase price, which a landlord can expect as return from his investment before taxes, maintenance fees and other costs.
Income tax: Direct taxes applicable to rental income. This criterion has an impact on the net yield and reflects the short term perspective of ROI.
Micro-environmental criteria Macro-environmental critera
Gross rental yield;
Income tax;
Capital gains tax;
Round-trip transaction costs;
Potential landlord and tenant problems;
Gross Domestic Product (GDP)
Risk of direct investment
Global Competitive index (GCI)
n 1 2 3 4 5 6 7 8 9 10
RI 0 0 0,58 0,9 1,12 1,24 1,32 1,41 1,45 1,49
28
Capital gains tax: Direct taxes applicable to the gains from selling the property. This criterion is associated with the time-period of the investment that normally reflects a long-term exposure to a certain market and respective exit strategy in terms of cost of that walking out from the market.
Round-trip transaction costs: Are referring to the total costs of buying and then re-selling a residential property, including all costs, namely, i) registration costs, ii) real estate agent fees, iii) legal fees, iv) sales and transfer taxes
Potential landlord and tenant problems: Level of justice or regulation associated with the rental sector in terms of the ability to resolve problems that might occur between Landlords and Tenants. This criterion is based on a rating system from Global Property Guide that rates Landlords and Tenants dynamics in the following categories i) strongly pro-landlord, ii) pro-Landlord; iii) neutral ; iv) pro-tenant; v) strongly pro-tenant;
On a macro-environmental perspective there are 2 major factors that dominate all others: Risk of Direct Investment and GDP growth. It means that in order for a country to be attractive it should be in the expansion phase and present low risk (Saaty & Vargas 2001).
GDP growth: measures each country ability to create wealth
Risk of Direct Investment: an indicator of credit worthiness, normally attributed by rating companies such as Moodys and Standard & Poors.
Considering the current macro-economic climate and anticipating some tendency to penalize countries that are in recession such as Portugal and Spain, we have added a third Macro-economic criterion, also used by GPG to rate individual countries.
Global Competitive Index (GCI): A criterion of measurement of the ability of countries to generate prosperity and wealth, i.e., how productively a country
29
uses available resources, namely Institutions , infrastructure, health and primary education, macro-economic environment, higher education and training, goods market efficiency, technological readiness, labor market efficiency, financial market development, market size, business sophistication and innovation. The Criteria selection was based on 3 major factors:
Be related to property investment in the residential sector
Be relevant to international property investment decisions
Be intuitive enough to simplify the decision process
8.3 Alternatives – Level 2
Six European countries were selected randomly to integrate this study. In order to prevent inconsistencies only capital cities were considered as potential target markets for buy-to-let investors. The selected countries were the following: Portugal, Spain, United Kingdom, Netherlands, France and Sweden.
Considering the location factor of real estate and the heterogeneity between countries pointed out in the European housing markets compared Bouwfonds (2009) reviewed on the first chapter, instead of using general statistics and national references for each country, we have collected a sample of 10 to 15 Apartments for sale and for rent in each capital city that would fit a budget of approximately €500,000. As residential property is easily leveraged our sample includes apartments above and below this price tag. The selection included apartments in the same street, zone or postal code in order to secure fair values for Gross Rental Yields. Only re-sales were considered to secure full transparency on the property prices.
30
No reference to historic heritage or strategic preference was considered in this assessment. As the object of this valuation is a residential property and respective rental market we assume that local supply-demand forces are driven by local socio-economic dynamics and not by any other factor.
For further information about the data used on each alternative please see Annex 1.
8.4 AHP Model
Figure 3: Empirical study AHP model
8.5 Scale
The pair-wise comparison uses Saaty scale that attributes values from 1 to 9 to determine the relative importance of one alternative compared to another alternative.
Table V: Case-study AHP scale, based on Saaty’s scale of relative importance
Scale Numerical rating Reciprocal
Extremely preferred 9 1/9
Very Strong preferred 7 1/7
Strongly preferred 5 1/5
Moderated preferred 3 1/3
Equally preferred 1 1
The usage of odd numbers secures a reasonable distinction between measures. The use of even numbers is only recommended to resolve measurement conflicts between evaluators. In this research we used the scale with odd numbers. On exceptional cases to create more consistency we have also used even numbers.
31
8.6 Survey results
The empirical study was structured in two phases in order to simplify the research but most of all for relevancy of the findings. The first phase focused on the preferred criteria to assess residential property investment risk in a buy-to-let perspective in a European context. We intended to rank the preferred criteria among European property professionals when advising clients or supporting the decision process towards investments opportunities in the residential sector at an international scale.
The second phase uses the collected data from individual countries related to each criteria (see annex 1) and follows the same mathematical computing process by ranking the alternatives accordingly. The output forms the ranking of alternatives in conjunction with the priority given by real estate professionals on the preferred criteria to assess risk in buy-to-let investments in a European context.
A survey was sent to property professionals associated with RICS, ULI and other real estate groups on Linkedin. Approximately 50 Invitations were sent directly to Winkworth senior managers in the United Kingdom. A prior phone conversation introduced the theme and objective of this research. Other property professionals, agents and landlords experienced in buy-to-let investments were also invited to participate. The survey also targeted potential property buyers in Portugal and an undetermined number of real estate professional students from Lisbon School of Economics - ISEG.
According to AYTM survey 699 professionals were targeted, 89 opened the survey and failed qualification. 52 have partially completed the survey and 47 have fully completed the survey.
32
Figure 4: Survey Statistics – Pie charts
All participants who registered a response and not a preference between criteria were excluded. The AYTM survey created an intuitive barometer which helped to visualize the pair-wise comparison but had some limitations. For the purpose of criteria ranking only 34 validated contributions were considered.
8.7 Comparison matrix output for the 1st level
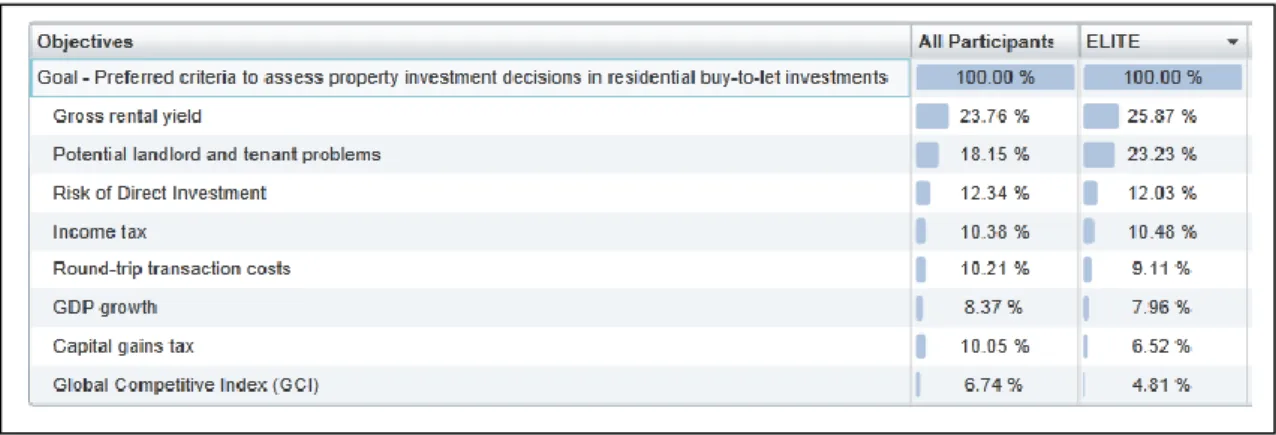
Table VI: Preferred criteria to assess property residential risk in a buy-to-let investment Expert Choice
33
The overall analysis of all 34 participants show that 23,76% of property professionals with experience in property investment have selected Gross rentals yields as the major criterion to support the assessment of residential property risk in a buy-to-let investment, followed by potential landlords and tenants problems and risk of direct investment with 18,15% and 12,34% respectively. Despite the overall consistency of all participants, at the individual level we have perceived less coherent contributions. The AHP calculation was based on the Expert Choice Comparion Suite, a powerful web-based software that supports the AHP methodology defined by Saaty in 1980.
8.8 Survey Consistency
Every time someone follows the transitive property when judging which criteria is preferred to assess property investment risk the results of the survey are considered consistent.
What we realized was that, at an individual level not all participants reached the levels of consistency required by AHP. According to Expert Choice management team feedback higher inconsistency levels are due to 3 main factors:
Lack to time to wisely balanced the preference of judgments.
Lack of ability to perform a judgment of such nature.
Lack of comprehension on what was required or didn’t understand the question.
It was also advisable not to force consistency, as in some cases inconsistency is not considered incorrect despite going beyond Saaty’s metric of 0,1. According to Expert Choice feedback, since relative judgments are subjective it’s not incorrect to accept judgments that don’t follow the transitive property to some degree. It depends on the subject itself and participant. For lack of better judgment we decided to have one-o-one
34
sessions with some participants over the phone and others live, in order to guarantee full comprehension and debate of the subject being evaluated.
Table VII: Consistency Adjustment table - Preferred criteria to assess property residential risk in a buy-to-let investment – Expert Choice software output
The group ELITE represents the opinion of 10 Real Estate Professionals of senior level that accomplish the survey with inconsistency levels bellow 0,1. This group presents the following geo-participation: 1 Dutch, 1 Canadian, 1 British and 7 Portuguese.
The results don’t differ too greatly from the global valuation but emphasize major concerns with yields and level of regulation within the sector. Curiously GDP growth and GCI both representing structural sustainability at a macro level have been pushed to the last positions, anticipating that investors are more sensitive to criteria that have an immediate effect on their investment. Notwithstanding the above, “risk of direct investment”, a macro level criterion, is ranked 3rd reflecting major concern about the economic solvability of the destination markets.
The valuation of the 1st hierarchal level intends to determine the relative importance between criteria and also their relative weight to the global goal, Vargas (2010). The 2nd phase in the empirical study evaluates each criteria relative weights with the second level in the hierarchy following the same mathematical computing process.
35
8.9 Determining the comparison matrix, the Eigenvector and the consistency for the 2nd level in the hierarchical model
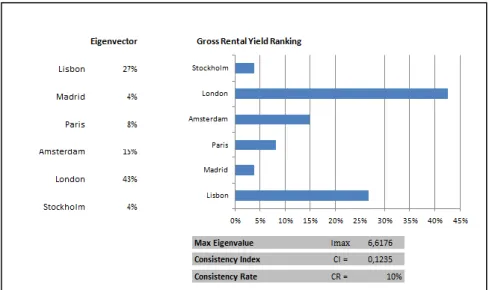
Table VIII: Comparison matrix for gross rental yield
The matrix normalization is made by dividing each table value by the total sum of the respective column. The Eigenvector calculation is obtained by the sum of each row divided by the number of alternatives.
Figure 5: Priority results chart for the Alternatives according to gross rental yield and respective consistency level
The consistency rate is calculated using the formula CR = CI / RI where CI = (0,1235) and RI = (1,24). Review consistency calculation in chapter 3.3.
Please see Annex 2 for full calculation process.
8.10 Empiric study results and ranking calculation process
Gross Rental
Yield (5.1%-5,7%)Lisbon (3,5%-3,9%)Madrid (3,9%-4,3%)Paris (4,8%-5,3%)Amsterdam (5,8%-6,4%)London (3,5%-3,9%)Stockholm
Lisbon (5.1%-5,7%) 1 7 5 3 1/3 7 Madrid (3,5%-3,9%) 1/7 1 1/3 1/5 1/7 1 Paris (3,9%-4,3%) 1/5 3 1 1/3 1/5 3 Amsterdam (4,8%-5,3%) 1/3 5 3 1 1/5 5 London (5,8%-6,4%) 3 7 5 5 1 7 Stockholm (3,5%-3,9%) 1/7 1 1/3 1/5 1/7 1
36
The final mathematical calculation is made by crossing product priorities with alternatives. Each criteria weight is therefore multiplied by the correspondent alternative weight obtained in the Eigenvector process calculation. Please see Annex 3 for further details. The overall results and final ranking of countries is obtained by the sum of the referred product. The following picture demonstrates individual competitiveness in the rental sector is a buy-to-let perspective:
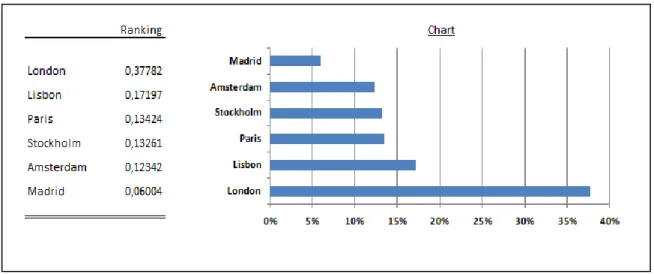
Figure 6: Ranking results that demonstrates residential private rental sector competitiveness on a buy-to-let perspective in an European context – 6 countries empirical study.
This ranking shows that London represents the most competitive residential private rental market, ranking higher in the hierarchy and collecting +37% of investor’s
preference among the 6 alternative market destinations. The results also emphasize that London is approximately 3 times more competitive than Stockholm, Paris and
Amsterdam. Lisbon is second in the ranking supported by higher yields and a neutral but favourable landlords & tenants law overview, without considering risk.
9 Final conclusions
The subject of competitiveness can have different methodological approaches
37
the need to support decision-makers to assess operational, strategic and financial
problems. In the real estate industry, at any level, investment decisions have a long term impact, as the real estate market is considerably inelastic when compared to financial markets as an example. The tipping point for any real estate investor is at decision-making, where absolute and relative judgments are made.
The AHP methodology used in our empirical study has a wide application from portfolio management & investment to customer satisfaction & cost/benefit analysis. The method breaks-down the problem into a hierarchy of elements, both tangible and intangible, and allows decision-makers to reflect on complex problems and build an open decision-framework to support their judgments.
The empirical study analysed 6 European countries and used 8 criteria to assess residential property investment risk in a buy-to-let investment decision. Despite the political and socio-economic diversity which would indicate more heterogeneity between criteria, 49% of investor’s priorities when assessing risk go to Gross rental yield and Potential landlords and tenants problems. This emphasizes the fact that a country’s ability to attract international investors towards the residential rental market is heavily dependent on “yields” and the level of justice-solving for “landlords and tenants problems”. Short term tax structure takes 4th place (10,48%) and long term takes 7th (6,52%). Economic factors such as “risk of direct investment”, “GDP growth” and “Global competitiveness” are ranked 3rd
, 5th and 8th, respectively. The current economic crises enhance the importance given to sovereign risk, ranking this criterion at 3rd place, but only contributing with 12% to the ranking structure.
The overall competitive ranking shows London as the best positioned city to attract international buy-to-let investors. Based on our market research and collected data
38
London offers higher yields and is more supportive of landlords in disputes with tenants. The tax structure is also very competitive but its contribution to the overall decision is small. Lisbon is ranked in 2nd position benefiting from good returns and from a neutral rating in landlords and tenants problem-solving. The recent legislation change in Portugal has given greater power to landlords to deal with tenants’ problems, but as traditionally Portuguese courts favour tenants in rental disputes the neutral rating represents a more realist approach to the new Portuguese tenant’s law.
One of the drawbacks that we incurred in the empirical study was the lack of consistency in a first survey, which led us to host live interviews to secure full
comprehension of the problem and debate. Our analysis shows that the median for time spent by participants was 6 minutes and 53 seconds, and up to 5 minutes in the 1st Quartile and up to 9 minutes in the 3rd. Despite the survey simplicity, based on common criteria for risk assessment easily comprehended by experienced professionals, the inconsistency levels were too high. In our opinion this shouldn’t be perceived as
negative factor of AHP methodology, but as a natural constraint of cognitive judgments. The results show that insufficient information, despite being a common subject among participants, or lack of time influences the consistency level. The live sessions were longer than 30 minutes and the result was considerably positive with all participants showing great level of consistency. We recommend further study on this topic as our empirical study alone won’t be sufficient to sustain a scientific opinion about the live sessions vs. enquiries in terms of consistency levels.
Our preference on the application of AHP goes to live meetings with participants, providing a full brief of the topic and exploratory discussions to formulate consensus. The AHP is particularly well structured to support decision-makers on complex
39
problems, assuming that the participant is someone with great knowledge about the problem and is willing to dedicate some of his time to the subject.
The assessment of property risk investment and a country’s competitiveness using the AHP methodology in our opinion deserves further investigation. By breaking down a problem into layers the model can be structured up to 4 levels without losing its simplicity. For a more profound assessment we recommend the use of the following criteria: Investment Quality, Return on Investment, Strategic positioning and Management with subsequent sub-criteria. Depending of the study objective the alternatives can be extended to cover all European countries or cities for a similar competitiveness ranking. In the case of an Investment fund looking to build a portfolio of properties the alternatives could reach the level of economic clusters or property class and type. AHP is also a rich solution-structure for problems where consensus needs to be created among participants, examples being planning of multi-use resorts, shopping malls or public tenders just in the in the real estate industry.
40
10 Annexes
41
10.1 Annex 1 Alternative Data
Table XIX: Alternatives data
Criteria \ Countries Portugal (Lisbon) Spain (Madrid) France (Paris) Netherlands (Amsterdam) Sweden (Stockholm) United Kingdom (London) Gross rental yield 5.1% - 5,7% 3,5% - 3,9% 3,9% - 4,3% 4,8% - 5,3% 3,5% - 3,9% 5,8% - 6,4% Income tax 16,5% 24% 10% 30% 22,76 - 28,4% 20% Capital gains tax 25% 21% 33,33% 30% 30% 0% to 28%* Round trip transaction costs 5,63%-16,05% 10,66% - 14,24% 11.06% - 19.35% 10,52% - 13,74% 4.51% - 7.50% 2,89 - 9,26% Potential Landlord and Tenant problems Neutral** Based on new law from 2012 (Lei 21/2012, 14th of August) Strongly pro-tenant Based on GPG rating system Pro-tenant Based on GPG rating system Pro-tenant Based on GPG rating system Strongly pro-tenant Based on GPG rating system Pro-landlord Based on GPG rating system Gross Domestic Product Growth (GDP growth) *Eurostat 2011: -1,6% 2012: -3,3% (f) 2011: 0,7% 2012: -1,8% (f) 2011: 1,7% 2012: 0,5% (f) 2011: 1,2% 2012: -0,9% (f) 2011: 3,9% 2012: 0,3%(f) 2011: 0,7% 2012: 0,5% (f) Risk of direct investment (S&P ratings) BB Less vulnerable in the near-term but faces major ongoing uncertainties to adverse business, financial and economic conditions BBB+ Adequate capacity to meet financial commitments, but more subject to adverse economic conditions AA+ Very strong capacity to meet financial commitments. AAA Extremely strong capacity to meet financial commitments. Highest Rating AAA Extremely strong capacity to meet financial commitments. Highest Rating AAA Extremely strong capacity to meet financial commitments. Highest Rating Global Competitive Index (GCI) Years 2011-12 4.4 score ( 1 to 7) 45th position in the countries rank (out of 142) 4.5 score ( 1 to 7) 36th position in the countries rank (out of 142) 5.1 score ( 1 to 7) 18th position in the countries rank (out of 142) 5.4 score ( 1 to 7) 7th position in the countries rank (out of 142) 5,6 score ( 1 to 7) 3th position in the countries rank (out of 142) 5,4 score ( 1 to 7) 10th position in the countries rank (out of 142)
* Assumption: Individuals who are not resident in the UK are not liable to capital gains tax on the sale of UK property unless they have been resident in the UK within the past five years. For the purpose of this study we assume that investors were non-residents and benefit from the exemption of capital gains tax. Source: Global Property Guide
**Assumption: We have decided to allocate a different rating to Portugal Landlord & Tenants problems criterion due to the recent legislation approved by the Portuguese
42
government, not yet reflected in the GPG rating system. In our opinion the current legislation introduces more fairness between Landlords & Tenants. In general the new law favors Landlords, but by tradition Portugal justice is biased towards tenants and therefore we have decided to classify it with a neutral rating.
43
10.2 Annex 2 - Determining the comparison matrix, the Eigenvector and the consistency for the 2nd level in the hierarchical model
Table VIII: Comparison matrix For gross rental yield,
normalization process, and Eigenvector
Figure 5: Priority results chart for the Alternatives according to Gross Rental Yield and consistency level
Gross Rental Yield Lisbon (5.1%-5,7%) Madrid (3,5%-3,9%) Paris (3,9%-4,3%) Amsterdam (4,8%-5,3%) London (5,8%-6,4%) Stockholm (3,5%-3,9%) Lisbon (5.1%-5,7%) 1 7 5 3 1/3 7 Madrid (3,5%-3,9%) 1/7 1 1/3 1/5 1/7 1 Paris (3,9%-4,3%) 1/5 3 1 1/3 1/5 3 Amsterdam (4,8%-5,3%) 1/3 5 3 1 1/5 5 London (5,8%-6,4%) 3 7 5 5 1 7 Stockholm (3,5%-3,9%) 1/7 1 1/3 1/5 1/7 1 Total 4,82 24,00 14,67 9,73 2,02 24,00
Normalization dividir cada peso pelo valor total de cada coluna
Lisbon 0,208 0,292 0,341 0,308 0,165 0,292 Madrid 0,030 0,042 0,023 0,021 0,071 0,042 Paris 0,042 0,125 0,068 0,034 0,099 0,125 Amsterdam 0,069 0,208 0,205 0,103 0,099 0,208 London 0,623 0,292 0,341 0,514 0,495 0,292 Stockholm 0,030 0,042 0,023 0,021 0,071 0,042
Priority vector or Eigenvector
Calculation Eigenvector Lisbon 0,2675 26,8% Madrid 0,0378 3,8% Paris 0,0822 8,2% Amsterdam 0,1487 14,9% London 0,4260 42,6% Stockholm 0,0378 3,8%
44
Table X: Comparison matrix for Income Tax,
normalization process and Eigenvector
Figure 7: Priority results chart for the Alternatives according to Income Tax and respective consistency level
Income
Tax (16,5%)Lisbon Madrid (24%) (10%)Paris Amsterdam (30%) London (20%) (22,7-28,4%)Stockholm
Lisbon (16,5%) 1 5 1/3 5 3 5 Madrid (24%) 1/5 1 1/5 3 1/3 1 Paris (10%) 3 5 1 7 5 5 Amsterdam (30%) 1/5 1/3 1/7 1 1/5 1/3 London (20%) 1/3 3 1/5 5 1 3 Stockholm (22,7-28,4%) 1/5 1 1/5 3 1/3 1 Total 4,93 15,33 2,08 24,00 9,87 15,33
Normalization dividir cada peso pelo valor total de cada coluna
Lisbon 0,203 0,326 0,161 0,208 0,304 0,326 Madrid 0,041 0,065 0,096 0,125 0,034 0,065 Paris 0,608 0,326 0,482 0,292 0,507 0,326 Amsterdam 0,041 0,022 0,069 0,042 0,020 0,022 London 0,068 0,196 0,096 0,208 0,101 0,196 Stockholm 0,041 0,065 0,096 0,125 0,034 0,065
Priority vector or Eigenvector
Calculation Eigenvector Lisbon 0,2546 25,5% Madrid 0,0710 7,1% Paris 0,4234 42,3% Amsterdam 0,0358 3,6% London 0,1441 14,4% Stockholm 0,0710 7,1%
45
Table XI Comparison matrix for Capital Gains Tax, normalization process and Eigenvector
Figure 8: Priority results chart for the Alternatives according to Capital Gains tax and respective consistency level Capital Gains Taxes Lisbon (25%) Madrid (21%) Paris (33,33%) Amsterdam (30%) London (0%-28% Stockholm (30%) Lisbon (25%) 1 1/3 5 3 1/5 3 Madrid (21%) 3 1 5 5 1/5 5 Paris (33,33%) 1/5 1/5 1 1/2 1/9 1/2 Amsterdam (30%) 1/3 1/5 2 1 1/7 1 London (0%-28% 5 5 9 7 1 7 Stockholm (30%) 1/3 1/5 2 1 1/7 1 Total 9,87 6,93 24,00 17,50 1,80 17,50
Normalization dividir cada peso pelo valor total de cada coluna
Lisbon 0,101 0,048 0,208 0,171 0,111 0,171 Madrid 0,304 0,144 0,208 0,286 0,111 0,286 Paris 0,020 0,029 0,042 0,029 0,062 0,029 Amsterdam 0,034 0,029 0,083 0,057 0,080 0,057 London 0,507 0,721 0,375 0,400 0,557 0,400 Stockholm 0,034 0,029 0,083 0,057 0,080 0,057
Priority vector or Eigenvector
Calculation Eigenvector Lisbon 0,1353 13,5% Madrid 0,2232 22,3% Paris 0,0350 3,5% Amsterdam 0,0566 5,7% London 0,4932 49,3% Stockholm 0,0566 5,7%
Assumption: Individuals who are not resident in the UK are not liable to capital gains tax on the sale of UK property unless they have been resident in the UK within the past five years. For the purpose of this study we assume that investors were non-residents and benefit from the exemption of capital gains tax. Source: Global Property Guide
46
Table XII Comparison matrix for Round-trip transaction costs, normalization process, and Eigenvector
Figure 9: Priority results chart for the Alternatives according to Round-trip Transaction Costs and respective consistency level
Round-trip
transation costs (5,6%-16,0%)Lisbon (10,6%-14,2%)Madrid (11.0%-19.3%)Paris (10,5%-13,7%)Amsterdam (2,89%-9,26%)London (4.5%-7.5%)Stockholm
Lisbon (5,6%-16,0%) 1 5 5 3 1/5 1/3 Madrid (10,6%-14,2%) 1/5 1 3 1 1/5 1/5 Paris (11.0%-19.3%) 1/5 1/3 1 1/3 1/7 1/5 Amsterdam (10,5%-13,7%) 1/3 1 3 1 1/5 1/5 London (2,89%-9,26%) 5 5 7 5 1 1 Stockholm (4.5%-7.5%) 3 5 5 5 1 1 Total 9,73 17,33 24,00 15,33 2,74 2,93
Normalization dividir cada peso pelo valor total de cada coluna
Lisbon 0,103 0,288 0,208 0,196 0,073 0,114 Madrid 0,021 0,058 0,125 0,065 0,073 0,068 Paris 0,021 0,019 0,042 0,022 0,052 0,068 Amsterdam 0,034 0,058 0,125 0,065 0,073 0,068 London 0,514 0,288 0,292 0,326 0,365 0,341 Stockholm 0,308 0,288 0,208 0,326 0,365 0,341
Priority vector or Eigenvector
Calculation Eigenvector Lisbon 0,1636 16,4% Madrid 0,0683 6,8% Paris 0,0372 3,7% Amsterdam 0,0705 7,1% London 0,3542 35,4% Stockholm 0,3061 30,6%
47
Table XIII: Comparison matrix for Potential Landlords & Tenants Problems, normalization process and Eigenvector and
Figure 10: Priority results chart for the Alternatives according to Potential Landlords and Tenants Problems and respective consistency level Potential Landlord & Tenants problems Lisbon (Neutral) Madrid (Strongly pro-tenant) Paris (pro-tenant) Amsterdam (pro-tenant) London (Strongly pro-landlord) Stockholm (Strongly pro-tenant) Lisbon (Neutral) 1 5 3 3 1/5 5 Madrid (Strongly pro-tenant) 1/5 1 1/3 1/3 1/9 1 Paris (pro-tenant) 1/3 3 1 1 1/7 3 Amsterdam (pro-tenant) 1/3 3 1 1 1/7 3 London (Strongly pro-landlord) 5 9 7 7 1 9 Stockholm (Strongly pro-tenant) 1/5 1 1/3 1/3 1/9 1 Total 7,07 22,00 12,67 12,67 1,71 22,00
Normalization dividir cada peso pelo valor total de cada coluna
Lisbon 0,142 0,227 0,237 0,237 0,117 0,227 Madrid 0,028 0,045 0,026 0,026 0,065 0,045 Paris 0,047 0,136 0,079 0,079 0,084 0,136 Amsterdam 0,047 0,136 0,079 0,079 0,084 0,136 London 0,708 0,409 0,553 0,553 0,586 0,409 Stockholm 0,028 0,045 0,026 0,026 0,065 0,045
Priority vector or Eigenvector
Calculation Eigenvector Lisbon 0,1978 19,8% Madrid 0,0395 3,9% Paris 0,0936 9,4% Amsterdam 0,0936 9,4% London 0,5361 53,6% Stockholm 0,0395 3,9%
48
Table XIV Comparison matrix for GDP Growth, normalization process and Eigenvector
Figure 11: Priority results chart for the Alternatives according to GDP Growth and respective consistency level Gross Domestic Product Growth Lisbon 2011: -1,6% 2012: -3,3% (f) Madrid 2011: 0,7% 2012: -1,8% (f) Paris 2011: 1,7% 2012: 0,5% (f) Amsterdam 2011: 1,2% 2012: -0,9% (f) London 2011: 0,7% 2012: 0,5% (f) Stockholm 2011: 3,9% 2012: 0,3%(f) Lisbon 2011: -1,6% 2012: -3,3% (f) 1 1/3 1/9 1/5 1/7 1/9 Madrid 2011: 0,7% 2012: -1,8% (f) 3 1 1/7 1/3 1/5 1/7 Paris 2011: 1,7% 2012: 0,5% (f) 9 7 1 5 2 1/3 Amsterdam 2011: 1,2% 2012: -0,9% (f) 5 3 1/5 1 1/4 1/5 London 2011: 0,7% 2012: 0,5% (f) 7 5 1/2 4 1 1/3 Stockholm 2011: 3,9% 2012: 0,3%(f) 9 7 3 5 3 1 Total 34,0 23,3 5,0 15,5 6,6 2,1
Normalization dividir cada peso pelo valor total de cada coluna
Lisbon 0,029 0,014 0,022 0,013 0,022 0,052 Madrid 0,088 0,043 0,029 0,021 0,030 0,067 Paris 0,265 0,300 0,202 0,322 0,303 0,157 Amsterdam 0,147 0,129 0,040 0,064 0,038 0,094 London 0,206 0,214 0,101 0,258 0,152 0,157 Stockholm 0,265 0,300 0,606 0,322 0,455 0,472
Priority vector or Eigenvector
Calculation Eigenvector Lisbon 0,0255 2,6% Madrid 0,0465 4,7% Paris 0,2582 25,8% Amsterdam 0,0854 8,5% London 0,1812 18,1% Stockholm 0,4031 40,3%
49
Table XV: Comparison matrix for Preference Against Risk of Direct Investment, normalization process, and Eigenvector
Figure 12: Priority results chart for the Alternatives according to Preference Against Risk of Direct Investment preference and respective consistency level Preference Against Risk of Direct Investment Lisbon BB Madrid BBB+ Paris AA+ Amsterdam AAA London AAA Stockholm AAA Lisbon BB 1 1/5 1/7 1/9 1/9 1/9 Madrid BBB+ 5 1 1/5 1/7 1/3 1/7 Paris AA+ 7 5 1 1/3 1/3 1/3 Amsterdam AAA 9 7 3 1 1 1 London AAA 9 3 3 1 1 1 Stockholm AAA 9 7 3 1 1 1 Total 40,00 23,20 10,34 3,59 3,78 3,59
Normalization dividir cada peso pelo valor total de cada coluna
Lisbon 0,025 0,009 0,014 0,031 0,029 0,031 Madrid 0,125 0,043 0,019 0,040 0,088 0,040 Paris 0,175 0,216 0,097 0,093 0,088 0,093 Amsterdam 0,225 0,302 0,290 0,279 0,265 0,279 London 0,225 0,129 0,290 0,279 0,265 0,279 Stockholm 0,225 0,302 0,290 0,279 0,265 0,279
50
Table XVI: Comparison matrix for Global Competitive Index, normalization process, and Eigenvector
Figure 13: Priority results chart for the Alternatives according Global Competitive Index and respective consistency level Global Competitive Index (1 to 7 score) Lisbon 4.4 score Madrid 4.5 score Paris 5.1 score Amsterdam 5.4 score London 5,6 score Stockholm 5,4 score Lisbon 4.4 score 1 1/2 1/5 1/6 1/7 1/6 Madrid 4.5 score 2 1 1/5 1/6 1/7 1/6 Paris 5.1 score 5 5 1 1/3 1/5 1/3 Amsterdam 5.4 score 6 6 3 1 1/3 1 London 5,6 score 7 7 5 3 1 3 Stockholm 5,4 score 6 6 3 1 1/3 1 Total 27,00 25,50 12,40 5,67 2,15 5,67
Normalization dividir cada peso pelo valor total de cada coluna
Lisbon 0,037 0,020 0,016 0,029 0,066 0,029 Madrid 0,074 0,039 0,016 0,029 0,066 0,029 Paris 0,185 0,196 0,081 0,059 0,093 0,059 Amsterdam 0,222 0,235 0,242 0,176 0,155 0,176 London 0,259 0,275 0,403 0,529 0,465 0,529 Stockholm 0,222 0,235 0,242 0,176 0,155 0,176
Priority vector or Eigenvector
Calculation Eigenvector Lisbon 0,0330 3,3% Madrid 0,0424 4,2% Paris 0,1121 11,2% Amsterdam 0,2012 20,1% London 0,4101 41,0% Stockholm 0,2012 20,1%