Brand Placement on Social Media
Influencer Content
Filipe Emanuel Ferreira Tavares
152116197
Dissertation submitted in partial fulfilment of requirements for the degree of
MSc in Management at Católica-Lisbon School of Business & Economics
Thesis written under the supervision of Ana Isabel de Almeida Costa
January 2018
ABSTRACT
For some years now, social networks have gained increasing importance for corporate marketing, becoming a space where not only people but also brands can play an active role and communicate themselves with their target audience, gaining not only greater visibility but also strengthening relations with consumers.
Regarding marketing strategies to be used in social networks, the placement of brands in the contents published by the so-called social media Influencers is one of the techniques that arouses greater interest, not only due to the high number of followers they have, as well as the influence that they exert on them, allowing brands to gain more visibility and involvement from consumers.
Therefore, this dissertation aims at analyzing the factors related to the production and design of the content to be published in the social network Instagram, as well as the characteristics of the Influencers, that have more impact in the performance of this type of marketing strategies. Among several conclusions to be drawn from the study, it should be noted that the presence of Influencer in published content has a positive effect on the performance of the campaigns in question. In addition, influencers’ characteristics affect the way we perceive brands, in which there is a tendency for people who are exposed to these types of marketing strategies to associate the Influencers’ attributes to the brand.
SUMÁRIO
De alguns anos a esta parte as redes sociais têm ganho uma importância crescente para o marketing das empresas, passando a ser um espaço onde não só as pessoas como também as marcas podem ter um papel ativo e elas próprias comunicarem com o seu público-alvo, ganhando não só maior notoriedade como permite fortalecer as relações com os consumidores. No que se refere a estratégias de marketing a serem usadas nas redes sociais, a colocação das marcas nos conteúdos publicados pelos chamados social media Influencers é uma das técnicas que suscita maior interesse, não só devido ao numero elevado de seguidores que estes têm como também pela influencia que exercem sobre eles, permitindo às marcas ganhar mais visibilidade e envolvimento por parte dos consumidores.
Posto isto, esta dissertação visa analisar quais os fatores relacionados com a produção e design dos conteúdos a serem publicados na rede social Instagram, bem como as próprias características dos Influencers, que mais impacto têm na performance deste tipo de estratégias de marketing.
De entre várias conclusões a retirar do estudo elaborado, importa salientar que a presença do
Influencer no conteúdo publicado tem um efeito positivo na performance das campanhas em
questão. Para além disso, as características dos influencers afetam a forma como percecionamos as marcas, havendo uma tendência para as pessoas que são expostas a este tipo de estratégias de marketing, associarem os atributos da pessoa à marca.
TABLE OF CONTENTS
1. CHAPTER 1: INTRODUCTION ... 10
1.1 Background and Problem Statement ... 10
1.2 Aim and Scope... 11
1.3 Research Methods... 11
1.4 Relevance ... 12
1.5 Dissertation Outline ... 12
2. CHAPTER 2: LITERATURE REVIEW AND RESEARCH HYPOTHESES ... 13
2.1. Social media marketing ... 13
2.2. Influencer Marketing ... 14
2.3. Brand Placement ... 15
2.4. Consumers’ response to advertising and brand placement ... 16
2.5. Determinants that affect the popularity of an advertisement ... 17
2.6. Consumer psychology ... 18
2.7. Conclusions and Research Hypothesis ... 19
3. CHAPTER 3: METHODOLOGY ... 21
3.1. Research Approach ... 21
3.2. Secondary Data: Collection ... 21
3.3. Secondary data - Data Analysis and Preparation ... 22
3.3.1. Dependent Variables ... 22
3.3.2. Independent Variables ... 22
3.3.3. Linear Regression Analysis ... 24
3.3.4. Binary Regression ... 25
3.4. Quantitative Primary data ... 25
3.4.1. Paired Sample T-test ... 26
3.4.3. Bivariate and regression analysis ... 27
4. CHAPTER 4: RESULTS AND DISCUSSION ... 28
4.1. Quantitative Secondary Data ... 28
4.1.1. Normality test ... 28
4.1.2. Descriptive Statistics ... 30
4.1.3. Linear Regression Results ... 33
4.1.4. Binary Logistic Results ... 37
4.2. Quantitative Primary Data ... 39
4.2.1. Sample Screening ... 39
4.2.2. Paired sample t-test: attributes ... 40
4.2.3. Repeated measures ANOVA ... 41
4.2.4. Bivariate and linear regression analysis - Willingness-to-buy ... 43
4.2.5. Frequencies of clicks on the images by the main elements ... 45
4.3. Summary of results ... 46
5. CHAPTER 5: CONCLUSIONS AND LIMITATIONS ... 48
5.1. Conclusions ... 48
5.2. Limitations and Future Research ... 50
TABLE OF FIGURES
Fig. 1: Histograms of the variables “Likes” and “Comments”………...28 Fig. 2: Histograms of the variable “ln_likes”………29
TABLE OF TABLES
Table 1: Independent variables and their categories and respective codification………….…23
Table 2: Fit brand/influencer variable and its categories and respective explanation…….….23
Table 3: “Influence presence”, “Colours balance and “Elements balance” variables and their categories ………..24
Table 4: Comments class variable………....25
Table 5: Results of Kolmogorov-Smirnov and Shapiro-Wilk tests of normality of “likes” and “Comments”………..29
Table 6: descriptive statistics of the variables “likes”, “ln_likes, “Comments” and “Comments_class”………....30
Table 7: frequencies of the independent variables………....31
Table 8: mean of dependent variables of each category of independent variables…………...32
Table 9: overall quality of model 2 of linear regression………34
Table 10: global significance of the model 2 of the linear regression model………34
Table 11: Results of Linear regression - model 2 ………36
Table 12: overall quality of the model ……….37
Table 13: Variables significance and coefficients in the binary logistic model ……….38
Table 14: Paired sample results ………..40
Table 15: Descriptive statistics for the variables “Appeal”, “Fit” and “Framing” …………..41
Table 16: Mauchly’s test - Sphericity assumption ………...41
Table 17: Repeated measures - results ……….42
Table 18: Pearson correlation results -covariates ………43
Table 19: Pearson correlation results - fit, appeal and framing ………43
Table 20: Linear regression coefficients ……….44
TABLE OF ANNEXES
Annex 1: Instagram penetration rate and visits ……….…..…54
Annex 2: Photos used in the Survey: Photo 1 (upper left), Photo 2 (upper right), Photo (bottom left) and photo 4 (bottom right) ……….…………...….54
Annex 3: Online Survey ……….…..55
Annex 4:Normal Q-Q Plots of the variables “Likes” and “Comments” ………...63
Annex 5: Frequencies of screening questions ……….………….…...64
Annex 6: Pairwise Comparisons ………..65
GLOSSARY
WTB - Willingness to buy is the amount of money that an individual is willing to pay for a product or service
SMS - Social Media Sites are online communication channels dedicated to network creation, interaction, content-sharing and collaboration
FMCG - Fast Moving Consumer Goods are consumer goods products that sell quickly at relatively low cost
SNM - Social Networked Media is another definition of social media sites.
WOM - Word of Mouth is an unpaid form of promotion in which satisfied customers tell other people how much they like a business, product or service
FTC - Federal Trade Commission is a United States federal regulatory agency designed to monitor and prevent anticompetitive, deceptive or unfair business practices
USA - United States of America
CTR - Click-through Rate The percentage of individuals viewing a web page who click on a specific advertisement that appears on the page.
K-S - Kolmogorov-Shapiro test is a non-parametric test used to verify if a certain variable follows a normal distribution.
1.
CHAPTER 1: INTRODUCTION
1.1 Background and Problem Statement
Individuals and brands are more connected than ever before and this is largely due to the rise of the digital world, where Social Networked Media (SNM) platforms, dedicated to interaction, content-sharing, collaboration and community-creation online, start to play a major role. SNM paved the way to permission marketing, in which consumers agreed to be involved in an organization’s marketing activities, as opposed to the traditional interruption marketing driven by mass advertising.
Major SNM platforms are businesses that started with the goal of enabling groups of individuals to represent themselves in the digital world and establish connections with others. Some of these represent themselves and interact with others to such an extent that they gain great visibility and develop their own community of followers, coming to influence their opinions and behaviours. Such users have been coined “Influencers” and are essentially content creators who accumulated a solid base of followers and whom, through blogging, vlogging or creating short-form content, provide their audiences with an insight into their personal everyday lives, their experiences, and opinions (Veirman, Cauberghe & Hudders, 2017).
Influencers behave to a certain extent very much like brands, since they also have to create strong, favourable, unique and relevant associations in the minds of their followers in order to differentiate themselves from other entities (Khamis, Ang & Welling, 2016). Moreover, most successful influencers are followed online by millions of people. This represents a unique opportunity for companies and brands to target large digital audiences with a well-defined profile, so many influencers are nowadays paying to present or endorse brands in their social media content. Yet, little is known about the effectiveness of this new form of advertising or psychological mechanisms by which consumers may (or may not) respond to branded influencer content. The truth is that is in the digital space that opinions are formed and purchase decisions are made (Reed, 2017), and although traditional forms of marketing (e.g. Television and display ads) still constitutes a good way to reach large audiences, the paradigm of marketing in companies is changing. The goal is no longer get as much reach as possible but reach the right target instead, so traditional marketing forms may do not serve this purpose, which could be conquered through the use of social media, more specifically by using a brand placement and influencers endorsement strategy.
1.2 Aim and Scope
The general aim of this dissertation is to understand how consumers react to branded influencer content and what this may imply to the strategies and tactics of c brands. To achieve this aim, the following research questions are addressed:
1. Considering brand placement on Instagram Influencers’ content, which factors related to the production of content and what characteristics of the Influencer impacts the most brand engagement?
2. To what extent, this social media marketing strategy affects the perceived characteristics of the brand by individuals and what is the impact on the Willingness-to-buy (WTB) of a product?
This dissertation is focused on Instagram since it is in this social media network that most of the Influencers are and act, and because is one of the Social Media Sites (SMS) that has a higher penetration rate in the last years and also the most engaging social networks (Annex 1).
For the research, it was chosen two brands with a establish position in the Portuguese Market (Fructis Garnier and Corpos Danone), and with the help of the digital marketing company VAN, it was selected the best Instagram campaigns of those two brands in which was used a brand placement strategy. The time scope of the Instagram campaigns collected range from June and October 2017, whereas the collection of data for the primary data analysis occurred between 15th of November and 07th of December.
1.3 Research Methods
In order to answer the research questions mentioned above, it was conducted an exploratory research, more specifically, a quantitative secondary and primary research. The aim of secondary research was to answer the first research question, in which, with the collaboration of VAN it was collected and analysed 191 Instagram campaigns from several Portuguese influencers of the two brands considered, and the results of that analysis compiled in a dataset. Through SPSS, it was run several models, namely, multiple linear regressions, to make statistical inferences about the research hypothesis postulated in the next chapter.
The same was made for the quantitative primary research that had the purpose to answer research question 2. Through the conduction of a survey analysis, it was collected primary data that, once again, was gathered in a unique dataset to be run in SPSS.
1.4 Relevance
This dissertation contributes to existing studies on the optimization of social media advertising activities by analyzing brand placement in influencer content and how viewers reacted to it. This knowledge has an important practical implication. It should provide marketing and brand managers with a clearer on which key factors, related with the production of Instagram content and with the influencer itself, have the most impact on how individuals perceive this form of social media marketing strategy, and what are the implications in terms of engagement and ultimately in terms of sales for the brand. Therefore, this dissertation should give to the companies and its managers a clearer vision on how to optimize a brand placement strategy on social media through the use of influencers.
The truth is that marketers may overlook many factors related to social media brand placement that have an extreme importance on the performance of this kind of strategies. In fact many of them only consider the reach that may gain by using social media influencers (which it has its purpose for not so well-known brands), however it is valuable to measure the effects on the engagement and conversions into sales for the brands and also what is the impact on how individuals perceive the characteristics of a brand after seeing this campaigns.
1.5 Dissertation Outline
Chapter 2 presents the literature on topics related to Social Media Marketing, with focus on the role of social media Influencers and brand placement strategies, along with the research hypothesis to be tested. Chapter 3 describes the research methodology used to analyse the validity of the research hypothesis formulated, as well as how the data was collected and the statistical analysis was conducted. Chapter 4 presents the main results and conclusion from the statistical analysis from SPSS and finally, chapter 5 introduces the main conclusions of the dissertation and ends with the main limitations of it and some recommendations for future research that fall upon this particular theme.
2. CHAPTER 2: LITERATURE REVIEW AND RESEARCH HYPOTHESES
This chapter presents the literature review and will focus on the following topics: Social Media Marketing, influence marketing on Social Media, Brand Placement and its application on Social media, the determinants that affect the popularity of content, and finally Consumer Psychology. It presents also the research hypothesis to be tested in the following chapters.
2.1. Social media marketing
Companies and brands increasingly leverage SNM to achieve their marketing communication goals
.
Social media marketing has some real advantages compared to traditional (offline and online) marketing, namely in terms of costs, since the financial costs of advertising in SNM remain low. Importantly, social media enable marketers to easily target customers and specific audiences based on profiles, interests and peers, as well as amplify interactivity and word-of-mouth effects, since they allow users to interact actively with other users and engage with the publish content (Librarian, Khalsa and Amritsar, 2016).
Social media can equally generate a high amount of traffic to the brand and in this way enable companies to collect more customer feedback, establish a brand presence and observe how their brands are being perceived (Bolotaeva and Cata, 2011).However, companies should be aware of potential drawbacks related to their presence on social media networks, such as (Bolotaeva and Cata, 2011):
Aggressive advertising, in a way that using product promotion and selling too aggressively may lead customers to stay out of the network. Social Media Sites (SNS) are not a place just to commercialize products/services;
Social networks are places where users publish their own content, which may include their experiences with products/services, customers services, etc., which means that brands have little control over what is shared by the users so it’s very important to monitor those perceptions in order to address potential issues.
Invasion of users’ privacy;
Lack of e-commerce abilities. Social media networks are a unique space, so commercialize products through them require specific capabilities and adaptation;
2.2. Influencer Marketing
FMCG brands seem to be slowly abandoning traditional advertising and looking for new “carriers” of their messages for some years now (Abidin and Ots, 2016). Influencers naturally caught their attention given their large and highly engaged audiences in social media, which make them valuable marketing intermediaries and brand endorsers (Abidin and Ots, 2016). Influencers and their use for commercial purpose are a growing global marketing phenomenon. Many individuals are actually using social media to craft themselves “Microcelebrity personas” (described as a state of being famous to a niche group of people) and turned them into a way of living. A successful Influencer today accumulates not only social capital (followers, status and personal brand), but also economic capital (commercial success - effective product/brand endorsers) (Abidin and Ots, 2016).
Influencers can range from “cool” teenagers to opinion leaders and all the way up to celebrities (Cha et al., 2010). Three main factors drive social influence in consumption: personality traits, knowledge and relationships (van Eck, Jager and Leeflang, 2011). Active and homogeneous audiences also favour social influence phenomena (Cha et al., 2010). In the case of Influencers, a lot depends on their own taste and creativity in generating content. So every detail counts with respect to content production, from the choice of text and photo to post to the video editing and the development of a personal style. The higher the identification with the influencer, the more value followers place in the relationship with him or her, and the more willing they are to engage in joint activities and share similar opinions. Still, such identification remains largely aspirational, rather than driven by peer-comparison (Wang, Yu and Wei, 2012). On the other hand, Influencers may act merely as informational influences. Indeed, consumers often seek information about brands from knowledgeable individuals to inform their purchases, and not necessarily to emulate their tastes or behaviour (Wang, Yu and Wei, 2012).
Influencers share some of the marketing characteristics and functions of opinion leaders. Just like opinion leaders, Influencers contribute to the distribution of information and recommendations about consumption choices. Opinion leadership is linked to a high degree of media activity, affiliation with organizations and participation in social activities (Song, Cho and Kim, 2017). Opinion leaders evaluate products based on their experience, expertise and involvement with a product category. By sharing their evaluations, they translate marketing messages into Word-Of-Mouth (WOM), which followers perceive as more reliable (van Eck, Jager and Leeflang, 2011). As a result, and similarly to influencers, consumers see opinion leaders as more reliable and credible sources or market information than traditional advertising
(Zhang et al., 2017). In fact, reviews about products reduce consumers uncertainty. These ones are twice as likely to buy a recommended product and thus increase firms’ sales (Luo and Zhang, 2013).
Influencers are becoming acutely aware of their role in the branding process, so they are becoming more professional and begin to offer differentiated services to companies. Their growing success and popularity captivate the attention of the most diverse industries. Influencers are also invited to brand events because companies increasingly acknowledge their unique status and prestige (Abidin and Ots, 2016). Still, there are no legal boundaries in the influencers industry. In the case of USA, the Federal Trade Commision (FTC) has developed guidelines for the disclosure of product marketing and endorsements on social media to protect consumers from unfair and deceptive practices online. FTC states that celebrities and endorsers should end their posts with #ad or #spon (sponsored by) to clarify that the post was an ad. However, for now, this is just a recommendation, which means that it’s not mandatory (Kowalczyk, 2012).
Beyond the fact of there are no legal boundaries in the influencers industry, the use of influencers as the message “carriers” break two premises related to them: authenticity and credibility. Influencers may be exposed to some kind of “inauthentic” based on some evidence like (1) inconsistency in product preferences over time, (2) discrepancies between what post say what pictures and videos show and (3) incongruences in the overall profile and brand values. This can be due to some sort of pressure exert by influencers agencies when they define their contractual relationships. (Abidin and Ots, 2016).
2.3. Brand Placement
Brand placement refers to placing a brand and/or a product within a specific media content, where it can be seen or/and its name heard. The main purpose of this advertising strategy is to improve brand recall and strengthen brand image (Lehu and Bressoud, 2007).
Extensive research has been conducted on brand placement in movies, television, videos games and music, however, few have studied this phenomenon in the context of social media (Kowalczyk, 2012). Brand placement in influencers’ content resembles classic ad campaigns, but with the peculiarity of being personalized to a very specific audience in order to followers engage in aspirational behaviour patterns role modelled by influencers. Its closest format would be the advertorial, as it is also a highly personalized and opinion-laden advertisement written in the style of an editorial. The most effective advertorials are indeed those that betray naturality
in a way that followers are unable to unveil if they are “paid-opinions” or “unpaid sentiments” (Abidin and Ots, 2016).
2.4. Consumers’ response to advertising and brand placement
Consumers tend to rely more on opinions from others in their personal or professional network than from traditional marketing channels. Therefore, identifying opinion leaders within a target segment should be the primary goal of a marketing campaign aiming to take advantage of word-of-mouth phenomena (Zhang et al., 2017). Social media influence is particularly effective on the millennial generation, in which 68% of the individuals between 18 and 34 years-old are ‘somewhat likely’ to make a purchase after seeing a friends post (emarketer, 2014).
Brand placement is thought to trigger three types of effective responses from viewers, related to the physical senses (through elements like colours, shapes or sounds), positive or negative impressions and feelings, and cognition (like familiarity and past preferences) (Strack and Deutsch, 2006). Generally, There are three ways of doing brand placement: (1) Prominence, which occurs when the product is made highly visible by its size or position on the content, or through its centrality in the action (brand is the focus of attention), (2) audiovisual, which refers to the appearance on the screen or the brand be mentioned, and finally (3) plot insertion, which refers to the degree to which the brand is integrated into the story (Lehu and Bressoud, 2007). Focusing on prominent brand placement, this one is positively related to brand memory: more prominent the brand placement, better the audiences’ brand memory. Although under specific circumstances it can have negative effects on brand attitudes. Prominence has a positive effect on brand attitudes of viewers who are highly involved in what they are watching. However, other studies also show that prominent placement is more deeply processed when viewers enjoy the content, and therefore it may activate on the viewer the awareness of the deliberate brand and he/she will tend to pursue a cognitive defence against persuasion. So in conclusion, Prominent placement has a positive effect on memory but the effect on attitudes towards the brand depends on the audience involvement with the content (van Reijmersdal, 2009).
According to Martin Lindstrom, the most important for a brand placement strategy to be effective is the brand/product take an active role in the content, this is, the plot insertion method should be used, however, this is particularly true for the big screen (e.g. movie, television shows), which may be different for content inserted on social media (essentially images and short videos).
2.5. Determinants that affect the popularity of an advertisement
As already said, companies are investing more in social media, and one reason for that is to foster relationships and Interact with customers (De Vries, Gensler and Leeflang, 2012) In its turn, individuals that follow brand fan pages tend to be more loyal and committed to the brand, be more receptive to receive more information about the brand, and hence generate more positive WOM and be more emotionally attached to the brand (De Vries, Gensler and Leeflang, 2012). The objective of a brand post is to motivate people to react, either by liking or commenting and thus generate engagement with the brand. By doing so, people are giving their opinion publicly, which to a certain extent, it works as Word-of-Mouth communication (De Vries, Gensler and Leeflang, 2012)
In order to generate engagement, it is important that the content that is published be appealing and easily capture the attention of the viewer. There are several determinants related to the design and production of that content that affects the popularity of a brand post. One example of these determinants is the vividness of brand posts. The vividness of a post is related with its features and in what extent the post stimulates different senses (e.g.: videos are more vivid than images because the first not only stimulates sight but also hearing). Some research on banner advertising optimization shows that highly vivid banners get more intentions to click and click-to-rates (CTR) (De Vries, Gensler and Leeflang, 2012). So, applying this conclusion to brand placement on Instagram, it is expected that more vivid posts lead to positive attitudes from followers to like and comments brand posts.
However, there are more factors related to the production of creative advertising that it is believed impact branding. Lighter backgrounds, high contrast and dynamic messages are some that may improve branding. Similarly, using larger brand logos, depicting human faces and keeping the message simple and straightforward helps advertising performance (Lohtia, Donthu and Hershberger, 2013). Another example is the amount of colour used in an advertising have been shown to impact advertising effectiveness in traditional media in which until a certain level of colour it is proven to impact positively the way people perceive the ad, however high levels of colour (too much colour) may have the contrary effect. (Lohtia, Donthu and Hershberger, 2013). Nevertheless, these are assumptions proven for traditional marketing channels and banner advertising.
Moreover, existing studies on search advertising show that position is an important factor for the CTR that a banner has when placed on the website. (De Vries, Gensler and Leeflang, 2012). Therefore, it is important to know in what extent this conclusion can be applied to brand
placement on social media, this is, the position of the brand in the content published by the Influencer plays an important role on the popularity of a post.
Nonetheless, it may not be enough to have an extremely appealing brand post to guarantee success since there are other factors to take into consideration. According to with the Likelihood Model, people tend to process information differently depending on their levels of involvement. For high-involvement situations, people tend to use “central route” processing, which means that they are using their cognitive side to evaluate the message. In these cases, nonessential stimulus, such as colours or sounds, are not processed heavily being treated as secondary elements since they do not convey any essential information. For low-involvement situations, people use “peripheral route” processing, which means that people are engaged in an unconscious way and they do not make the effort to capture any specific message, where peripheral cues (images, colours, animations, etc.) are better perceived (Lohtia, Donthu and Hershberger, 2013). So basically, people that show high involvement are more receptive to a more informative kind of advertisement, whereas low involvement individuals should be addressed with a more appealing content. (Drossos et al., 2007)
In addition to this, the appeal of a certain content can be divided into rational or emotional appeal. Emotional appeal intent to create positive emotions and brand personality. It is more effective when the involvement by viewers is low. Rational appeals are more effective when viewers are highly involved with the brand and the advertisement. (Drossos et al., 2007). Most of the content that is seen on Instagram requires low involvement, brands should focus on the creation of content that allure emotions and manifests brand personality, which could be done by being associated with social media Influencers.
2.6. Consumer psychology
According to consumer socialization theory, communication among consumers affects their cognitive, affective and behavioural attitudes. Social media allows users to share with their peers product/services reviews, that usually have a great impact on marketing. This type of WOM not only increases marketing messages but also how consumer information is processed (Wang, Yu and Wei, 2012)
People tend to adopt a mechanism of imitating the socialization agent because the agent’s behaviour seems meaningful or desirable to the person that is watching. It is applied a reinforcement process in which people are motivated to adopt (or not) some behaviour or intentions because of the reward (or punishment) offered by the socialization agent. Peers works
as models (“modelling process”) and the pressure to be like his/her peers motivates people to buy the same product that influencers use or to avoid competitors’ brands. They could also buy some product/service just because this way they will look more similar to their peers and create a more intimate relationship (Wang, Yu and Wei, 2012).
Consumers tend to interact with peers about consumption matters, which influence their attitudes toward products and services. More frequent communication with peers about consumption matters, stronger is the social consumption motivations. Peer communication has an impact on (1) attitudes toward advertising, (2) shopping orientation and (3) consumer decision-making (Wang, Yu and Wei, 2012). Regardless of what was said before, individuals will only accept the information given if they feel that its peer is certain about the real product quality, which means that the information only gets shared, and thus WOM occurs, if the other is an opinion leader and is certain about the quality of the product (van Eck, Jager and Leeflang, 2011).
Besides that, Social Impact theory states that the intensity of influencing people to the individual will affect the amount of influence that a person experience from others (Zhang et
al., 2017). Tie strength is the degree to which a person is willing to maintain a relationship with
peers through social media. Strong ties lead to more flow of information and thus more influence than weak ties (Wang, Yu and Wei, 2012). Strong ties lead to more social media influence because they convey more emotional support, greater trust and more information exchange. Thus, they will experience more normative pressure than weakly-tied individuals. This is especially true for individuals with a moderate level of opinion-leadership once strong ties could fuel insecurity and increase their will for conformity. (Zhang et al., 2017).
2.7. Conclusions and Research Hypothesis
Currently, we are allured and flooded with several situations of brand placement, which in a certain way dull the boundaries between what is called advertisement from creative content (Linstrom, 2009). This is particularly the case in social media with their user-generated content, where brands take advantage of the network that some people (known as Influencers) have to reach a high number of people and engage with them. However, little is known about the factors that influence brand post popularity (number of likes and comments) (De Vries, Gensler and Leeflang, 2012), therefore this dissertation tries to understand the impact of different factors related to the production and design of content on the Instagram engagement metrics. Thus, the following hypotheses were formulated:
H1a: Placing a product in the centre has more impact in terms of engagement than putting on
the sides
H1b: Foreground brand placement has more impact than middle-ground and background
placement
H1c: Placing a product/brand on the outside as more impact than placing it on the inside in
terms of engagement
In addition to this, the number of followers may say nothing about the impact that a social media brand placement have. Other factors, such as relatability between the brand and the influencer may have a greater impact in a way that individuals could perceive the brand/product as a mean to achieve a desirable state, which is more similar to the personality that they are following or conform to others’ behaviours. In that sense the following Hypothesis was formulated:
H2: Similarity between the brand and the influencer as more impact on brand engagement than
the popularity of the Influencer on Social media Network
Moreover, it was tested to what extent the characteristics of the influencers impact the way that the followers that are exposed to these marketing strategies on social media perceive brands:
H3: The perceived characteristics of the influencers affects how individuals perceive the brand
characteristics and identity
The relevance that a brand has on the photo, as well as the presence of more individuals on the content, are factors that may affect followers’ engagement with the brand and the overall evaluation of the appeal of a brand post:
H4a: Placing the brand in a standout position has a greater impact on the likability of the
campaign
H4b: Adding more people to the influencer in a brand placement social media campaign has a
higher impact
Finally, it is important to know to what extent brand placement on social media Influencers’ content could affect the WTB of people, and hence the sales of a brand:
H5: Brand placement on influencers’ social media content affects the willingness-to-buy of a
3.
CHAPTER 3: METHODOLOGY
This chapter portrays the research approach used to answer the research questions presented in chapter 1, the methods used to collect the secondary data and the statistics used to test the research hypotheses postulated in chapter 2, much like the description of the method used to collect and analyse primary data.
3.1. Research Approach
There are two types of research design: Exploratory research and conclusive research. The first one has as main objective provide insights about a specific phenomenon (Malhotra, 2010), this is, only intends to explore more deeply the research questions and hypothesis and not offer a final conclusion or results about the issues being studied. The later has as goal describe a specific phenomenon, test hypothesis and examine relationships (Malhotra, 2010). This means that the findings generated should lead to the formulation of conclusions. Since the hypotheses in this dissertation are already clearly defined, it will be conducted a conclusive research. However, this one can be divided into descriptive or casual research. In descriptive research, the researchers want to describe, determine or identify something, whilst in casual research the objective is to identify the extent and nature of a casual-and-effect relationship.
In this dissertation, to reach some findings about the research hypotheses, it will be undertaken a descriptive research, through the use of both quantitative secondary and primary data. In relation to the secondary data, this one was collected for this study is within a specific time frame, more particularly, in a space of 5 months (Jun. 2017 - Oct. 2017), which means that the research is also cross-sectional. Relatively to the primary data, this research method was also cross-sectional, in which the responses were collected in a time frame of 4 weeks.
3.2. Secondary Data: Collection
For this part, the first task was to search for Instagram campaigns in which brands used Influencers in order to advertise their products. These Instagram campaigns are normally characterized by the following aspects: (1) The photo must include in its description the required hashtags by the brand (this is what differs one specific campaign from the others), (2) the photo has to be shared in the Influencers’ Instagram Profile, and (3) the photo must have the presence of the product that the Instagram post is advertising.
For the selection of Instagram campaigns, it was very important the support of the digital marketing agency VAN, which selected two campaigns from two brands for the analysis. One
of the campaigns is from Fructis - Garnier (#supercabelo #superfrutas #fructisPortugal), which have a total of 155 posts from Portuguese Influencers and the other is from Corpos Danone (#fazmaisporti) which counts with 38 posts, also all from Portuguese influencers, what makes a total of 191 Instagram posts for the analysis.
3.3. Secondary data - Data Analysis and Preparation
After selecting the campaigns, the next step is the analysis of every post that belongs to the campaigns selected. This analysis was made based on a set of variables defined accordingly with the research hypothesis postulated before in this dissertation.
3.3.1. Dependent Variables
Since this research aims to measure the impact of placing a product/brand in the Influencers content, this is, the engagement, it’s important first to define the metrics to measure the performance. On Instagram, these metrics are basically two - likes and comments - and both variables were treated as ratio variables since they can be measured in a continuum, have a numerical value and the “zero” has meaning.
3.3.2. Independent Variables
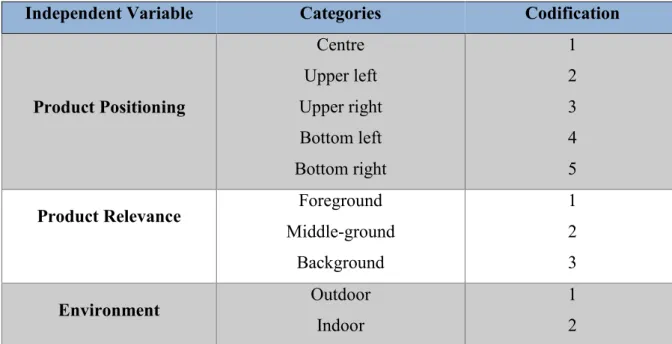
The objective of the first research hypotheses (H1a, H1b and H1c) is to study the impact of matters directly related to the production of the content itself on the performance variables. H1a is associated with the position of the product on the content, which will analyse the performance of placing the product/brand on different zones of the photo. This corresponds to the variable “Product Positioning”, which is divided into 5 categories - centre, upper left, upper right, bottom left, and bottom right.
Research hypothesis H1b intends to explore the impact on the dependent variables of placing the product on the different levels of the depth that a photo may have, this is, putting the product on the foreground, middle-ground or background. This corresponds to the variable “Product
Relevance” which will have those 3 categories.
Finally, H1c aims to study the impact of the ambience in which the photo is taken, this is, if the photo was taken in an outdoor or indoor environment. Saying this, another independent variable will be “Environment” with 2 categories - outdoor and indoor.
Independent Variable Categories Codification Product Positioning Centre Upper left Upper right Bottom left Bottom right 1 2 3 4 5
Product Relevance Foreground
Middle-ground Background 1 2 3 Environment Outdoor Indoor 1 2
The second Research Hypothesis is concerned in investigating whether the fit between the brand and the Influencer or the number of followers that an Influencer has produces more impact on the performance variables. For this purpose it was created an ordinal variable called
“Fit brand/Influencer” with 3 categories - High, Medium and Low - which corresponds to the
degree that the brand identity matches with the Influencers characteristics and interests (table below explains the factors to distinguish each category), and it was also created another continuous variable called “Number of Followers”.
Brand Fit brand/Influencer Factors
Fructis - Garnier
High (1) Influencer: creates content about fashion or is linked to this area;
Medium (2) Influencer: creates content about other area/interest but publish a lot of content where she/he is present
Low (3)
Influencer: creates content about other area/interest and does not appear in most of the content
published
Corpos Danone
High (1) Influencer: creates content about healthy lifestyle or fitness or is linked to this area;
Medium (2) Influencer: creates content about food; Low (3) Influencer: creates content about other area/interest
Table 1: Independent variables and their categories and respective codification
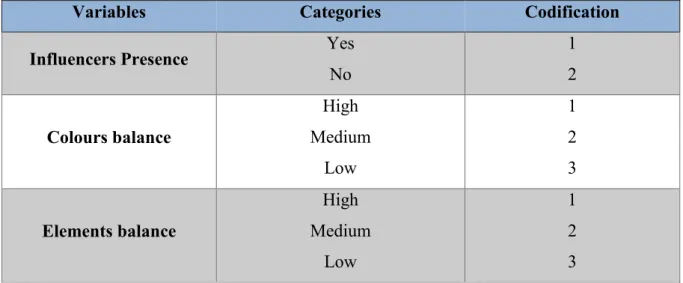
Besides the variables that are directly related with the hypotheses formulated, it was included in the analysis 4 more independent variables to investigate their effect on the performance variables both solely and their interactions with the key independent variables. These ones will be: (1) “Influencers presence”, which has to do if the Influencer appears in the photo or not, so it will be a categorical variable with two categories (Yes; No), (2) “colours balance”, with 3 categories (High; medium; low), and refers to the degree that the colours shown in the photo are paired with the topic (in this case product/brand) that we are talking about - concept of semantic resonance (Lin and Heer, 2014) - and if there is a match between the colours used, (3) “elements balance”, which is related if the elements exhibited in the photo are correlated between them and with the product ( 3 categories - High; medium; low) and lastly (4) “Number
of Hashtags”, considered as a continuous variables.
3.3.3. Linear Regression Analysis
A linear Regression model was conducted in this dissertation in order to verify the veracity of both Research Hypothesis (H1 and H2) presented in the previous chapter. Nevertheless, this model was used only for the dependent variable “likes”. As independent variables were included the “Product positioning”, “Product Relevance”, “Environment” and “Fit
brand/Influencer”. Besides this, it was included the remaining variables (above described) as
covariates since they have an impact on the outcome of the model and therefore increase its accuracy. All the categorical variables were split into respective categories by the creation of k-1 dummy variables.
Variables Categories Codification
Influencers Presence Yes
No 1 2 Colours balance High Medium Low 1 2 3 Elements balance High Medium Low 1 2 3
3.3.4. Binary Regression
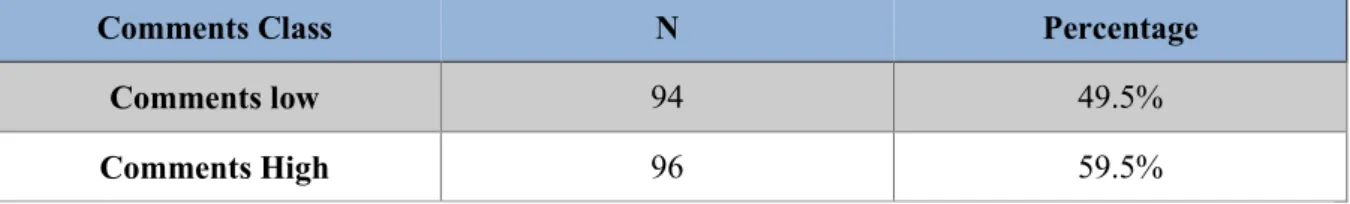
A binary regression analysis was conducted in order to test the hypothesis for the variable “Comments”, in which was created another variable from this one called “Comment Class” in which the posts that have comments divided into two categories (“comments low” - below or equal to 3 comments; “Comments high” - above or equal to 4 comments). Through this new variable, the binary logistic was conducted with all the variables considered in the model as independent variables.
Comments Class N Percentage Comments low 94 49.5%
Comments High 96 59.5%
3.4. Quantitative Primary data
Having analysed the quantitative secondary data, the next step was to proceed to the collection and examination of quantitative Primary data. Through a survey - using the Qualtrics’ online Questionnaire - it was measured how the respondents react to different Instagram campaigns in which Influencers have been used to advertise a specific product from the brand Corpos Danone. For this purpose, it was conducted an A/B test approach, in order to compare 4 version of the same Instagram campaign, in which was manipulated 2 variables. This type of approach is very useful in the sense that was important to complement the results obtained in the quantitative secondary research because allows a better understanding of how certain factors impact the behaviour and the metric in study (likes, which is a measure of engagement in the social media network chosen), and thus provide insights into what can be optimized (in this case, how can marketer optimize the use of influencers’ content to advertise products/brands). Saying this, it was implemented a 2x2 experimental design, in which the first variable is “Other
People presence”, with two categories (existence vs non-existence), and the second variable is
“Product Relevance in relation to the Influencer”, with also two categories (standouts vs not standout). Throughout the survey was shown 4 Instagram campaigns, in which in each of the 4 photos one variable was manipulated, while the remaining factors stood the same (Annex 2):
Photo 1: non-existence of other people & product is not highlighted; Photo 2: non-existence of other people & product is highlighted; Photo 3: existence of other people & is highlighted;
Photo 4: existence of other people & product is not highlighted;
All the other variables mentioned and describe above on the description of qualitative secondary data were controlled and didn’t change on the 4 photos in the analysis (colours balance: high; elements balance: high; Influencer presence: yes; Fit brand Influencer: high).
The goal of this part of the research is to examine, between the 4 versions in the study, gets the better result in terms of (1) acceptance of the marketing campaign, (2) willingness to buy the product and (3) willingness to engage with the brand on Instagram.
On this study was used mainly a 7-point Likert scale in order to access (1) the fit of the brand in the images, (2) the overall appeal of the images, (3) how well-framed is the product with the other elements of the photo and (4) the relationship between the brand and a set of attributes. It was also used a Juster 11-points probability scale to measure the likability of the respondent buy the product after seeing those images and analysed what elements on the photos draw most attention through the use of a heat map (Survey in Annex 3).
3.4.1. Paired Sample T-test
One of the main goals of this research was to understand to what extent the way that respondents perceive the attributes of the brand differs with the observation of the images. For this purpose, it was asked to the respondents, before and after they see the 4 images, in what extent they associate the 10 attributes considered (Lifestyle; Fashion; Performance; Beauty; Gastronomy; Fitness; Sports; Music; Travel; Health and well-being) to the brand in a 7-point Likert scale. Then it was conducted a paired sample T-test in order to compare the mean value of each attribute in both periods and conclude if there was any significant difference.
3.4.2. Repeated Measures ANOVA
Repeated measures is a technique that is used to compare means of a particular variable across three or more groups, in other words, when participants are subjected to more than one condition. For the purpose of this dissertation, it was compared in the 4 images (treatments) in the study (1) the fit of the brand in the image, (2) the extent to which the product is well-framed
in the image, and finally (3) the overall appeal of the photography. Saying this, it was conducted 3 analysis, each one for one dependent variable and compare the means in order to observe if there are any statistically significant differences in the means between the 4 images.
3.4.3. Bivariate and regression analysis
Another important objective of this research was to determine in what sense the visualization of those Instagram campaigns have an impact on the willingness-to-buy a product of a specific brand since in most of the cases increase sales (besides awareness and engagement) is the ultimate goal of this strategies.
For this reason it was analysing the existence of a linear relationship between the dependent variable “WTB” (measured in an 11-points Juster scale) and the independent variables considered in each treatment (Fit; Appeal; Framing) It was also considered the screening (“Frequency_buy_brand”; “Follow_brand”; “Frequency_visit_Instagram”) and demographic (age; Gender; Occupation; Education) variables as covariates since these ones may have an impact on the dependent variable. However not all the variables were included in the model. First, it was conducted a Bivariate regression analysis to know which variables had a significant Pearson correlation, and only then execute the linear regression model.
4. CHAPTER 4: RESULTS AND DISCUSSION
This chapter presents the main analysis and results from the models previously explained in chapter 3. It starts with the interpretation of the results obtained from secondary data, followed by the analysis of the outcomes from the primary research. Based on this, this chapter will end with a discussion of the main conclusion and a summary of the results aiming to evaluate the research hypothesis formulated in chapter 2 and answer the research questions identified in chapter 1.
4.1. Quantitative Secondary Data 4.1.1. Normality test
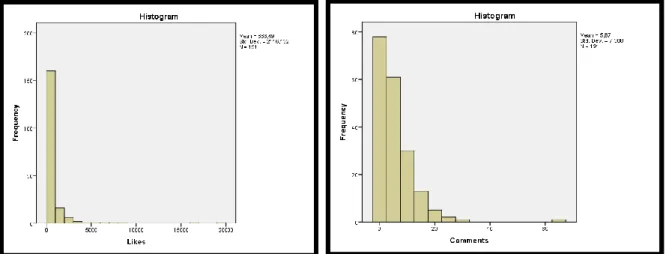
Most of the existent statistical models require the assumption of dependent variables follow a normal distribution be validated. Through the observation of the histograms of the variables “Likes” and “Comments” (Figure 1) and the outputs from the normal Q-Q Plots (Annex 4)it is clear that both dependent variable did not meet that requirement, which calls into question the possibility of the execution of the statistical model considered (Linear and Binary regression).
Both Histograms show that the variables have a skewed distribution. By running the normality test for both variables and considering the Shapiro-Wilk test and the modified K-S test, these values show that the hypothesis of the performance variables follow a normal distribution is rejected since the p-values are below the significance level (Table 5).
Looking also to the Skewness Value (which measure the symmetry in the distribution) and to the Kurtosis value (which measures the combined sizes of the two tails), it is possible to confirm
that the distribution of both variables are highly skewed (skewness > 1) and that have heavy-tails (Kurtosis > 0), meaning that they are peaked in relation to the normal distribution and also have more outliers than this one (Table 5).
This problem was overcome through two simple solutions:
Transformation into a natural ln function of the variable “likes” - “ln_likes” - which successfully generate normal distributed values, as it shows figure 2;
Due to the fact of the variables “Comments” have too many zeros and some extreme values (Significant outliers), the same process was undertaken, however, the natural ln function is still not normally distributed. For this reason, the variable “Comments” suffered a reduction by excluding all the zeros and the extreme values existent and then it was split into two categories, “Comments_low” - equal or below 3 comments - and “Comments_high” - above 3 comments. By doing this, it is now possible to run a regression model, in this particular case, a binary logistic regression.
Kolmogorov-Smirnov Shapiro-Wilk Skewness Kurtosis
Statistic df Sig. Statistic df Sig. Statistic
Likes 0.346 191 0.000 0.333 191 0.000 6.457 48.362
Comments 0.211 191 0.000 0.689 191 0.000 3.842 25.833
Table 5: Results of Kolmogorov-Smirnov and Shapiro-Wilk tests of normality of “likes” and
“Comments”
4.1.2. Descriptive Statistics
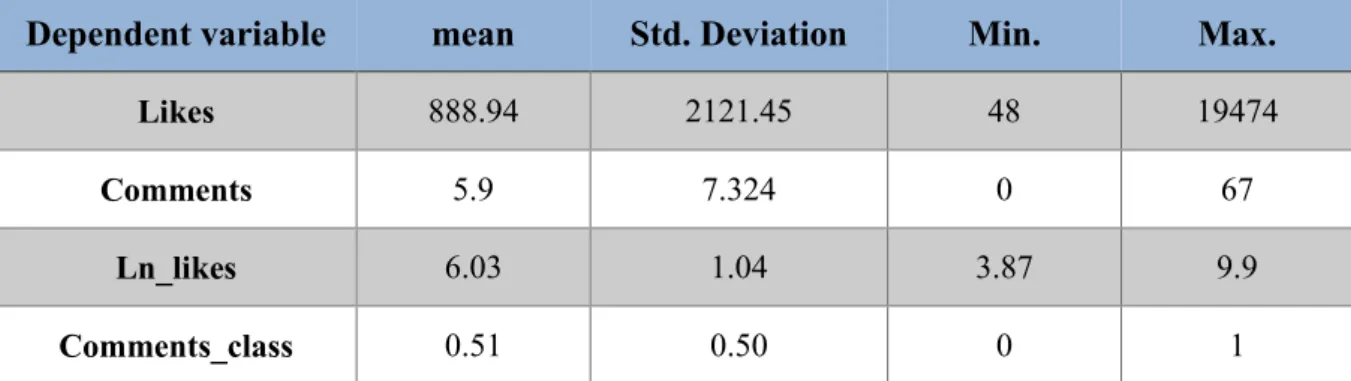
The table below presents the descriptive statistics for both the dependent variables “likes” and “Comments”. For the sake of comparison, this table also includes the descriptive statistics for the transformed variables, this is, for the natural ln function of likes, “Ln_Likes”, and the mean split of Comments, “Comments_Class”. The table shows the mean, standard deviation and the minimum and maximum values of each variable. Looking at the values of the standard deviation for the non-transformed variables, it is possible to conclude that the values are highly dispersed (Std. deviation > mean).
Dependent variable mean Std. Deviation Min. Max.
Likes 888.94 2121.45 48 19474
Comments 5.9 7.324 0 67
Ln_likes 6.03 1.04 3.87 9.9
Comments_class 0.51 0.50 0 1
Table 7 shows the frequencies (number of occurrences and respective percentages) for the most relevant independent variables, which are express in their respective K-1 dummy variables. Most of the Instagram post analysed have the product on the Foreground (77%), on the centre of the photography (52.4%), with the presence of the Influencer (72.8%) and a high level of colour balance (58.1%). Relatively to the variables elements balance and fit brand/Influencer, most of the occurrences are placed in the high and medium categories for both variables. Finally, the variable environments show an approximate number of occurrence between categories.
Table 6: descriptive statistics of the variables “likes”, “ln_likes, “Comments” and
Independent variables Frequency PR_foreground 147 77% PR_middleground 39 20.4% PR_background 4 2.1% PP_centre 100 52.4% PP_upper_left 12 6.3% PP_upper_right 7 3.7% PP_bottom_left 39 20.4% PP_bottom_right 33 17.3% CB_high 111 58.1% CB_medium 60 31.4% CB_low 20 10.5% EB_high 89 46.6% EB_medium 82 42.9% EB_low 20 10.5% Fit_high 87 45.5% Fit_medium 84 44.0% Fit_low 20 10.5% IP_yes 139 72.8% IP_no 52 27.2% Outdoor 102 53.4% Indoor 89 46.6%
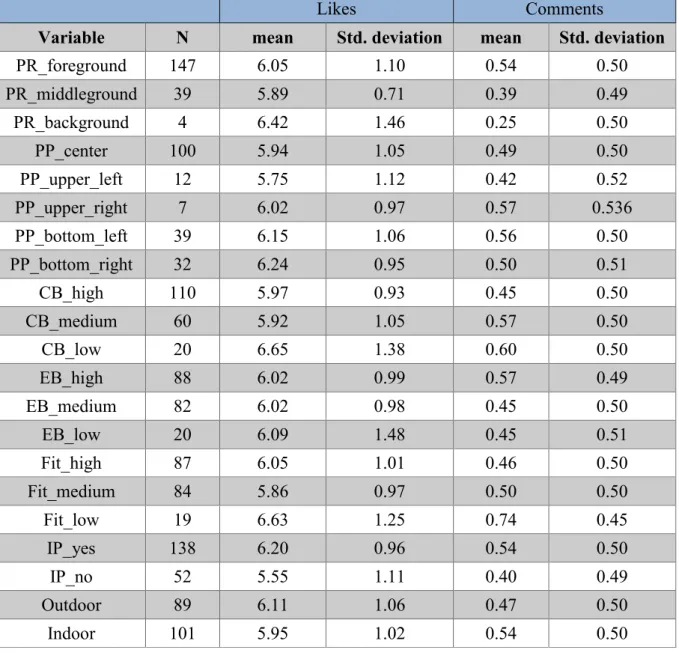
In order to access the performance per independent variable, table 8 presents the mean value of likes (given by ln_likes) and comments (given by comments_class) of each category within the variables. By analysing the following tables, it´s possible to verify that:
Placing the product in the background leads to a higher number of likes while placing in the Foreground has more impact in terms of comments;
Putting the product on the sides of a photo generally leads to better performance in terms of likes and comments than placing it in the centre;
When the balance in terms of colours is low, the mean values of both dependent variables is higher;
In terms of the elements balance, the number of likes is relatively similar across the categories, however for the variable related to the comments, having a higher balance leads to a better result;
The fit brand/Influencer gives a higher mean for the category “low” for both the dependent variables;
The presence of the influencer in the photo has a positive impact on the number of likes and comments;
Taking the photo outdoors generally leads to a better performance in terms of likes obtained than when it is taken indoors, however the reverse happens for the number of comments.
Likes Comments
Variable N mean Std. deviation mean Std. deviation
PR_foreground 147 6.05 1.10 0.54 0.50 PR_middleground 39 5.89 0.71 0.39 0.49 PR_background 4 6.42 1.46 0.25 0.50 PP_center 100 5.94 1.05 0.49 0.50 PP_upper_left 12 5.75 1.12 0.42 0.52 PP_upper_right 7 6.02 0.97 0.57 0.536 PP_bottom_left 39 6.15 1.06 0.56 0.50 PP_bottom_right 32 6.24 0.95 0.50 0.51 CB_high 110 5.97 0.93 0.45 0.50 CB_medium 60 5.92 1.05 0.57 0.50 CB_low 20 6.65 1.38 0.60 0.50 EB_high 88 6.02 0.99 0.57 0.49 EB_medium 82 6.02 0.98 0.45 0.50 EB_low 20 6.09 1.48 0.45 0.51 Fit_high 87 6.05 1.01 0.46 0.50 Fit_medium 84 5.86 0.97 0.50 0.50 Fit_low 19 6.63 1.25 0.74 0.45 IP_yes 138 6.20 0.96 0.54 0.50 IP_no 52 5.55 1.11 0.40 0.49 Outdoor 89 6.11 1.06 0.47 0.50 Indoor 101 5.95 1.02 0.54 0.50
However, these results do not help to reach any valid conclusions by itself since through this table it is only possible to observe the differences in the mean values but not if the difference between the categories is statistically significant. Besides this, the fact of the number of cases per category, in most of the variables, is very concentrated in one category and also the standard deviation also indicates a high level of dispersion between categories.
4.1.3. Linear Regression Results
As described in chapter 3, to measure the effect of different variables on the number of likes (dependent variable) was conducted a linear regression model. This model is given by the mathematical equation:
Y = β0 + β1X1 + … + βnXn + ε
What this equation states is that the number of likes is explained by a constant effect (β0), by a
proportional effect of the independent variables and by a residual effect (ε). For this linear regression model was considered a confidence level of 90%. Since the dependent variable is represented by its natural ln function transformation, the coefficients are also transformed1.
Evaluation of the model quality
The quality of the model was measured through the following metrics:
The correlation coefficient (R = 0.768), which reveals a high intensity between the dependent and independent variables;
R-square value explains the variation that the model produce in the dependent variable. Since the determinant coefficient (R2) has a value of 0.590, this means that nearly 60%
of the variation in the number of likes can be explained by the independent variables included in the model.
Another important value that the table 9 presents it’s the Durbin-Watson coefficient, which measures in what extent the errors are independent (which is one of the assumptions that needs to be verified in order to run a linear regression). This metric varies between 0 and 4, in which values close to the extremes represent autocorrelation between the errors. As the table presents DW = 1.029, so it’s possible to assume that the errors are independent.
1
Δ𝑦 Δ𝑦
Model R R2 Std. Error of
the Estimate Durbin-Watson
2 0,768 0,590 0,695 1.043
Model and variables significance
The table below presents the results that allow evaluating the overall significance of the model, this is if the model can be applied to make the statistical inference that the number of likes is influenced by the independent variables.
Since for F(16;173) = 15.560 p-value is equal to 0.000, which is below the significance level of
0.10, the null hypothesis of the linear model is not valid to explain the relationship between the dependent and the independent variables (there is at least one variable with a not null coefficient - β) is rejected.
Sum square df Mean square F Sig.
Regression 120.34 16 7.52 15.590 0.000
Residual 83.46 173 0.48
Total 203.80 189
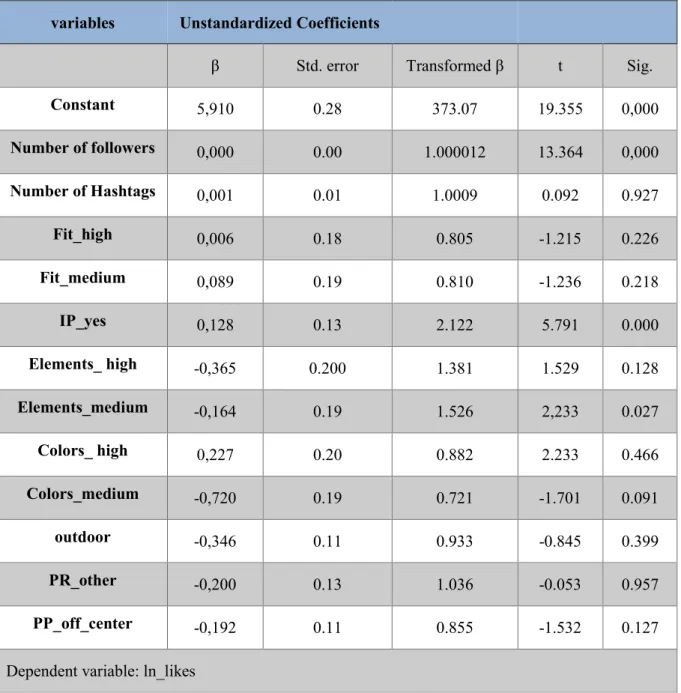
Table 11 presents the significant level and the respective coefficients of the predictors in the model. Through the coefficients table, the t-tests allow evaluating the level of significance of the parameters considered in the model. Having p-value below the significance level means that the null hypothesis (H0: βi = 0) should be rejected and therefore the variable is statistically
significant to explain the dependent variable. Nevertheless, not all the variables included in the model are statistically significant (this is sig. < 0.05), which means that there are some predictors that do not contribute significantly to explain the number of likes.
The information from that table can be interpreted as follow:
There are only four statistically significant variables: Influencer’s presence, the number
of followers, colours_medium and elemenats_medium. The p-values for both these
variables is below 0.10;
Table 9: overall quality of model 2 of linear regression
Number of followers: Looking at the beta coefficients (β = 1.000012) it’s possible to conclude that as the number of followers increases by one, the number of likes increases by 0,0012%;
Influencers’ presence: if the influencer does not appear in the photography, this is, the photography only shows the product, the beta coefficient is equal to 2.121, meaning the number of likes tends to increase 110.83% when the influencer is present in the photo. Colors_medium: this dummy variable presents a p-value of 0.091 and a beta coefficient of 0.7207, so the number of likes decreases about 28.54% in comparison with the reference category, which is colors_low.
Elements_medium: this category is also statistically significant with a p-value of 0.027 and β = 1.5263, which says that the number of likes increases 51.50% when the elements shown in the photo are relatively related, in comparison with the category elements_low; Observing the significance level of the dependent variables of both research hypothesis H1 and H2, all variables considered have values above 0.10, which means that there are not statistically significant differences between the categories of all the dependent variables in the analysis. Therefore, it is possible to conclude:
Putting the product/brand on the foreground does not lead to a better performance in terms of likes than putting at any other level of photo depth (Middleground; background) since the p-value is equal to 0.957.
Putting the Product on the sides of the photo (PP_other; p-value = 0.399) instead of putting it in the centre also does not lead to significant differences in the performance variable.
The number of likes also doesn’t show significant statistical differences when the influencers’ photo is taken indoors or outdoors. Despite this results, through the beta coefficients, it’s possible to state that the number of likes decreases 8.90% when the photo is taken outdoors.
The level of fit between the influencer and the brand does not have an impact on the performance variable “Number of likes”. Looking at the dummy variables “Fit_high” and “Fit_medium”, the p-values are equal to 0.226 and 0.218 respectively, meaning that the differences are not statistically significant.
Considering the mathematical equation previously explain, the number of likes is given by: Likes = 373.07 + 1.000012 * number_of_followers + 2.1224 * IP_yes +
1.5263*Elements_medium - 1.701 * Colors_medium
4.1.4. Binary Logistic Results
Quality of the model
The table below gives information that helps to understand how much variation in the dependent variable can be explained by the model. Looking at the Cox-Snell R2 and Nagelkerke R2 values,
variables Unstandardized Coefficients
β Std. error Transformed β t Sig.
Constant 5,910 0.28 373.07 19.355 0,000 Number of followers 0,000 0.00 1.000012 13.364 0,000 Number of Hashtags 0,001 0.01 1.0009 0.092 0.927 Fit_high 0,006 0.18 0.805 -1.215 0.226 Fit_medium 0,089 0.19 0.810 -1.236 0.218 IP_yes 0,128 0.13 2.122 5.791 0.000 Elements_ high -0,365 0.200 1.381 1.529 0.128 Elements_medium -0,164 0.19 1.526 2,233 0.027 Colors_ high 0,227 0.20 0.882 2.233 0.466 Colors_medium -0,720 0.19 0.721 -1.701 0.091 outdoor -0,346 0.11 0.933 -0.845 0.399 PR_other -0,200 0.13 1.036 -0.053 0.957 PP_off_center -0,192 0.11 0.855 -1.532 0.127
Dependent variable: ln_likes
it’s possible to conclude that the variation on the comments that is explained by the model ranges from 15.9% and 21.2%.
The model also has a chi-square value of 32.906 with a p-value of 0.001 (below the significance level of 0.1), which means that the model is statistically significant, this is, the model is a good predictor of the performance variable considered.
Step -2 Log
likelihood
Cox & Snell R Square Nagelkerke R Square Chi-Square Sig. 1 230.47 0.159 0.212 Step 8.235 0,083 Block 8.235 0,083 Model 32.906 0.001
Block 2: method = Enter
Variables significance
Table 13presents all the independent variables included in the Binary logistic model (block 2: Method = Enter) and the respective coefficients and significance levels. The statistically significant variables are:
Number of followers, which had a p-value of 0.032 and an Exp (β) of 1.000017, which means that the odds of belonging to the “comments_high” category is 1.000017 times more likely when the number of followers increases by one;
The dummy variable “colors_medium” is also significant with an Exp (β) = 2.127, meaning that having an intermediate level of colours balance in a photograph is 100.127% more likely to belongs to the “Comments_high” category than having a high level of colour balance (reference group);
Both categories of “elements_balance” variable included in the model (medium and low levels) have p-values equal to 0.082 and 0.039 respectively. Observing the Exp (β) it is possible to conclude that the odds of the posts belong to the “Comments_high” is 46.7% and 74.1% less likely if the level of elements balance is medium and low, respectively, in comparison to a high level;
If the influencer is not present in the photography, then the odds of having a high number of comments is 57.5% less likely in comparison with photos in which the influencer is present since Exp (β) = 0,425.
It’s expected a decrease of 49.5% on the odds of the posts having a high number of comments - belonging to the “Comments_high” class - when the product is not positioned on the Foreground of the photo in comparison with any other level of photo depth;
β S.E Sig. Exp (β)
Number of Followers 0.000 0.00 0.032 1.000 Number of Hashtags 0.044 0.03 0.125 1.045 Colors Balance 0.138 Colors Balance (1) 0.755 0.38 0.048 2.127 Colors Balance (2) 0.531 0.63 0.403 1.700 Elements Balance 0.071 Elements Balance (1) -0.629 0.36 0.082 0.533 Elements Balance (2) -1.349 0.65 0.039 0.259 Influencer Presence (1) -0.855 0.41 0.036 0.425 Environment (1) 0.547 0.35 0.116 1.728 PR_other -0.683 0.39 0.082 0.505 PP_off_center 0.035 0.33 0.917 1.035 Fit_other 0.471 0.33 0.152 1.601 Constant -0.690 0.48 0.146 0.501
Variables entered on step 1: Environment, PR_Other, PP_off_center, Fit_other block 2: method = enter
Reference category: first