A Work Project, presented as part of the requirements for the Award of a Master Degree in Finance from the NOVA – School of Business and Economics.
Are Dedicated Mutual Fund Pension Products
Able to Outperform Traditional Pension Funds?
Sebastian Dudziak / 2522
A Project carried out on the Master in Finance Program, under the supervision of: Rafael Zambrana and Inka Eberhardt
December, 2016
Abstract: More and more retirees are given the choice to allocate their pension investments
with either their traditional employer-based pension plan or with mutual funds. Due to these developments, mutual funds increasingly provide pension products. This master thesis examines the performance difference between 78 U.S. dedicated mutual fund pension products (DMFPPs) and six U.S. traditional defined contribution funds. Performance is measured relative to style-adjusted benchmarks and is taking the fund’s cost component into account. Applying a single-factor and multi-factor model, I find that dedicated mutual fund pension products, on average, significantly underperform compared to traditional defined contribution funds. I will interpret the findings in the context of the agency cost debate, where mutual funds are more exposed to hidden costs than pension funds and extend the interpretation with the help of the fund value maximization and public choice theory. An equilibrium view concludes the thesis, where sophisticated investors, with time and skill, can find a more suitable investment with DMFPPs than with their traditional defined contribution plan.
Keywords: Pension Fund, Defined Contribution, Mutual Fund, Performance Comparison,
Qualified Default Alternative Investments
Acknowledgments: First, I would like to thank my parents for supporting me. Professionally, I am
thankful to my supervisors Inka Eberhardt and Rafael Zambrano for their valuable help and inspiring feedback and comments. Finally, I would like to thank Sarah Cooley for proofreading this master thesis.
Table of Contents
1. Introduction ... 1
2. Literature Review ... 6
2.1 Performance Evaluation, Comparison and Costs ... 7
2.1.1 Cost Structure of Pension and Mutual Funds ... 10
2.2 Mutual Fund Performance ... 11
2.3 Qualified Default Alternative Investments (History, Statistics & Performance) ... 11
3. Research Design ... 14
3.1 Data ... 14
3.1.1 TSP ... 14
3.1.2 Dedicated Mutual Fund Pension Products ... 17
3.2 Choice of Benchmarks ... 18
3.3 Age, Size and Cost Structure ... 20
3.4 Methodology ... 21
3.5 Portfolio Approach (Summary Statistics) ... 25
4. Results ... 27
4.1 Performance Evaluation (Jensen’s Alpha) ... 27
4.2 Carhart Four-Factor Model ... 32
4.3 Net Expense-Ratio Performance ... 39
4.4 Pooled 24 Month Rolling Window Regression ... 43
4.5 T-test Analysis ... 45
5. Discussion ... 46
5.1 Investment Mix Promise ... 46
5.2 (Agency) Cost Debate ... 47
5.3 Fund Value Maximization and Public Choice Theory ... 49
5.4 Limitations ... 49
6. Conclusion ... 50
7. References ... 52
1. Introduction
With an aging population and current low bond yields in the U.S., sound retirement decisions with a good financial outlook become more and more important. Around the evolving risk, the United States, which has the most developed and largest funded pension system in the world, with an estimated size of around $24.5 trillion in 2016, is in a state of transition (ICI, 2016). Three trends become visible: 1) A continuing shift from defined benefit to defined contribution pension plans, 2) less generous social security benefits and 3) a structural shift in company pension plans toward individual pension plans, such as Individual Retirements Accounts (IRAs) (Bodlak, 2008) (Brown & Weisbenner, 2014) (Viceira, 2007). As a result, the responsibility of generating a decent pension investment shifts from the employee to each individual. These individuals are bearing more risks associated with capital markets and longevity (Bodlak, 2008). Hence, the current and future working generation’s retirement is at risk. This development is boosting the market for asset managers and investment organizations, such as, mutual funds to participate in the retirement and pension business. As shown by the Investment Company Institute, the allocation of employer-based defined contribution pension assets in 401(k) plans grew from $1.739 billion in 2000 to $4.860 billion in 2016, of which the majority of around $2.881 billion is managed by mutual funds (ICI, 2016). The growing demand for mutual funds to offer pension products, which go beyond a simple mixed equity and/or fixed income fund, created a market for new innovations like qualified default investment alternatives (QDIAs), which are usually asset allocation funds like personal target-date funds, lifecycle retirement funds, balanced funds, managed accounts or investment structures with high cost efficiency. These funds can be characterised as a portfolio or “fund of funds,” developed as simple investment solutions for retirees, where the asset allocation mix becomes more conservative as the target-date approaches (Lemke, 2013). Ideally, retirement investments should be expert and low-cost (Bauer & Kicken, 2008). Consequently, there is an ongoing
debate on the cost-effectiveness of pension funds vs. mutual funds, which is also described as an agency cost debate by Bauer and Kicken (2008). Accompanying these trends, the economic motivation for the following research topic “Traditional defined contribution pension plan vs. mutual fund pension products”, is to find out where individuals earn a higher return for their retirement, when given the choice to invest their pension with either dedicated mutual fund pension products (DMFPPs) or their traditional defined contribution pension funds. Since mutual- and pension-funds are often managed by the same asset manager or investment organization, the management processes, investment decisions, administrative- and cost-structures, on a fund level, give different mandates for retirement investment decisions. Thus, the resulting performance review of the different funds might not only be interesting for individuals and financial planners, who represent the buy side, but also for asset managers who want to stay competitive in such a heavily growing market.
From an academic point of view, researchers have generally tested performance differences of pension and mutual funds in different geographic areas and asset classes. The most recent studies found that U.S.- and Global-equity and Canadian fixed income mutual funds underperform pension funds, concluding that higher mutual fund fees cause the underperformance (Ambachtsheer & Bauer, 2007; Bauer, Cremers, & Frehen, 2010; Bauer & Kicken, 2008; García, Agudo, & Reñé, 2012). However, older studies found the opposite. Pension funds, with much greater discretion over asset reallocation, have systematically poorer investment performance than mutual funds (Berkowitz, Finney, & Logne, 1988) (Bogle & Twardowski, 1980). So far, the related literature dedicates its focus on the general comparison of pension and mutual funds. No attention has been given to specific pension related products offered by mutual funds like QDIAs, which are supposed to provide higher cost-efficiency, hence questioning the “agency cost debate” (Bauer & Kicken, 2008).
Therefore, I decided to examine the performance difference of the previously mentioned funds with traditional DC pension funds, leading to the main research question:
1. How do U.S. dedicated mutual fund pension products (QDIAs) perform compared to traditional defined contribution pension funds?
In detail, this study attempts to analyse the performance differences of the Thrift Savings Plan (TSP), a traditional defined contribution plan for approximately 4.8 million employees and retirees of the United States civil service and uniformed services with DMFPPs, such as QDIAs. I examine which type of fund can outperform its benchmark and compare the direct performance differences among themselves. The TSP is the equivalent of a 401(k) plan for federal workers. Of the total ten available TSP funds, six are analysed: five lifecycle funds (QDIAs) and one individual government bonds fund. I compare the performance of the six TSP DC pension funds to a sample of 78 U.S. mutual funds. These are validated as DMFPPs, based on criteria such as advertisement of the fund, type 401(k), Roth 401(k), IRA or other type of private sector saving plans accreditation and are then matched with the TSP funds based on asset allocation, management approach/processes and average fund duration. The whole sample of 78 U.S. mutual funds can be divided into 56 “Target-Date” (TD) funds, 10 “Income Retirement” (INRT) funds and 10 “Short Government” (SG). A single-factor model (Jensen, 1968), as well as, a multifactor model developed by Carhart (1997), which is an extension of the Fama-French three-factor model (Carhart, 1997; Fama & French, 1992) are applied on monthly returns, over a time period from September 2009 to September 2016, for the performance analysis. The fund’s risk adjusted returns are regressed on matching benchmark returns to find the funds’ alphas. Furthermore, the Sharpe ratio is calculated.
Apart from the general performance difference, further research is conducted by analysing the cost and fee structure of DMFPPs and the TSP funds. I want to examine if the before- and after-fee performance results of QDIAs is similar with the existing research on mutual funds, which claims that cost levels of pension funds are considerably lower than mutual fund fees. Therefore, the higher fee structure is considerably reducing net returns of mutual funds. The underperformance, compared to their benchmarks, is generally due to the average high cost level (Bauer & Kicken, 2008) (Bauer, Cremers, & Frehen, 2010). Front-end and back-end loads are not included in this analysis. Hence, the following research question emerges:
2. How do U.S. mutual fund pension products (QDIAs) perform compared with traditional defined contribution pension funds net of fees?
Furthermore, the existing literature provides findings that the adjustment for the fund size and age (inception) difference between pension and mutual funds can influence performance. Management processes or general concepts, like economies of scale, can affect the investment return (Bauer & Kicken, 2008) (Bauer, Cremers, & Frehen, 2010) (Ambachtsheer & Bauer, 2007) (Yan, 2008). Consequently, I perform grouping techniques to investigate the whole sample and examine cross-sectional performance differences on fund size and age. The analysis is extended by including turnover adjustments, which leads to the following research question:
3. Do size and age positively (negatively) influence cross-sectional differences in risk-adjusted returns of DMFPPs and TSP Funds?
Existing literature has resolved the issue of non-existing data on pension performance differences with mutual funds. Nevertheless, previous research has solely considered differences to equity or fixed income mutual funds in the U.S. or Canada. This study offers new insights into the performance differences of pension- and mutual funds by focusing on U.S. DMFPPs, like QDIAs, in order to highlight cost-efficient products purposefully developed for retirement investments. This will allow to observe if DMFPPs yield different results than their traditional peers. To the best of my knowledge, such a comparison has not yet been conducted. A further contribution is that this study puts emphasis on post crisis data (2009-2016) to fill a time gap in the existing literature and renew the general findings. Finally, it contributes to the ongoing debate of conflicts between mutual fund managers and mutual fund investors as mentioned by Bogle (2008). Empirical results indicate that TD funds underperform the TSP lifecycle funds by 53 basis points, INRT underperform by 35 basis points and SG underperform by 23 basis points a month. These findings corroborate previous findings by Ambachtsheer and Bauer (2007), Bauer, Frehen, Lum and Otten (2007) and Bauer and Kicken (2008) [and others]. The master thesis results are relevant for U.S. retirement savings plans, including IRAs, employer-based DC plans, employer-based 401(k) and 403(b) plans, as well as, some parts of Social Security accounts.
The remainder of this master thesis is structured as follows: Section 2 conducts a literature review guided along the given research questions to provide insights into findings of similar studies. In Section 3, the research design, data set, sample choice and methodology are explained. Section 4 presents the quantitative results of the performance evaluation. In Section 5, a subjective discussion and interpretation of the results investigates the importance of type, size and age of the funds and tries to include new economic concepts to broaden the discussion. Section 6 concludes.
2. Literature Review
Connecting the proposed research questions with existing literature, this section provides insights into related studies of this field of research. First and foremost, little attention has been given to the performance of pension plans and even less consideration for the comparison with mutual fund performance. This might largely be due to the data unavailability on pension funds, which has limited the number and sophistication of studies. Moreover, older literature mostly conducts research on a managed accounts level, which might not be very interesting for the participants of pension plans. Normally, plan participants are more concerned with plan performance than their choice of fund management. Nevertheless, research on plan level has its drawbacks, too. By mainly selecting benchmarks, which do not reflect the fund’s investment style, proposing fixed plan/account costs and their limitation to either examine DB or DC plans studies have painted incomplete pictures (Bauer, Frehen, Lum, & Otten, 2007). On parts of the economic overview, the pension landscape in the U.S. has changed, due to several legislative developments, for example, the Employee Retirement Income Security Act of 1974 (ERISA), which gave a structure for the pension industry by establishing minimum required standards. ERISA protects the interests of employee benefit plan participants by requiring the disclosure of financial and other information concerning the plan to beneficiaries, establishing standards of conduct for plan fiduciaries, minimum funding and providing for appropriate remedies and access to the federal courts (Public Law 93-406 Title I, § 2, 1974) (Bodie, 1990). Furthermore, through the Auto-Enrolment Legislation Pension Protection Act of 2006, QDIAs have gained in popularity with asset managers and are transforming the pension industry. The act was an effort to ease automatic enrolment in retirement plans (Strobel, 2007).
This review starts with literature on the performance of pension funds relative to mutual funds, which is divided into out- and under-performance. Each part comprises a review on the cost and expense structure. Subsequently, an evaluation of existing research on the influence of
size and age on mutual and pension funds is presented. At last, literature on the overall retirement system, its transition and innovations are reviewed. The focus of the literature review is on the U.S. defined contribution market.
2.1 Performance Evaluation, Comparison and Costs
General empirical evidence in the performance literature on pension funds, since 1977, is split into two streams. The first stream finds that DC and DB plans underperform (broad) market indices and/or matched mutual funds (after costs). Starting in chronological order, Berkowitz, Finney and Logne (1988) use the Sharpe Performance Measure (Sharpe, 1966), standard t-test for differences and Michael Jensen’s Alpha (1968) on a data sample from 1976 to 1983 to show that mutual funds outperform ERISA plans, Endowment Plans and Public Retirement plans significantly on a management plan level. Mutual funds, on average, generate a positive alpha, while ERISA plans generate negative alphas. The authors argue that, despite the fact that in many cases the same asset manager or investment organization organizes both types of funds, pension funds are trying to time the market, adjusting of their turnover policy and asset allocation. This negatively influences the pension funds’ performance. Mutual funds, on the other hand, are not so easily able to join market timing behaviour because they are tied to their sponsor’s decisions on investment policy changes. Hence, sponsors are usually responsible for the investment performance. Berkowitz, Finney and Logne (1988) blame the plan participants for poor pension plan performance. A limitation of the existing literature would be that they assume costs to be a fixed number of basis points. Furthermore, the unavailability of data on cost structures results mostly in a stated rate of return net of fees, which can be seen as an uncontrollable bias. Therefore, they argue that the rate of returns of mutual funds are overstated. Four years later, Lakonishok et. al. (1992) found similar results. In their widely popular study, they examined a sample of 769 DB and DC plans from 1983 to 1989. They found an
underperformance of 260 basis points to the S&P 500. However, they still used returns with a fixed costs level. Like Berkowitz et. al. (1988), Lakonishok et al. (1992) partially explained the underperformance due to agency conflicts between plan participants, but further extended the group and identified possible conflicts between companies, money managers and pension treasurers. Furthermore, they identified a move towards defined-contribution plans, which facilitates the transition and comparison with mutual funds. Lakonishok et al. (1992) questioned the future of all DB plans. A more recent study by Elton, Gruber and Blake (2006) examines the equity performance of 43 DC plans from 1993-1999 at the total plan level using Michael Jensen’s Alpha (1968), as well as, the Fama and French multifactor model (3-factor model) (1996) and find the average mutual fund offered in 401(k) plans to underperform the market by 0.31% per annum. They found that 401(k) plans, however, outperform matched mutual funds, which are not offered in the DC plan. Contradicting previous literature, type 401(k) DC plan sponsors seem to be able to generate the best investment returns, by picking the best performing funds for their participants. Nevertheless, Elton, Gruber and Blake (2006) acknowledged differences in skills at selecting funds and examined that “Past Performance of plans predicts future performance. The principal predictive power is with the poorer performing plans.” (Elton, Gruber, & Blake, 2006)
The other major stream of existing literature finds DC and DB plans to outperform their (broad) market indices and/or matched mutual funds (after costs). One of the first studies to examine the performance of DB plans in the U.S. is Beebower and Bergstrom (1977). Applying the CAPM framework on 148 U.S. portfolios from 1966-1975, they found the average portfolio to outperform the S&P 500 by 144 basis points per annum. A very comprehensive study by Busse, Goyal, and Wahal (2006) examines portfolios of 6260 institutionally managed DB pension funds from 1991-2004 using the Fama-French (1993) 3-factor model and extended conditional multifactor model. Their average studied fund manager outperforms the market by
124 basis points net of expenses. Bauer, Frehen, Lum and Otten (2007) study U.S. DB plans in the period 1992-2004 and DC plans from 1997-2004 with matched equity mutual funds at the total plan and lower aggregation levels (active vs. passive), by applying a risk- and style-adjusted Net Asset Value (NAV) by Blake et al. (1993) and persistence tests, like the Chi-square test. Bauer, Frehen, Lum and Otten (2007) found DB and DC pension domestic equity performance to be close to their benchmarks or just slightly better. The evidence of persistence is weak. Mutual funds significantly underperform their style-matched benchmarks. Agency costs are identified to be a plausible explanation for the performance differential. In a similar study, Ambachtsheer and Bauer (2007) compared the domestic equity component of Canadian DB pension plans with a sample of Canadian domestic equity mutual funds, over a nine-year period from 1996-2004, using Net Value Added (NVA) as a key metric. Their sample of DB pension plans outperforms their style-adjusted benchmarks by 1.2% per annum, net of expenses. Canadian domestic equity mutual funds underperform their benchmarks by -2.6% per annum, net of management fees, but before applicable sales charges. Overall, Canadian equity mutual funds average return shortfall is 3.8% per annum. Bauer and Kicken (2008) extended the previous study by comparing the performance, as NVA, of domestic fixed income portfolios of 211 Canadian DB plans with 312 Canadian fixed income mutual funds during the period 1997-2004. Their empirical findings are equal to the previous study findings and earlier literature. At last, the most recent study by Bauer, Cremers and Frehen (2010) provides an updated view on the working paper of Bauer, Frehen, Lum and Otten (2007) by analyzing a variety of fund types and arrangements, testing the evidence of no bias or self-reporting bias on their data. Additionally, they examined the cost component and found a cost difference of approximately 20 basis points between DB and DC plans. Furthermore, larger funds tend to have lower cost levels and pension funds costs are generally lower than mutual fund costs.
Another field of research examines the performance differences of index versus actively-managed funds. Brown, Liang and Weisbenner (2007) found that index funds outperform actively-managed equity funds, even before expenses are added. Furthermore, they found that it is difficult for the individual to detect the low-cost index fund among all the actively-managed, since the average participants are not able to allocate their portfolio optimally according to standard finance theory. On parts of the mutual fund landscape, a study by French (2008) finds that switching from a passively managed to an actively managed fund would decrease your annual return by 67 basis points over a period from 1980 to 2006. The general consensus, that active funds perform worse than passive funds, can therefore also be explained due to higher expense ratios.
2.1.1 Cost Structure of Pension and Mutual Funds
The overall majority of recent existing performance literature since 2006 covered the cost factor in their analysis and discussion. The following studies approach costs on a more general level. Bikker and De Dreu (2007) examined administrative and investment costs across Dutch pension funds and found a strong distribution mainly explained by size and thus, economies of scale. Smaller and/or company pension funds tend to be significantly less efficient than larger and/or industry-wide pension funds, hence have higher expense ratios. Furthermore, DC plans have lower operational cost than DB plans. Studies by the Investment Company Institute (2012, 2013) found that falling fees are a common trend, triggered through competition, innovation and economies of scale. On average, 401(k) plan participants pay consistently lower fees compared to the mutual fund industry. For example, the average expense ratio for equity funds in the U.S. was 1.4% in 2012 compared to 0.62%, almost half, what 401(k) plan participants, who were invested in equity mutual funds, paid (ICI, 2012).
2.2 Mutual Fund Performance
Compared with the lack of pension fund performance literature, there is lots of mutual fund performance research. In contrast to the pension plan performance literature, equity mutual fund research generally attests an inability to beat the market and overall non-persistence in outperformance. Findings on persistence in out-/under-performance over short horizons, are sometimes referred as “hot or cold hands”. Prominent research includes: Jensen (1968); Malkiel (1995) and Gruber (1996), who found average underperformance by the amount of expenses charged by the fund; Carhart (1997), who relates the “hot hands” phenomena to simple momentum strategies, Cuthbertson, Nitzsche, and O'Sullivan, (2010) and many others who came to the general consensus that mutual funds underperform relative to their benchmarks.
2.3 Qualified Default Alternative Investments (History, Statistics & Performance)
With a substantial transformation of the U.S. retirement system in recent years, mutual funds have become one of the main retirement investment vehicles (Viceira, 2007). For 2016, of the total U.S. retirement market, with a combined $24.5 trillion in assets, $7.0 and $7.5 trillion are allocated to DC plans and IRAs accordingly. Going into further detail, $2.881 trillion of the $4.86 trillion in 401(k) plans alone, thus almost 60%, are managed by mutual funds. The rest of the total employer-based DC retirement environment is split into $527 billion held in private-sector DC plans, $838 billion in 403(b) plans and $458 billion in the Federal Employees Retirement System’s Thrift Savings plans. The latter group is the part of the DC plan environment this master thesis is examining. Of the total IRA Market, $3.581 trillion assets are managed by mutual funds (ICI, 2016). Other generalist studies predict that target-date and target-risk funds will attract 80% of new and reallocated flows into defined contribution schemes, for the next decade, making these types of funds the primary source of investments opportunities (Casey Quirk, 2009).
The Department of Labor generally defines QDIAs as “an investment fund or model portfolio that seeks both long-term appreciation and capital preservation through a mix of equity and fixed income investments. Management of the fund’s or portfolio’s investments must be based on an employee’s age or target retirement date or on the overall age of the plan’s employees.” (DOL, 2007) An extensive study by Viceira (2007), reviews the academic motivation of QDIAs and argues that modern portfolio theory is the qualified support for “risk-based or “age-based” asset allocation strategies, called life-style and life-cycle funds. He claims that life-cycle funds are better default investment choices than money market funds in DC pension plans. Life-cycle mutual funds have grown from a 1$ to a $120 billion industry from 1996-2006. Similarly, Copeland (2009) examines the “Use of Target-Date Funds in 401(k) Plans [in] 2007” and finds no clear effectiveness of target-date funds to reach the right balance of risk and reward over time. Furthermore, no clear statement on the level of asset allocations can be given. This shows how little research has been performed in this academic field and how unexamined these types of investments are. Adding to the discussion, Ellement and Lucas (2009) simulate various investments under either a “to retirement” or “through retirement” glidepath. The glidepath describes the strategic asset allocation mix model over time. The difference between the two options is the agreed upon end date for the asset allocation model of the pension benefits. The “to retirement” option has its glidepath constructed, with the assumption that the beginning of a participant’s retirement is the end date, and the “through” retirement option takes the participants death as the end date for the glidepath. Similar to Copeland (2009), they found no straightforward answer whether “to” or “through” retirement glidepaths are appropriate. “One size does not fit all in target-date fund investing” (Ellement & Lucas, 2009). A more recent study by Bikker, Broeders, Hollanders and Ponds (2011) quantified given academic theories by examining the effect of participants’ age distribution in the asset allocation of Dutch pension funds. They observe that a 1-year higher average age in active participants leads to a significant
0.5% strategic reduction in equity exposure. Furthermore, “larger pension funds show a stronger age-equity exposure effect” (Bikker, Broeders, Hollanders, & Ponds, 2011). Their findings offer a clear recommendation to replace the average age-based policy of pension funds in favour of life-cycle funds. Bridges, Gesumaria and Leonesio (2010) stochastically simulate the performance as the internal rate of return (IRR) of four life-cycle investment portfolio allocation strategies based on U.S. asset returns to produce 1.000 alternative account accumulation paths for 12,871 workers during 1926 to 2008. They found life-cycle funds to generate a 2% IRR at favourable U.S. equity return levels between 8% and 14%. Between 15% and 28% U.S. equity returns life-cycle funds do not outperform their benchmarks. Generally, portfolios with higher exposure to equities have higher average returns, however with increased risk.
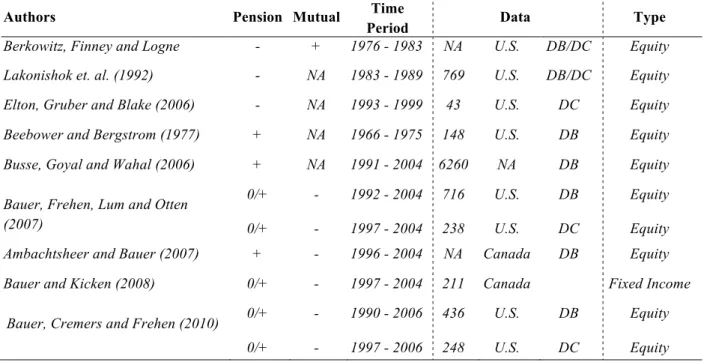
Overall, the more recent literature, since 2006, provides consistent signs of pension fund outperformance and mutual fund underperformance. The following Table provides an overview of the performance findings, time period, data and type of the examined performance literature.
Table I: Performance Literature Overview
This Table reports the Author, under/outperformance of either pension or mutual fund, the corresponding time period, the data and type of data. *For the performance a “–” signals underperformance and a “+” outperformance relative to (broad) market indexes. The Data column displays the number of funds in the sample, geographic location and type of pension plan.
Authors Pension Mutual Time
Period Data Type
Berkowitz, Finney and Logne (1988)
- + 1976 - 1983 NA U.S. DB/DC Equity Lakonishok et. al. (1992) - NA 1983 - 1989 769 U.S. DB/DC Equity Elton, Gruber and Blake (2006) - NA 1993 - 1999 43 U.S. DC Equity Beebower and Bergstrom (1977) + NA 1966 - 1975 148 U.S. DB Equity Busse, Goyal and Wahal (2006) + NA 1991 - 2004 6260 NA DB Equity Bauer, Frehen, Lum and Otten
(2007) 0/+ 0/+ - - 1992 - 2004 1997 - 2004 716 238 U.S. U.S. DB DC Equity Equity Ambachtsheer and Bauer (2007) + - 1996 - 2004 NA Canada DB Equity Bauer and Kicken (2008) 0/+ - 1997 - 2004 211 Canada Fixed Income
Bauer, Cremers and Frehen (2010) 0/+ 0/+ - - 1990 - 2006 1997 - 2006 436 248 U.S. U.S. DB DC Equity Equity
3. Research Design
In this section, the empirical framework for the performance analysis is explained. First, an introduction into the data collection, an overview of summary statistics, as well as the sampling methods into DMFPPs and a traditional DC plan is given. In the second part, detailed information about the applied methodology is given.
3.1 Data
This master thesis requires two types of data: Monthly historical return observations of DC plan funds and matching dedicated mutual fund pension products funds.
3.1.1 TSP
Due to the lack of publicly available data on defined contribution pension plans’ comprehensive returns or daily share prices, this master thesis uses the publicly available data of the U.S. federal Thrift Savings Plan. It is one of the only few publicly available data sources which covers a decent number of plan participants, should be free of self-reporting biases and has been used by other studies, like Bridges, Gesumaria and Leonesio (2010). Out of the whole U.S. employer-based defined contribution landscape of $7.0 trillion $458 billion, thus 7% of all American DC retirement assets, are held by the TSP (ICI, 2016). The TSP is regulated by the Office of the Comptroller of the Currency (OCC). The OCC is an independent bureau in the U.S. Treasury Department. Therefore, the published data should be trustworthy and free of a self-reporting bias. The DC pension fund data is provided by the TSP who offer historical daily share price data from all their available funds on their website. In general, with 4.8 million participants and almost $458 billion in assets under management, the TSP is a DC plan, similarly in design to a private sector 401(k) or Roth 401k, for United States civil service employees. The plan resembles one of the three components of the Federal Employees
Retirement System (TSP, 2015). The TSP offers 10 funds in which to invest. Five individual funds and five “Lifecycle Funds” are accessible. The individual funds are required by law to use index funds for equity options. The TSP is controlled and managed by the Federal Retirement Thrift Investment Board. Individual fund management has been transferred to BlackRock Inc. These are the five individual funds:
The G Fund that invests exclusively in nonmarketable short-term U.S. Treasury securities specially issued to the TSP with payment of principal and interest guaranteed by the U.S. Government. Securities maturities range from 1 to several days, but earn a long-term interest rate, over time outperforming inflation and 90-day T-bills. The weighted average maturity for the funds rate calculation is approximately 11 years (TSP, G Fund Information Sheet, 2016). The F Fund, which is invested in BlackRock’s U.S. Debt Index Fund, is a diversified portfolio of bonds from the U.S. market. The funds objective is to match the Barclays Capital Aggregate Bond Index total performance return (TSP, F Fund Information Sheet, 2016). The C Fund is a common stock index fund, which holds a diversified portfolio of stock of large and medium size U.S. corporations, invested in BlackRock’s Equity Index Fund. The funds objective is to match the S&P 500 Index total performance return (TSP, C Fund Information Sheet, 2016).
The S Fund resembles a Small Capitalization Stock Index fund, which holds a diversified portfolio of stocks of small and medium size U.S. firms. It is invested in BlackRock’s Extended Market Index Fund. The funds objective is to match the Dow Jones U.S. Completion Total Stock Market (TSM) Index total performance return (TSP, S Fund Information Sheet, 2016). The I Fund is invested in BlackRock’s EAFE Index fund. This resembles an International Stock Index fund, that holds a diversified portfolio of stocks of companies from developed countries outside the U.S. and Canada. The funds objective is to match the MSCI EAFE Index total performance return (TSP, I Fund Information Sheet, 2016).
The “Lifecycle Funds”, introduced in 2005, invest in an appropriate mix of the previous mentioned funds and become more conservative as their target-date approaches. Their asset allocation is adjusted on a quarterly basis (See Appendix Table A). Thus, the funds allocation moves from the index stock funds (C,S, and I) to the bond funds (F and G). To date, the TSP offers the following target-dates: L2020, L2030, L2040, L2050 and L Income. The first four funds invest and shifts their asset allocations until the corresponding retirement date. The L Income fund exists for plan participants currently nearing retirement age and is similar in asset allocations to the already retired L2010 fund (TSP, L Fund Information Sheet, 2016). Fund data on costs, size and age are obtained from financial statements, prospectuses and information sheets.
For the performance comparison, only the G Fund and all five “Lifecycle” funds are analysed, since the focus of the thesis is on QDIAs. There are several other reasons to exclude the four individual funds. First of all, research on U.S. DC plan equity funds has already been made by Bauer, Frehen, Lum and Otten (2007). Similarly, since all four funds (F, C S & I) track indexes and are managed by BlackRock, a performance comparison with matching mutual funds would be equal to examining passive index mutual funds. The only measureable differences are probably going to rely on the expense ratio variation and tracking error. A shift to passive investments, from DC plans, has been observed by Steyer (2014). Moreover, many of the direct offered and advertised retirement products, by mutual funds, revolve around QDIAs and shift the focus away from simple index funds. At last, the G Fund is included in the analysis because it provides a unique pension investment opportunity. Generally, short-term government bonds/treasuries are considered one of the safest investments, which is why they are widely popular and important for retirement accounts. For a clear structure and overall recognition, all funds are categorized into either “Target-Date” (TD) funds, “Income Retirement” (INRT) funds or “Short Government” (SG).
3.1.2 Dedicated Mutual Fund Pension Products
In order to obtain a sample of matching DMFPPs, several restrictions and characteristics are assessed, including whether a mutual fund is eligible for the analysis, or not. Firstly, mutual funds are restricted to the U.S. market and have to be denominated in U.S. dollars, in order to mitigate exchange rate risk. Secondly, mutual funds should market the fund as a retirement product. Therefore, a fund must include words such as “retirement” or similar words describing retirement in their fund’s name, in the investment objective explained in the prospectus and/or within the principal investment strategy. Furthermore, funds must be eligible for tax exemption under section 401(a) of the Internal Revenue Code of 1986. Thirdly, the mutual funds must have similar overall asset allocation targets like the TSP Funds (See Appendix Table A). In terms of fund age, mutual funds are only allocated if they provide data consistency with the complete time frame of the analysis, which is from September 2009 to September 2016. Hence, a funds inception must be at least 8 years ago.
I start to search for matching DMFPPs via money.usnews.com, BrightScope and Morningstar. (money.usnews.com, 2016) (Brightscope.com, 2016) (morningstar.com, 2016). Money.usnews.com has published news and data about investment analytics in the U.S. for over 80 years. Their database can be structured into categories such as specific target-date funds (e.g. 2020). The BrightScope database provides retirement plan ratings and investment analytics, such as fees and performance. Morningstar covers more than 500,000 investments and provides investment analytics, such as, matching benchmarks, performance, expense ratios and asset allocation. Using the discussed databases, fund prospectuses and factsheets, funds based on the several mentioned matching criteria like average fund duration, asset allocation, risk measurement, Morningstar proposed benchmark, core investment policy and marketing are identified. I assume core investment policies to be stable over time. Some funds’ average duration or asset allocation might vary, though this is offset by deviations in the whole sample.
For the target-date category funds, 14 different mutual fund companies, offering four matching target-date funds each (2020, 2030, 2040 and 2050) are recognised as being eligible for this study. Hence, the TD sample includes 56 funds in total. Furthermore, along the TSP “L Income fund” characteristics 10 matching funds from 10 different mutual fund firms are selected. At last, a sample of 10 mutual funds is identified matching the TSP “G Fund” characteristics. See an overview of all the funds’ names, management companies, fund age and descriptive statistics in Appendix Table C. For all of the 78 matching DMFPPs, monthly returns are collected via Factset Research and compared with monthly observations from the CRSP database. Therefore, data errors or performance analysis problems such as the “survival bias” are mitigated, because CRSP also lists inactive funds (Haugen & Baker, 1996) (CRSP, 2016).
3.2 Choice of Benchmarks
Since one of the drawbacks in the existing literature is the usage of broad market indices or the wrong choice of benchmarks, in this thesis, several style-adjusted benchmarks (Sharpe, 1988) are used to ensure a good fit and to test the robustness of the applied models. The challenge is to find appropriate benchmarks for the newer breed of DMFPPs. With the increased popularity of target-date funds, established index creators started to develop target maturity benchmarks. Nevertheless, these benchmarks have been proven quite unaccepted in the mutual fund industry (Idzorek, Stempien, & Voris, 2011). The previously mentioned databases help to find matching benchmarks. For the first benchmark choice, I decided to use Morningstar’s suggestion for an appropriate benchmark. Morningstar’s benchmark choice is set through the risk and asset class orientation and other factors of the examined portfolio or fund (morningstar.com, 2016). Several more criteria are examined in the process of selecting an efficient benchmark. According to the CFA Institute’s curriculum (2016), a benchmark should be “unambiguous, investable, measurable, appropriate and reflective of current investment opinions”. In addition,
when examining target-date benchmarks, the “overall glidepath methodology, the asset classes used and the methodology for determining the detailed intra-stock and intra-bond allocations asset class allocations” should be identified. I subdivide the total sample into the three previously mentioned categories (TD, INRT, SG(E)) and find appropriate style-adjusted benchmarks. For all 56 funds in the TD and 10 funds in the INRT category, I find three appropriate benchmarks in total: Morningstar’s own target-date benchmark, the “Morningstar Moderate Target Risk TR USD” (MSAAMMOR), which covers all target-dates simultaneously because in their approach the Modern Portfolio Theory sets the glide path selection, which evolves with the U.S. total economic situation. The MSAAMMOR covers 19 asset classes (Idzorek, Stempien, & Voris, 2011); a second set of benchmarks is provided by Standard and Poor’s Corporation (S&P), who offer four target-date benchmarks related to their individual target-dates (S&P Target-date 2020 Index … S&P Target-date 2050 Index). Their glidepath selection is based on a survey of fund families and 9 asset classes are observed (Idzorek, Stempien, & Voris, 2011). At last, due to the problems associated with finding appropriate benchmarks and general unacceptance in the industry, I develop my own set of benchmarks (L Income Benchmark, …, L 2050 Benchmark). As discussed earlier, the TSP “Lifecycle” funds are invested into their own five individual funds and change their allocation corresponding to their target-date. I collected the monthly returns on each funds’ (C, S, I and F) corresponding benchmark, which were described in the individual funds description. Historical, quarterly data on the percentage allocation of individual funds, for the corresponding “Lifecycle” funds, were acquired on the TSP website (See Appendix Table A). I calculate the self-developed monthly benchmark return by multiplying the individual fund’s monthly benchmark returns by their corresponding percentage allocation in that fund over time. From its fund characteristics, the G Fund is an exception and it is difficult to find a suitable benchmark. I recreated an appropriate benchmark by creating an equal weighted portfolio of indexes, that are similar to the G fund’s
overall characteristics. The examined index benchmarks/funds are the Barclays US Govt. Treasury 7-10Y, Barclays US Govt. Treasury 10-20Y, iShares 10-20 Year Treasury Bond ETF and iShares 7-10 Year Treasury Bond ETF. For the SG category benchmarks, the four different benchmarks previously discussed in the development of the G funds’ equal weighted benchmark plus the equal weighted benchmark itself are utilized to find which one is most appropriate. See an overview of all the benchmarks used in Appendix Table E.
3.3 Age, Size and Cost Structure
Besides obtaining monthly fund and benchmark returns, expense ratios on an annual basis are collected for the net of fees performance comparison. First, I considered CRSP since they provide total expense ratios. Nevertheless, in my opinion, the reported total expense ratios are undervalued, since they do not include 12b-1 fees and management fees and are not always net of reimbursements or waivers. Therefore, Morningstar’s approach for a net expense ratio is used. They set the net expense ratio as “the percentage of fund assets, net of reimbursements, used to pay for operating expenses and management fees, including 12b-1 fees, administrative fees, and all other asset-based costs incurred by the fund, except brokerage costs. Fund expenses are reflected in the fund's NAV. Sales charges are not included in the expense ratio.” (morningstar.com, 2016). The difference in expense ratios is quite substantial. For example, the 2016 annual expense ratio average of the TD category sample funds is 0.34% provided by CRSP compared to 0.88% when considering the net expense ratio approach Morningstar utilizes. Surprisingly, for the SG category, the annual net expense ratios for the CRSP and Morningstar data is identical. An overview of the category average annual expense ratios can be seen in Appendix Table B. Since Morningstar mostly only reports the most recent date, the other 7 years of expense ratios were extracted from fund prospectuses, gathered via the U.S. Securities and Exchange Commission’s website “EDGAR Company Filings” search engine
(SEC, 2016). Furthermore, CRSP provides data on the date the fund was first offered (Inception) and latest month-end total net asset value as a size factor. The latter is collected on a monthly basis for the entire sample period.
3.4 Methodology
This section explains the methodology used to evaluate the risk-adjusted performance differences between TSP funds and matching DMFPPs, as well as, the employed test for cross-sectional differences on alpha controlling for size, age and turnover. Since this thesis uses monthly data, standard time-series regression methods are used to calculate the risk-adjusted performance. In the first part of this section, the single-factor model is explained and in the second part, the applied multi-factor models are described.
For this master thesis, a first performance measure is the Sharpe ratio, which uses the total risk of the portfolio, as it gives the risk premium per risk unit (Sharpe, 1966). Although, it is only used as the first indication for the summary statistics since there are drawbacks like having no direct indication of significance of the result. Therefore, throughout the existing literature, one of most commonly used performance measures is Jensen’s alpha single-factor model (Jensen, 1968). Jensen’s model is based upon capital asset pricing models. He measures performance by regressing a adjusted portfolio as the dependent variable and a risk-adjusted benchmark as the independent variable. Jensen’s alpha is represented as a constant or intercept of the model:
!"#− !%# = '"+ ) !+#− !%# + ,"# Solving for alpha:
In the regression, !"# is the return on fund/portfolio i in month t, !%# is the risk-free rate, measured by the 1-month return of the U.S. Treasury bill f in period t, !+# is the style-adjusted
benchmark return in period t (varies according to the measured fund/portfolio return), ) measures the systematic market risk of the fund/portfolio i, ,"# represents the error term at time t and '" is the measure of performance for fund/portfolio i. In more technical terms, '" represents the intercept of the regression and shows the percentage out- or under-performance, hence excess risk premium earned by funds/portfolios compared to their benchmark. The net excess returns calculated as the funds/portfolios gross returns minus the risk-free rate and net benchmark-adjusted returns calculated as the fund matching style-adjusted benchmark return minus the risk-free rate, provide net returns, which are an important robustness check (Cremers, Petajisto, & Zitzwitz, 2010). Since Jensen’s alpha uses regression analysis, the coefficients on the output results signal whether they are statistically significant or not. Thus, significance on part of the intercept means that not all return variations of a fund/portfolio are explained by the benchmark. In other words, if the intercept is positive and significantly different from 0, the fund/portfolio is said to have outperformed its benchmark. If Jensen’s alpha coefficient is insignificant, no performance difference between the fund/portfolio and benchmark can be measured. A 95% confidence interval is used to indicate statistical significance throughout the whole analysis. The p-value of the coefficients runs the test of significance. The t-statistic reports the statistical significance. The adjusted R² provides the measure for the overall explanatory power of the model.
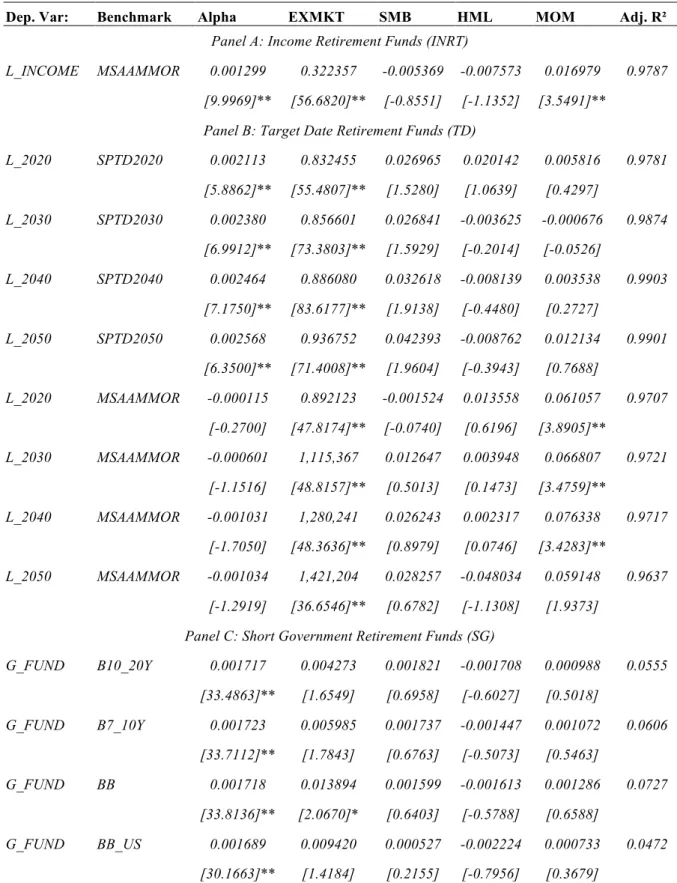
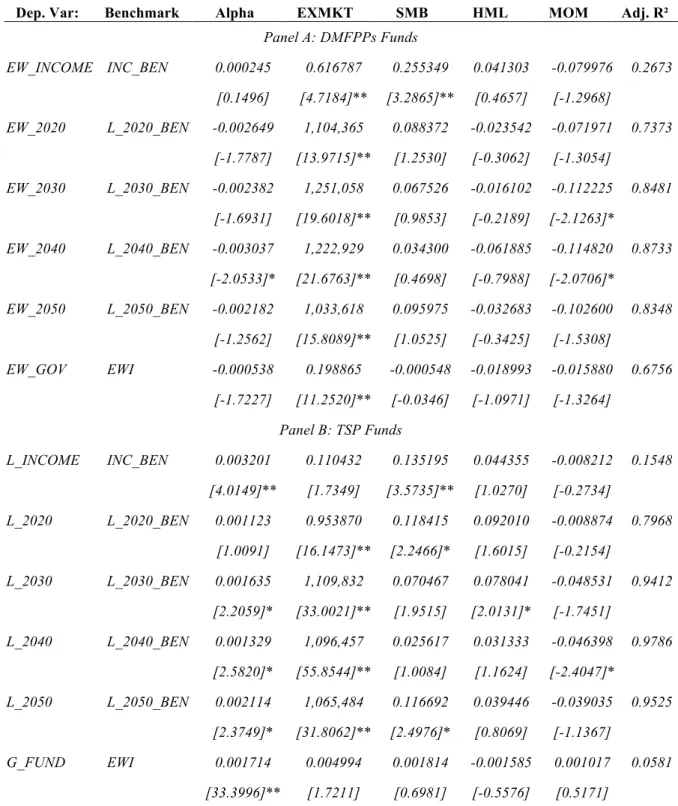
If a single-factor model seems not to be able to explain all the variance in fund/portfolio performance, the existing performance literature on mutual and pension funds, suggests the usage of a multi-factor model. The reason to use a multi-factor model is to increase the number of coefficients, thus factors to explain performance variations of a fund’s/portfolio’s return.
Furthermore, the predominantly examined type of funds are QDIAs, hence a multi-factor model can acknowledge the asset allocation mix of the funds and changes being made over time. The famous and mainstay model for academics is the Fama-French three-factor model (Fama & French, 1993) proposed to capture U.S. average stock returns variations associated with value versus growth and size. Enhanced with a momentum return capturing factor, as an addition to the Fama-French three factor model, this thesis will use the Carhart’s four-factor model (Carhart, 1997). The model looks like this:
!"#− !%# = '"+ ) ∗ !+#− !%# + ) ∗ ./0#+ ) ∗ 1/2#+ ) ∗ 3/0#+ ,"#
Where, !"# is the return on fund/portfolio i for month t, !%# is the risk free rate, measured by the 1 month U.S. T-Bill, ) ∗ !+# − !%# is the style-adjusted benchmark return, ) ∗ ./0# is the estimate of the value-factor, capturing the difference between the returns on diversified funds/portfolios of high book-to-market (value) stocks and low book-to-market (growth) stocks, mimicking fund’s/portfolio’s return, ) ∗ 1/2# is the estimate of the size-factor, capturing the difference between the returns on diversified funds/portfolios of small stocks and big stocks, mimicking fund’s/portfolio’s return, ) ∗ 3/0# is the estimate of the momentum-factor, capturing the difference between the returns in period t on diversified funds/portfolios of winners and losers of the past year, mimicking fund’s/portfolio’s return and ,"# is the error term at time t. '" is the measure of performance for fund/portfolio i representing the intercept
of the regression. In less technical terms this model can be described as linear regression to find alpha and beta coefficient values that explain the fund’s/portfolio’s return. The equation simply draws a linear combination of exposures to market, value, size, momentum factors and an unexplained alpha. The ß coefficients display the sensitivity of the fund/portfolio to each factor. Alpha is the intercept of the regression that indicates the return variation of the portfolio using four factors. When compared with the single-factor model many similarities become evident,
except that the Carhart Fama-French model provides four explanatory variables and not just one. The data for the different factors is obtained from the Kenneth French data library (French, 2016)
As the focus of the Carhart four-factor model is capturing performance variations, a further analysis of the relationship between fund age, size and turnover could provide detailed insights which factors influence the performance differences between DMFPPs and the TSP DC plan. The relationship between the measured returns and fund characteristics and each fund’s return may vary over time. Existing literature, such as Carhart (1997) adopt a Fama-MacBeth (1973) rolling regression (Cuthbertson, Nitzsche, & O'Sullivan, 2010). For this thesis, a pooled ordinary least squares (OLS) rolling regression for all the fund’s alphas of the sample is used. In order to calculate pooled cross-sectional data, 24 month rolling window alphas for the DMFPPs funds and the TSP funds are estimated. A rolling window regression for a time series can be explained as running multiple regressions with overlapping windows of values at a time. For example, for a 24-month rolling window the first 24 observations are regressed and then this “window” of 24 monthly observations is rolled by 1. Now, the next window would be the next 24 observations starting from the 2nd observation (1-24, 2-25, 3-26…). Each regression saves the estimated beta (for each fund and time window), which for the total 86 monthly observations leads to 61 periods. Hence, using a specific beta from a specific fund (e.g. beta 1-24_fund A) can predict the according alpha (e.g. alpha 25_fund). In more mathematical terms:
45678 9 (;<) = !" (;<)− !% ;< − )5678 9 (>?;@)∗ !+ (;<)− !% (;<)
Where !" (;<) is the return of portfolio/fund i at month 25, !% ;< is the risk-free rate at period 25, !+ (;<) is the market risk return at month 25 and )5678 9 (>?;@) is the estimated beta of “Fund
A” for the period from 1 month to month 24. 45678 9 (;<) presents the estimated alpha for the according fund and time window. The pooled ordinary least squares (OLS) regression for the whole sample tests the 24 month rolling window alphas upon four explanatory variables. The model looks the following:
'AB ;@ CD7#E = )>∗ F/ + );∗ 1GHI + )J∗ KLI + )@∗ MN!OPQI! + ,"#
Where, )>∗ F/ is a dummy variable that equals 0 if the fund is a pension fund and 1 if it is a DMFPPs fund. The more technical description is that )>∗ F/ coefficient shows the magnitude difference (and the statistical significance) in alphas between pension funds and mutual funds, after controlling for size, age and turnover. For the estimation of the regression the White cross-section (period) standard errors and covariance (degrees of freedom corrected) are applied.
3.5 Portfolio Approach (Summary Statistics)
For a first performance comparison of the TSP funds and matching DMFPPs, all individual funds are average over time to generate equal weight portfolios divided into three groups. The first group consists of 56 TD funds and is subdivided into four equal weighted portfolios, which represent the given target-dates (EW_2020, EW_2030, EW_2040 and EW_2050). The second equal weighted portfolio is composed of all 10 INRT funds (EW_INCOME). At last, an equal weighted portfolio of the 10 SG funds is constructed (EW_GOV). Each equal weighted portfolio is compared with the associated TSP funds.
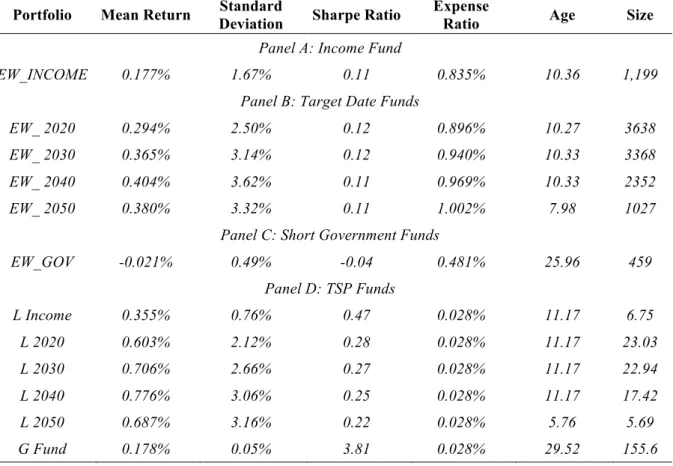
Table II reports the summary statistics of the 6 equal weighted portfolios and 6 matching TSP funds for the sample period from September 2009 to September 2016. The mean returns, standard deviations and Sharpe ratios are based on monthly time series observations. The expense ratios are based on annual observations. Various trends already become visible for the whole sample. In direct comparison, each TSP fund displays a higher mean return, lower
standard deviation and consequently higher Sharpe ratio compared to their matching DMFPPs equally weighted portfolio. Obviously, one possible explanation of the overall higher standard deviation of the DMFPPs equal weighted portfolios is that their sample includes 10 times as many funds as compared to just one TSP fund. On average, Sharpe ratios from DMFPPs equal weighted portfolios are 0.1 to about 0.3 points less compared to the TSP funds. An exception is the G fund, which in investors eyes has an excellent Sharpe ratio of higher than 3. This is clearly due to the structure of the funds, which guarantee principal and interest from the U.S. government. Furthermore, a very striking observation can be made in terms of expense ratio differences. Whereas, most equal weighted portfolios in the “Lifecycle” category display an average yearly expense ratio of close to 1% throughout the sample period, the TSP funds have an about 0.98% significantly smaller average yearly expense ratio of 0.028%.
Table II: Portfolio Approach (Summary Statistics)
This table summarizes the risk and return characteristics, Sharpe Ratio, expense ratios, fund age (in years) and size ($ Millions) based on times series and static data. The table is split into three different panels for the equal weighted portfolios of DMFPPs and one panel for the TSP funds. The three panels are segmented into the three different fund categories. Namely: Income funds, Target Date Funds and Short Government Funds. The panel D is sorted equally.
Portfolio Mean Return Deviation Standard Sharpe Ratio Expense Ratio Age Size
Panel A: Income Fund
EW_INCOME 0.177% 1.67% 0.11 0.835% 10.36 1,199
Panel B: Target Date Funds
EW_ 2020 0.294% 2.50% 0.12 0.896% 10.27 3638
EW_ 2030 0.365% 3.14% 0.12 0.940% 10.33 3368
EW_ 2040 0.404% 3.62% 0.11 0.969% 10.33 2352
EW_ 2050 0.380% 3.32% 0.11 1.002% 7.98 1027
Panel C: Short Government Funds
EW_GOV -0.021% 0.49% -0.04 0.481% 25.96 459 Panel D: TSP Funds L Income 0.355% 0.76% 0.47 0.028% 11.17 6.75 L 2020 0.603% 2.12% 0.28 0.028% 11.17 23.03 L 2030 0.706% 2.66% 0.27 0.028% 11.17 22.94 L 2040 0.776% 3.06% 0.25 0.028% 11.17 17.42 L 2050 0.687% 3.16% 0.22 0.028% 5.76 5.69
4. Results
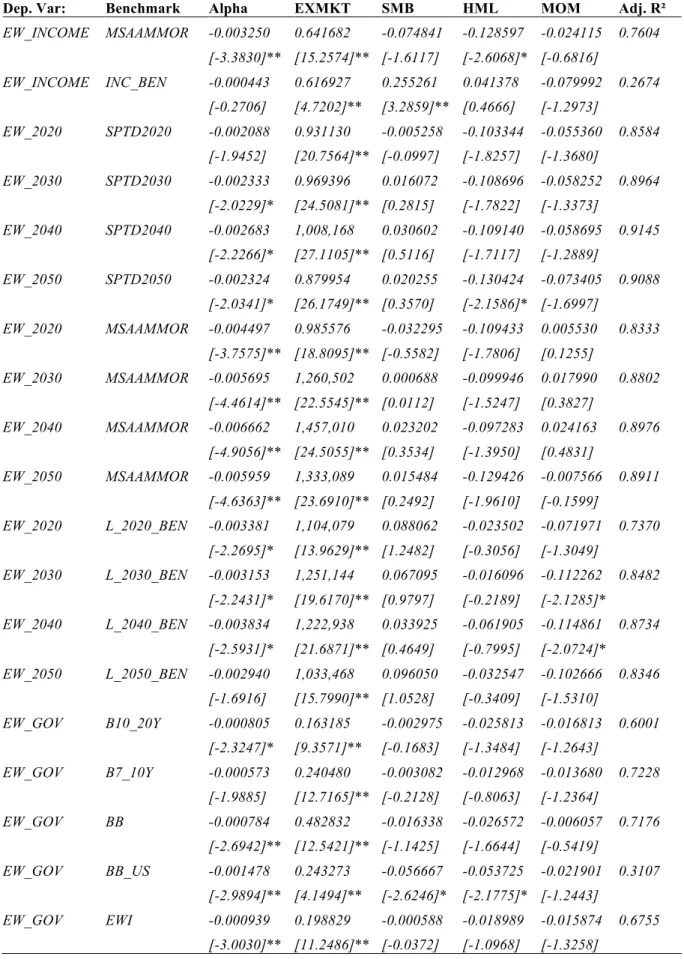
In this section the single-factor- and multi-factor -model performance analysis results of the DMFPPs funds and TSP funds are presented. The results are divided into several subsections. First, all excess returns relative to their style-adjusted benchmarks, hence risk-adjusted alphas, are reported and then differentiated into DMFPPs funds and TSP funds to compare their individual performance. As an important robustness check, performance is tested with several style-adjusted benchmarks, as examined by Cremers, Petajisto and Zitzwitz (2010). Furthermore, the DMFPPs and TSP funds are grouped by size and age for an additional analysis. Secondly, the same process is repeated using the Carhart-Fama-French four factor model (1997). Furthermore, as a further robustness check, the consistency of the results is tested net of fees. Moreover, the results of the overall sample alphas of the Fama-MacBeth (1973) rolling regression on fund type, size, age and turnover are presented. At last, the results of a standard t-test analysis are presented in order to examine the individual fund characteristics to verify the anticipated equilibrium view.
4.1 Performance Evaluation (Jensen’s Alpha)
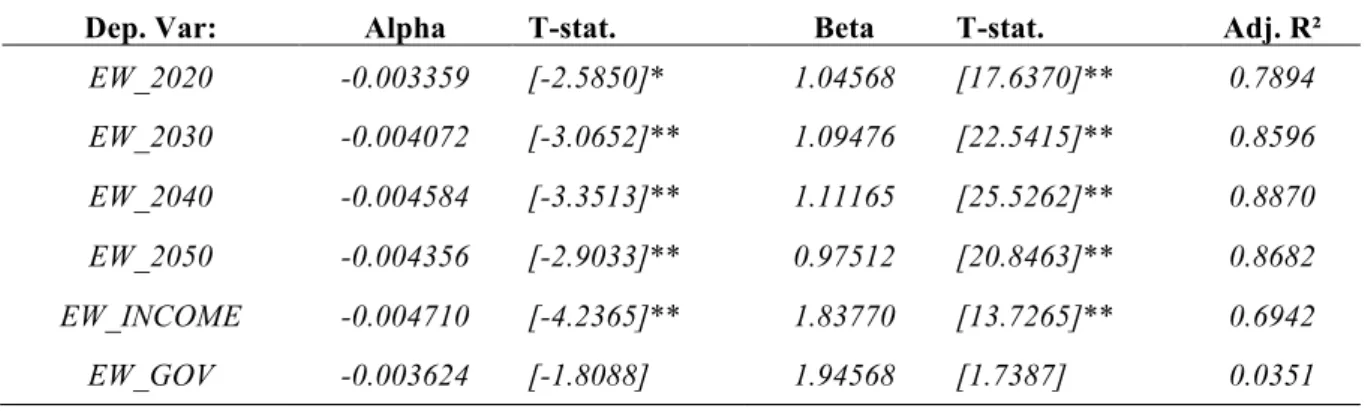
In this subsection, the overall performance evaluation results for the whole sample using Jensen’s alpha (1968) are presented. As indicated in Section 3.4 the individual fund’s returns are averaged over time. Table III reports the regression results of the six equal weighted portfolios, using monthly returns and several matching monthly style-adjusted benchmark returns. Alpha denotes the monthly abnormal return relative to its benchmark. Furthermore, the corresponding t-statistics are provided to indicate whether the examined alphas and betas are significantly different from zero. One asterisk (*) indicates (p < 0.1) significance at the 90% confidence level and two asterisks mean (p<0.05) significance at the 95% confidence level.
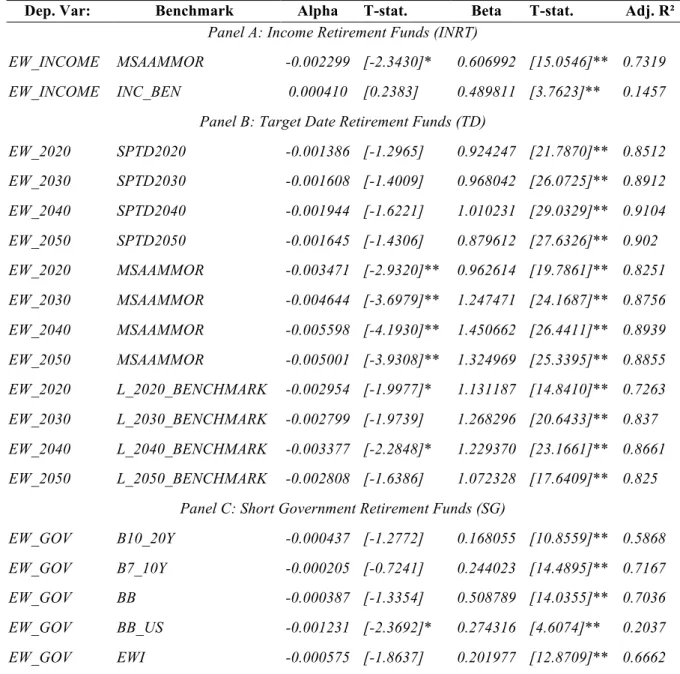
Overall, the six DMFPPs equal weighted portfolio’s risk-adjusted performance is consistently negative. Betas are highly significant and the general explanatory power of the models indicated by the individual adjusted R² is on average < 0.74. In other words, almost all DMFPPs portfolios generate a negative statistically significant alpha relative to their benchmarks. The portfolios that outperform display non-statistically significant alphas.
Table III: Jensen’s Alpha (DMFPPs - Equal Weighted Portfolios)
This table reports the single-factor-model regression results given by !"#− !%#= '"+ ) !+#− !%# + ,"#. The regression is
based on monthly excess returns for a time period from September 2009 to September 2016 for the DMFPPs equal weighted portfolios relative to several style-adjusted benchmarks. * indicates (p < 0.1) significance at the 90% confidence level and ** mean (p<0.05) significance at the 95% confidence level.
Dep. Var: Benchmark Alpha T-stat. Beta T-stat. Adj. R²
Panel A: Income Retirement Funds (INRT)
EW_INCOME MSAAMMOR -0.002299 [-2.3430]* 0.606992 [15.0546]** 0.7319
EW_INCOME INC_BEN 0.000410 [0.2383] 0.489811 [3.7623]** 0.1457
Panel B: Target Date Retirement Funds (TD)
EW_2020 SPTD2020 -0.001386 [-1.2965] 0.924247 [21.7870]** 0.8512 EW_2030 SPTD2030 -0.001608 [-1.4009] 0.968042 [26.0725]** 0.8912 EW_2040 SPTD2040 -0.001944 [-1.6221] 1.010231 [29.0329]** 0.9104 EW_2050 SPTD2050 -0.001645 [-1.4306] 0.879612 [27.6326]** 0.902 EW_2020 MSAAMMOR -0.003471 [-2.9320]** 0.962614 [19.7861]** 0.8251 EW_2030 MSAAMMOR -0.004644 [-3.6979]** 1.247471 [24.1687]** 0.8756 EW_2040 MSAAMMOR -0.005598 [-4.1930]** 1.450662 [26.4411]** 0.8939 EW_2050 MSAAMMOR -0.005001 [-3.9308]** 1.324969 [25.3395]** 0.8855 EW_2020 L_2020_BENCHMARK -0.002954 [-1.9977]* 1.131187 [14.8410]** 0.7263 EW_2030 L_2030_BENCHMARK -0.002799 [-1.9739] 1.268296 [20.6433]** 0.837 EW_2040 L_2040_BENCHMARK -0.003377 [-2.2848]* 1.229370 [23.1661]** 0.8661 EW_2050 L_2050_BENCHMARK -0.002808 [-1.6386] 1.072328 [17.6409]** 0.825
Panel C: Short Government Retirement Funds (SG)
EW_GOV B10_20Y -0.000437 [-1.2772] 0.168055 [10.8559]** 0.5868
EW_GOV B7_10Y -0.000205 [-0.7241] 0.244023 [14.4895]** 0.7167
EW_GOV BB -0.000387 [-1.3354] 0.508789 [14.0355]** 0.7036
EW_GOV BB_US -0.001231 [-2.3692]* 0.274316 [4.6074]** 0.2037
For example, the equal weighted portfolio of INRT DMFPPs outperforms its style-adjusted self-developed benchmark (INC_BEN) by 4 basis points per month, but outperformance is statistically insignificant (t-statistic of 0.2383) with an adjusted R² of only 0.1457, the overall explanatory power of the model is rather weak. When looking at the performance difference between the three different DMFFPs categories, the INRT panel displays an average monthly underperformance of 9.45 basis points, the TD class a 31.03 basis points average monthly underperformance and the SG class a 2.78 basis points average monthly underperformance relative to their benchmarks. An average underperformance of around 9.45 basis points monthly, would translate to a 113 basis points annual underperformance, which is close to the average annual expense ratio of 84 basis points for this fund category. The SG categories underperformance is almost close to zero. This supports the findings of most of the existing literature that mutual funds underperform relative to their benchmarks and cost levels are the main contributor to the performance difference (Bauer & Kicken, 2008).
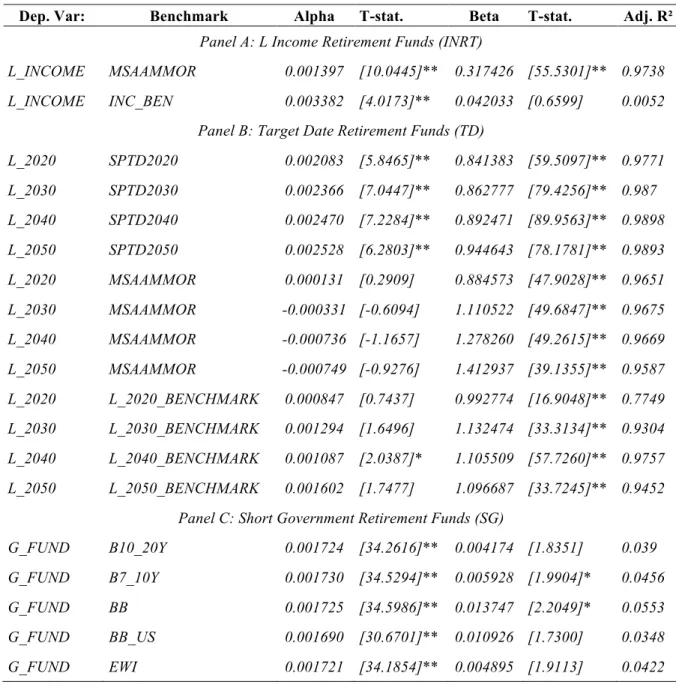
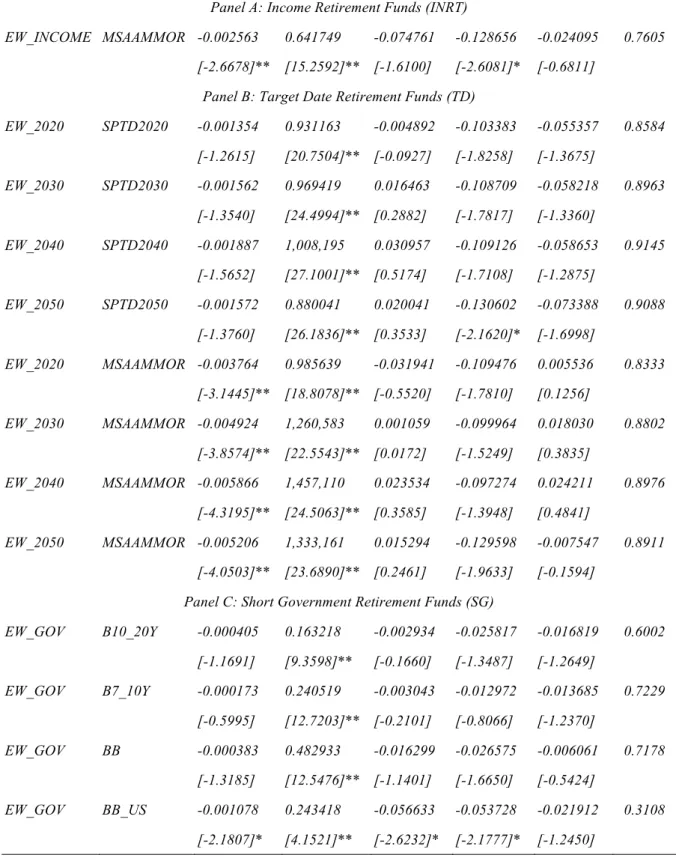
On the other hand, Table IV demonstrates that the alphas of the TSP funds are consistently positive and statistically significant. The entire INRT and SG panel are positive and highly significant at the 95% confidence interval. For example, the monthly alpha of the “L Income” fund equals 0.1397% (t-statistic of 10.04) relative to the MSAAMMOR benchmark and 0.3382% (t-statistic of 4.02) relative to the “L Benchmark”. For the latter, the “L Benchmark’s” beta is very low and insignificant and the adjusted R² is only 0.0052 indicating that there might be other factors that influence Jensen’s alpha. Additionally, the results suggest that the composition of the benchmark might not fully represent the individual allocation of the “L Income” fund. In the TD panel, results are mixed, varying relative with the style-adjusted benchmarks. TD funds generate positive and significant (t-statistic of 5.48, 7.04, 7.23 & 6.28) alphas when compared to the S&P TD benchmark, positive but mostly non-significant alphas relative to the “L Benchmark”, but negative non-significant alphas relative to Morningstar’s
MSAAMMOR benchmark. For example, the L_2050 TSP fund is able to outperform the S&P 2050 index by 25 basis points per month (t-statistic of 6.28). Overall, betas are significant and the adjusted R²s are statistically strong. The underperformance is strongest for the TD portfolios relative to the MSAAMMOR benchmark, where benchmark-adjusted returns show statistically significant monthly alphas of -0.34% to -0.55% (t-statistic of -2.93 and -4.19).
Table IV: Jensen’s Alpha (TSP)
This table reports the single-factor-model regression results given by !"#− !%#= '"+ ) !+#− !%# + ,"# based on monthly
TPS funds excess returns for a time period from Sept. 2009 to Sept. 2016 relative to several style-adjusted benchmarks. Alpha captures the monthly difference in performance of the DMFPPs portfolios relative to the style-adjusted benchmarks. * indicates (p < 0.1) significance at the 90% confidence level and ** mean (p<0.05) significance at the 95% confidence level.
Dep. Var: Benchmark Alpha T-stat. Beta T-stat. Adj. R²
Panel A: L Income Retirement Funds (INRT)
L_INCOME MSAAMMOR 0.001397 [10.0445]** 0.317426 [55.5301]** 0.9738
L_INCOME INC_BEN 0.003382 [4.0173]** 0.042033 [0.6599] 0.0052
Panel B: Target Date Retirement Funds (TD)
L_2020 SPTD2020 0.002083 [5.8465]** 0.841383 [59.5097]** 0.9771 L_2030 SPTD2030 0.002366 [7.0447]** 0.862777 [79.4256]** 0.987 L_2040 SPTD2040 0.002470 [7.2284]** 0.892471 [89.9563]** 0.9898 L_2050 SPTD2050 0.002528 [6.2803]** 0.944643 [78.1781]** 0.9893 L_2020 MSAAMMOR 0.000131 [0.2909] 0.884573 [47.9028]** 0.9651 L_2030 MSAAMMOR -0.000331 [-0.6094] 1.110522 [49.6847]** 0.9675 L_2040 MSAAMMOR -0.000736 [-1.1657] 1.278260 [49.2615]** 0.9669 L_2050 MSAAMMOR -0.000749 [-0.9276] 1.412937 [39.1355]** 0.9587 L_2020 L_2020_BENCHMARK 0.000847 [0.7437] 0.992774 [16.9048]** 0.7749 L_2030 L_2030_BENCHMARK 0.001294 [1.6496] 1.132474 [33.3134]** 0.9304 L_2040 L_2040_BENCHMARK 0.001087 [2.0387]* 1.105509 [57.7260]** 0.9757 L_2050 L_2050_BENCHMARK 0.001602 [1.7477] 1.096687 [33.7245]** 0.9452
Panel C: Short Government Retirement Funds (SG)
G_FUND B10_20Y 0.001724 [34.2616]** 0.004174 [1.8351] 0.039
G_FUND B7_10Y 0.001730 [34.5294]** 0.005928 [1.9904]* 0.0456
G_FUND BB 0.001725 [34.5986]** 0.013747 [2.2049]* 0.0553
G_FUND BB_US 0.001690 [30.6701]** 0.010926 [1.7300] 0.0348