1
Children’s exposure to indoor air in urban nurseries - Part I: CO2 and comfort assessment
P.T.B.S. Branco, M.C.M. Alvim-Ferraz, F.G. Martins, S.I.V. Sousa*
LEPABE – Laboratory for Process Engineering, Environment, Biotechnology and Energy, Faculty of Engineering, University of Porto, Rua Dr. Roberto Frias, 4200-465, Porto, Portugal
*Corresponding author:
Telephone: +351 22 508 2262 Fax: +351 22 508 1449
E-mail address: sofia.sousa@fe.up.pt
Postal address: Rua Dr. Roberto Frias, 4200-465, E215, Porto, Portugal This article was published in Environmental Research, 140, 1-9, 2015 http://dx.doi.org/10.1016/j.envres.2015.03.007
2
Abstract
Indoor air quality (IAQ) in nurseries is an emerging case-study. Thus, this study, as the Part I of the larger study “Children’s exposure to indoor air in urban nurseries”, aimed to: i) evaluate nurseries’ indoor concentrations of carbon dioxide (CO2), a global IAQ indicator, in class and
lunch rooms; ii) assess indoor comfort parameters – temperature (T) and relative humidity (RH); and iii) analyse them according to guidelines and references for IAQ, comfort and children’s health. Indoor continuous measurements were performed. Non-compliances with guidelines were found in comfort parameters, which could cause discomfort situations and also microbial proliferation. Exceedances in CO2 concentrations were also found and they were
caused by poor ventilation and high classroom occupation. More efficient ventilation and control of comfort parameters, as well as to reduce occupation by reviewing Portuguese legislation on that matter, would certainly improve IAQ and comfort in nurseries and consequently safeguard children’s health.
Keywords
3
1. Introduction
Evidence has been made that people spend most of their time in indoor environments and therefore are more exposed to indoor air pollutants (Sousa et al., 2012a) whose concentrations are often higher than outdoors (Jones, 1999).
Children’s exposure patterns are unlike those of adults (Nieuwenhuijsen et al., 2006). Children are more vulnerable, mainly due to their not fully developed immune and respiratory systems, their relative higher amount of air inhalation (the air intake per weight unit of a resting infant is twice that of an adult), and their growing tissues and organs; therefore, children have been considered a risk group (Salvi, 2007; Schwartz, 2004; Sousa et al., 2012b). In addition, children spend more time in school environments (including nurseries) than in any other indoor environments besides home (Branco et al., 2014b), and there is a correlation between pollutants concentrations and the onset of health problems in schoolchildren (Bono et al., 2015; Cartieaux et al., 2011). Due to different occupation patterns, activities and building characteristics, IAQ in nurseries seems to be different from primary or higher schools (Yoon et al., 2011), although this has been largely ignored (Ashmore and Dimitroulopoulou, 2009).
The increasing concern about these issues led to the arising of guidelines and standards to protect people’s health by ensuring a better IAQ. In this field of research, CO2 is usually
considered a global IAQ indicator, mainly because high concentrations indicate a poor air renovation rate which might indicate an accumulation of other pollutants in indoor air, and consequently may cause a negative influence on pupil’s learning ability (Griffiths and Eftekhari, 2008). Temperature (T) and relative humidity (RH) are also important in indoor air quality (IAQ), being considered as important comfort indicators. In fact, the American Society of Heating, Refrigerating and Air-Conditioning Engineers (ASHRAE) defined guidelines for these indoor comfort parameters.
With the growing interest in studying children’s exposure to air pollution, several methods using different approaches have been developed to assess it, and home and school have been the most studied indoor environments (Ashmore and Dimitroulopoulou, 2009). However, studies in school indoor environments have been mainly carried out in primary or higher schools, neglecting nurseries where pre-schoolers (including infants and toddlers) spend a significant part of their day. There were found some studies on nurseries, but some of them were mainly focused on ventilation, like Gładyszewska-Fiedoruk (2011), and/or on CO2
4
(2008). Other studies focused on PM assessment, like four of those reviewed by Sousa et al. (2012c), and others on the study of allergens (Arbes Jr et al., 2005; Salo et al., 2009). Zuraimi and Tham (2008) studied comfort parameters as well as air velocity and air exchange rates indoor, besides investigating concentrations of several air pollutants and evaluating their sources in child care centres in the tropical region of Singapore. Despite the large number of child care centres, samplings were only conducted in the middle of the week and from 8 a.m. to 5 p.m. (occupation periods), which did not allow understanding potential differences in IAQ between occupation and non-occupation periods (including nights and weekends). Yoon et al. (2011) measured indoor air concentrations of CO2, PM and other chemical compounds and
comfort parameters levels (T and RH) in Korean pre-schools. Roda et al. (2011) investigated IAQ of Paris child care centres to compare it with dwellings by measuring CO2, T and RH,
besides biological and other chemical pollutants. However, measurements were made passively during an entire week (except the weekend), which did not allow to understand pollutants variations along the day. St-Jean et al. (2012) also studied IAQ in day care centres of Montréal, in Canada, to determine its associations with building characteristics. Besides other chemical compounds, they considered comfort parameters and CO2, but these measurements were only
made during occupation periods.
In Portugal, besides one study by the authors focusing on PM assessment (Branco et al., 2014a) and another focusing on the levels of ultrafine particles in Portuguese preschools (Fonseca et al., 2014), there is only one study on IAQ in Portuguese day care centres (Carreiro-Martins et al., 2014) which assessed indoor CO2 concentrations (as a ventilation surrogate marker) and
comfort parameters, relating them to wheezing in attending children. Despite the considerable number of buildings and the three classrooms per building analysed, Carreiro-Martins et al. (2014) did not consider other indoor microenvironments besides classrooms and measurements were only performed for a short period during occupation (point in time determinations of CO2
instead of continuous measurements), meaning that comparisons between occupation and non-occupation conditions were not performed, as well as it was not possible to analyse if the results achieved were due to occupation, building materials, ventilation or even activities by the occupants.
There were not found studies directly focusing on the health risk assessment of children’s exposure to indoor air pollution in nurseries. This study introduces a new approach, by using data from continuous IAQ and comfort sampling on nurseries, thus enabling the assessment during occupation and non-occupation periods to understand the baseline scenarios, as well as
5
to estimate children’s exposure and to assess the associated health risks. Accordingly, following the study already reported focusing on PM assessment (Branco et al., 2014a) in the scope of INAIRCHILD project (Sousa et al., 2012a), and aiming to reduce the lacks above referred, this study aims to assess health risks associated to children’s exposure to indoor air pollution in urban nurseries. To meet this goal, the study was divided in: i) Part I – CO2 and comfort
assessment; and ii) Part II – gaseous pollutants and associated health risks assessment. Part I (the present study) aimed to: i) evaluate indoor concentrations of CO2 in different
microenvironments of urban nurseries in Porto city; ii) assess comfort parameters (T and RH) in those microenvironments; and iii) analyse those concentrations and comfort parameters according to guidelines and references for indoor air quality and comfort and children’s health.
2. Materials and methods
2.1. Sites description
This study was carried out on four different nurseries (N_URB1, N_URB2, N_URB3 and N_URB4), all located at urban sites influenced by traffic emissions in Porto (Portugal), inside the study area represented in Figure 1. N_URB1, N_URB2 and N_URB4 buildings are located in the same traffic busy street, and the front of the first two are directly facing that street. N_URB3 building is located in the same area although not in the same street.
A prior inspection to the studied nurseries and rooms (throughout observations and interviews with the staff) was developed to capture relevant information on activities, building characteristics and potential sources of pollution that could influence the results obtained in this study. These four nurseries have different management models: i) N_URB1 is a full private for-profit nursery; ii) N_URB2 is managed by a private institution of social solidarity, non-for-profit and with a mix of public and private funds; and iii) N_URB3 and N_URB4 are public children pre-schools, entirely managed with public funds by the municipality authorities and the Ministry of Education.
General description of N_URB1, N_URB2 and N_URB3 was reported in a previous study (Branco et al., 2014a) being summarized in Table 1. Infants (<1 year old) and toddlers (1-3 years old) used to spent all the period in the nursery inside the same classroom, both in N_URB1 and N_URB2. In all the four nurseries, pre-school children (3-5 years old) went to the lunch room to eat, so they used to have different daily patterns. Air conditioners and/or heaters were
6
only used in N_URB1, where windows were usually closed to prevent heat loss to the outside, so natural ventilation merely occurred throughout the doors to the inner corridors. Natural ventilation in the classrooms of N_URB2 and N_URB3 and in the lunch room of N_URB2 was made through windows opening to the small outdoor playgrounds. N_URB4 also had pre-school children, mixed in 3 different classrooms in the ground floor (single floor building). The electric heaters were often used during the sampling periods. All the classrooms had trickle vents in windows to outdoor as a natural ventilation system.
All the nurseries had a lunch room in the ground floor, equipped with a kitchen using gas stoves, except for N_URB3 and N_URB4 where there were no cooking activities as the food were brought already cooked into those nurseries.
Cleaning activities’ patterns were also different in all the four studied nurseries. In N_URB1, the daily cleaning activities in the younger children classrooms (<3 years old) were made during the sleeping time (after lunch), with children sleeping in their cots inside the classroom. In the other classrooms, cleaning used to be made during lunch time (when children were not in the classroom) or at the end of the afternoon after the occupation period. On the opposite, daily cleaning activities in the other three nurseries were made at the end of the afternoon (after the occupation period). Besides daily cleaning, in N_URB2 there was also deep cleaning, which was made on weekends; and in N_URB3 some daily cleaning in corridors and common spaces was made during the occupation period.
2.2. Sampling and analysis
Indoor air quality measurements were performed in 3 classrooms (A, B and C) in nurseries N_URB1 and N_URB2, and 2 classrooms (A and B) in N_URB3 and N_URB4, as well as in the lunch rooms of all the studied nurseries. Table 1 summarizes the sampling periods.
Indoor comfort parameters, namely T and RH, as well as CO2, were continuously measured
using an Haz-Scanner IEMS Indoor Environmental Monitoring Station (SKC Inc., USA) equipped with high sensitive sensors. Sampling methods and main characteristics of each sensor are summarized in Table 2.
The equipment was submitted to a standard zero calibration (available in the equipment) and data were validated prior to each measurement in the different rooms. Inside the rooms, the
7
equipment was placed as close to the middle as possible, far from the windows, doors and room’s corners, and approximately at the same height of the breathing zone of the children. Depending on the authorizations for sampling in each nursery, indoor measurements were performed from 2 to 9 days not simultaneously in each studied room, and in some cases both in weekdays and weekends. Sampling occurred between February and November 2013 (with a break during the summer holidays, from June to September). Measurements were logged each minute and hourly means were calculated.
The mean values were compared with reference standards and guidelines for general indoor environments, aiming to evaluate exceedances and/or non-compliances. Comparisons were performed, both for comfort parameters and CO2 concentrations, considering national and
international reference values, namely: i) Portuguese 2006 legislation (hourly means) (Decreto-Lei nº 79/2006) for CO2 (reference value of 1800 mg m-3); ii) Portuguese 2013 legislation (8
hour means) (Portaria nº 353-A/2013) for CO2 (reference value of 2250 mg m-3, plus 30% of
margin of tolerance (MT) if no mechanical ventilation system was working in the room); and iii) ASHRAE standard reference ranges (ASHRAE, 2007) for T (20-23.9 ºC in winter season, and 22.26.1 ºC in summer season) and RH (30-60%). For the Portuguese 2013 legislation, 8-hour running means were calculated and the daily maximum was compared with the reference value. Although Portuguese 2006 legislation was officially replaced by the new Portuguese 2013 legislation, comparisons were made with both due to the clear differences between them; the comparison of these two legislations allowed concluding on the expected impacts from the application of the new one.
Outdoor T was also sampled, simultaneously and using an electronic sensor (Global Water, WE700) located in a representative place (Mesquita, 2007).
The differences between hourly mean values in different sampling days for each microenvironment were analysed by the non-parametric Kruskal-Wallis test for the microenvironments where there were more than two complete sampling days, and by the Wilcoxon Rank Sum Test (also called Mann-Whitney U test) for those where there were only two complete sampling days. Also the non-parametric Wilcoxon Signed Rank Test was used to analyse if the differences along the day were significant, and the non-parametric Wilcoxon Rank Sum Test was used to analyse other differences, namely between weekdays and weekends, as well as between different microenvironments and nurseries. In all cases, a significance level () of 0.05 was considered. Descriptive statistics for the parameters were
8
calculated using MS Excel (Microsoft Corporation, USA), and other statistical analysis were determined using R software, version 3.1.2 (R Foundation for Statistical Computing, 2014).
3. Results and discussion
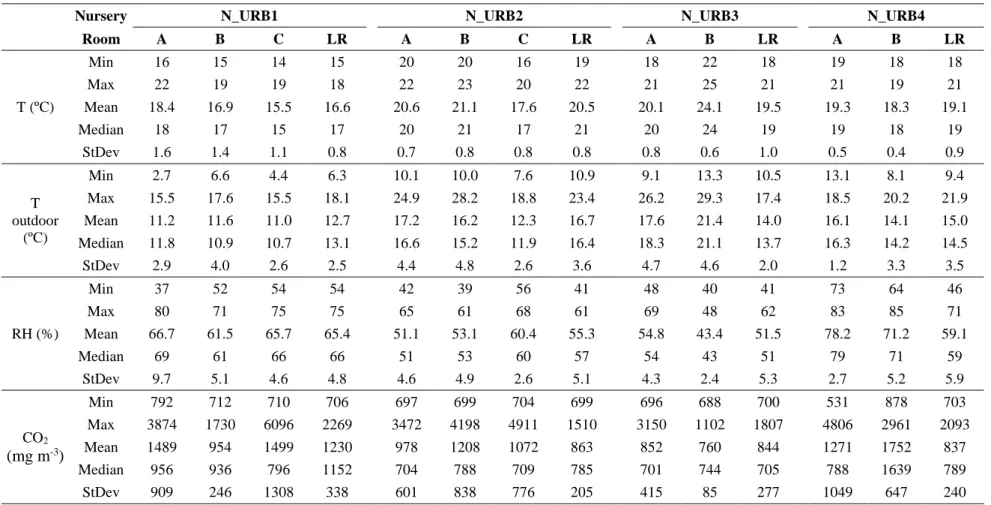
Table 3 summarizes the main statistical parameters (minimum, maximum, mean, median and standard deviation) of the hourly mean values of indoor and outdoor T, RH and CO2, for each
room of the four nurseries.
When comparing two or more consecutive sampling days in each of the studied microenvironments, there were found statistical significant differences (p < 0.05) in only 25% of the cases regarding CO2. This made possible to assume a daily mean scenario (daily mean
profiles) for CO2 further analysis. Although the differences in T and RH values between
consecutive sampling days in each microenvironment seemed to be small, there were found statistical significant differences (p < 0.05) in 67% of the cases regarding both T and RH. Despite this, a daily mean scenario was also assumed for the following analysis.
Figure 2 shows, as an example, the daily profile for each day of measurement of (a) CO2 in
classroom B of N_URB2 on weekdays, and (b) T in classroom C of N_URB2 on weekdays.
3.1 Comfort parameters
T and RH hourly means obtained in each studied room of the four nurseries are represented respectively in: i) Figure 3 (a) N_URB1, (b) N_URB2, (c) N_URB3 and (d) N_URB4; and ii) Figure 4 (a) N_URB1, (b) N_URB2, (c) N_URB3 and (d) N_URB4. Both for T and RH, means were always very similar to the medians (Table 3).
The highest T indoors was found in N_URB3 classroom B (25 ºC) and the lowest in N_URB1 classroom C (14 ºC). On weekend there were not found significant variations (p > 0.05) along the day (Figure 3). On weekdays it was possible to find a slight increase during occupation periods, in all the studied nurseries. Outdoors, T hourly means were usually higher during sampling in N_URB2 and N_URB3 rather than during sampling in N_URB1 and N_URB4. Statistical significant differences (p < 0.05) in the range values of indoor T between the four nurseries seemed to be due to the differences observed in outdoor T (Figure 3 and Table 3). Depending on the meteorological conditions outdoors, those indoor may also be altered, mainly
9
due to the ventilation system used and the building thermal isolation. Thus, seasonal meteorological patterns may have an important influence in the indoor thermal conditions. Regarding RH (Figure 4), the lowest RH was observed in N_URB1 (37%), and the highest in classroom B of N_URB4 (85%). RH was almost constant when there was no occupation in the rooms and fluctuations were verified during occupation periods. Those differences generally started as a decrease in RH in the first couple of hours, followed by an increase after that period of time. Although this was common in the studied rooms, in N_URB4 classrooms (A and B) RH slightly increased when occupation started. In N_URB3, classroom B had clearly the lowest RH with no statistically significant differences along the day (p > 0.05). In N_URB4, a major statistically significant difference (p < 0.05) was found between the lunch room and the classrooms, and RH on weekdays in classroom A were often found higher than 80%, especially during occupation periods.
Table 4 shows the non-compliances (%) to the ASHRAE guidelines (referred in section 2.2.) of T and RH mean values measured on weekends, weekdays and only during occupation periods. The values presented in the table are the percentage (%) of the total measured hourly means which were outside (below and/or above) the ASHRAE reference ranges.
It was common to find lower T and higher RH values than those recommended by ASHRAE, mainly when rooms were unoccupied but also during occupation periods. Not only the building characteristics (such as the poor thermal isolation and the visible water infiltrations in classroom A in N_URB1), but also an inadequate use or misuse of heaters and air conditioning systems (in all the classrooms of N_URB1) were found to be the probable causes for these results. Thermal discomfort is an expected symptom in children attending these nurseries. In tropical child day care centres in Singapore, Zuraimi and Tham (2008) reported T and RH means of 29.4 ºC and 74.3%, respectively, for natural ventilated classrooms, and 26.1 ºC and 58.3%, respectively, for air-conditioned classrooms. Natural ventilated classrooms had higher values due to the higher outdoor temperatures (when compared with those indoors) in that tropical region, which were as expected higher than those found in this study. St-Jean et al. (2012) found higher T and much lower RH (mean T 22.3 ºC, and mean RH 31.3%), in Montréal, Canadian child day care centres in a winter period when building ventilation was generally low. In Parisian child day care centres (75% of which using a mechanical ventilation system), Roda et al. (2011) registered mean T of 22.4 ºC (cold season) and 23.4 ºC (hot season) generally higher than those found in this study for both seasons, and RH of 35.4% (cold season) and 45.8% (hot
10
season) lower than those found in the present study, and in both cases in the comfort range recommended by ASHRAE. Also Yoon et al. (2011) in Korean pre-schools in hot season (late spring and summer) found indoor T mean (25.7 ºC) higher than in N_URB2 and N_URB3, and RH mean (73.2% in the morning and 70.1% in the afternoon) higher than those found in N_URB1, N_URB2 and N_URB3 but similar to those of the two classrooms of N_URB4, and in all cases out of ASHRAE comfort range. In a Portuguese study of child day care centres in Porto and Lisbon urban areas (Carreiro-Martins et al., 2014) the T median (19.5 ºC) reported (for cold season) were higher than those of N_URB1 and N_URB4 classrooms. Additionally, lower RH median (54.6%) than in the majority of the classrooms studied except for classrooms A and B of N_URB2 and N_URB3 were also reported. However, comparing with those results could be tricky, not only because they were collected by point in time samplings and not continuously thus adding higher error margins, but also because of studies’ seasonal differences.
3.2 CO2 concentrations
CO2 mean concentrations obtained for all the studied nurseries are represented in Figure 5 (a)
N_URB1, (b) N_URB2, (c) N_URB3, and (d) N_URB4).
A statistically significant difference (p < 0.05) was found between the daily profile in weekdays and in the weekend. For the latter one, CO2 concentrations were found to be almost constant (p
> 0.05) along the day and were generally below 1000 mg m-3. The same happened during
weekdays on non-occupation periods. On the other hand, poor ventilation increased CO2
concentrations during occupation periods. In fact, it was one of the main causes of the observed CO2 concentrations and led to the accumulation of CO2 in indoor air, mainly with two daily
peaks of concentrations – one in the morning and another in the afternoon – corresponding to the periods of higher occupation and activities inside classrooms. It was a common phenomenon especially in those spaces without direct (natural or air-conditioned) ventilation to outdoors (like classrooms B and C of N_URB1). Nevertheless, in N_URB2 different behaviours were observed in classrooms A and B, because children slept there after lunch time. When children went to have lunch in the lunch rooms, lower concentrations were observed in classrooms, but usually not as low as those observed during the night and weekends. On the other hand and as expected, in the lunch rooms CO2 concentrations increased during lunch time due to children’s
11
occupation period (Table 3). CO2 concentrations in N_URB3 classrooms were in general lower
than in the classrooms of the other nurseries during occupation periods, particularly in classroom B due to natural ventilation directly to outdoors.
Besides poor ventilation, the high number of children in each classroom was concerning and a main determinant of the CO2 concentrations found. Although always according to Portuguese
legislation regarding the number of children per classroom, both for infants under 3 years old (Portaria nº 262/2011) and for pre-schoolers (Despacho nº 5048-B/2013), these nurseries were exceeding the ASHRAE recommended guidelines of 25 occupants per 100 m2 (ASHRAE, 2007): the number of children per 100 m2 varied between 29 (in classroom B of N_URB1 and in classroom A of N_URB2), and 51 (in classroom A of N_URB3 and in classroom B of N_URB4). Occupational densities were found higher in pre-schoolers’ classrooms than in the ones for infants, and in public managed nurseries (N_URB3 and N_URB4) than in the private ones (N_URB1 and N_URB2). This circumstance led to the increase of CO2 concentrations in
classrooms to values above the Portuguese legislated standards. The Portuguese legislation regarding the number of children per classroom (Despacho nº 5048-B/2013; Portaria nº 262/2011), which was only made based on educational and economic criteria and it is less restrictive than ASHRAE recommended guidelines, showed to be insufficient to ensure good IAQ inside classrooms. Zuraimi and Tham (2008) and St-Jean et al. (2012) also described occupational density as a determinant factor for CO2 concentrations and reported CO2
concentrations higher than those found in the present study. Moreover St-Jean et al. (2012) also referred a high occupational density when comparing with ASHRAE recommendation.
Exceedances (%) to the Portuguese legislations (2006 and 2013) referred in the section 2.2. of the mean CO2 concentrations measured on weekdays and only during occupation periods are
represented in Table 5. The values presented on the table are the percentage (%) of the measured hourly or 8-hour running means which were above the Portuguese 2006 and 2013 reference values, respectively. Moreover, in the rooms where there were no mechanical ventilation, a 30% margin of tolerance (MT) was applied to the Portuguese 2013 reference value (Portaria 353-A/2013). The CO2 concentrations observed in this study were not only due to
overcrowding, but also due to poor ventilation during occupation periods. Moreover, although classrooms A and C of N_URB2, and lunch rooms of N_URB1, N_URB3 and N_URB4 had natural ventilation to inner corridors, contrarily to what happened in other classrooms in which doors/windows were always closed (Table 1), CO2 concentrations were also high and above the
12
bellow the Portuguese standard during occupation periods. Indeed, other authors have reached similar conclusions. The overcrowding and closing of windows and doors during classrooms’ occupation periods (to avoid noise and reducing indoor temperatures) caused the higher CO2
concentrations found by Yang et al. (2009) (1817.81 µg m-3) and by Yoon et al. (2011) (1546.56 µg m-3). Gładyszewska-Fiedoruk (2011) reported similar CO2 concentrations in a nursery on
north-eastern Poland, and also highlighted the importance of good natural ventilation, which could be achieved by the correct use of a stack ventilation system. This type of system was used in the classrooms of N_URB4 (trickle vents in windows), nevertheless it seemed to be insufficient to reduce CO2 indoor concentrations during occupation periods, which led the
authors to believe that it was not well dimensioned. Also Roda et al. (2011) reported the significance of ventilation for the IAQ. In the referred study, similar and higher CO2 mean
concentrations were found in Parisian child day care centres (where a mechanical ventilation system was used in 75% of the cases studied, and higher CO2 concentrations were found in cold
season). Carreiro-Martins et al. (2014) reported a CO2 median concentration of 1440 ppm (2685
µg m-3) in indoor air of Portuguese child day care centres, which they reported to be a cause of occupation and poor ventilation. That value was found higher than median values in the rooms studied in the present study; nevertheless that was collected by point in time samplings (short-term measurements) in the occupation period, thus being tricky to make these comparisons, as above discussed.
As a global indicator of IAQ, the high CO2 concentrations found can indicate the accumulation
of indoor air pollutants from indoor sources, like formaldehyde and other volatile organic compounds, and are health concerning because they could lead to several symptoms and health effects on children, like headaches, fatigue, loss of concentration and absenteeism (Jones, 1999).
It was possible to observe a considerable number of non-compliances for indoor comfort parameters, as well as for CO2. As expected, it was possible to observe from the results that the
new Portuguese legislation is less restrictive. Exceedances to Portuguese 2006 standards were always higher during occupation periods than on weekdays in general. Moreover, it is also important to refer that the results here presented were similar to those obtained in Portuguese child care centres by Carreiro-Martins et al. (2014) and in Portuguese primary schools by Almeida et al. (2011) (for CO2), and Pegas et al. (2012) (for T, RH and CO2). School activity,
namely inadequate ventilation, was also identified in those studies as one of the main determinants of IAQ in primary schools.
13
4. Conclusions
The presence of children (occupation) and their routines, building characteristics and ventilation habits seemed to be the main determinants of IAQ and comfort.
Building characteristics and an inadequate use of heaters and air conditioning systems seemed to determine low temperature and high relative humidity, being thermal discomfort an expected symptom in children attending these nurseries.
CO2 concentrations were also found high, and several times exceeding the Portuguese
standards, which was due to: i) the high occupation rate (overcrowding) in the studied classrooms when compared to ASHRAE recommendation, although the number of children per classroom was always found according to the Portuguese legislation for educational purposes; and ii) poor ventilation – closing windows and doors during classrooms’ occupation periods (to avoid noise and heat loss). A worse scenario was found in the public managed nurseries rather than in the private ones. Headache, fatigue, loss of concentration and absenteeism are possible health symptoms for children attending these nurseries.
Thus, it is extremely recommended the implementation of simple and cost-effective measures to mitigate the critical IAQ and comfort situations, namely behavioural changes, like more efficient ventilation habits, and more efficient control of indoor thermal comfort conditions (by using correctly heaters and air conditioners).
It could also be necessary to review the Portuguese legislation on the number of children per classroom, considering IAQ and children’s health issues. Further research should include the study of other indoor air pollutants and other urban, suburban and rural nurseries to help supporting these findings.
Acknowledgements
The authors are grateful to the nurseries involved in this study. The authors are also grateful to Fundação para a Ciência e a Tecnologia (FCT), COMPETE, QREN and EU for PTDC/SAU-SAP/121827/2010 funding. PTBS Branco and SIV Sousa are also grateful to FCT, POPH/QREN and European Social Fund (ESF) for the financial support of grants SFRH/BD/97104/2013 and SFRD/BPD/91918/2012, respectively.
14
References
Almeida, S. M., Canha, N., Silva, A., Freitas, M. d. C., Pegas, P., Alves, C., et al., 2011. Children exposure to atmospheric particles in indoor of Lisbon primary schools. Atmospheric Environment. 45, 7594-7599.
Arbes Jr, S. J., Sever, M., Mehta, J., Collette, N., Thomas, B., Zeldin, D. C., 2005. Exposure to indoor allergens in day-care facilities: Results from 2 North Carolina counties. Journal of Allergy and Clinical Immunology. 116, 133-139.
Ashmore, M. R., Dimitroulopoulou, C., 2009. Personal exposure of children to air pollution. Atmospheric Environment. 43, 128-141.
ASHRAE, ASHRAE Standard 62.1-2007: ventilation for acceptable indoor air quality. The American Society of Heating, Refrigerating and Air-Conditioning Engineers (ASHRAE), Atlanta, GA, 2007, pp. 46.
Bono, R., Tassinari, R., Bellisario, V., Gilli, G., Pazzi, M., Pirro, V., et al., 2015. Urban air and tobacco smoke as conditions that increase the risk of oxidative stress and respiratory response in youth. Environmental Research. 137, 141-146.
Branco, P. T. B. S., Alvim-Ferraz, M. C. M., Martins, F. G., Sousa, S. I. V., 2014a. Indoor air quality in urban nurseries at Porto city: Particulate matter assessment. Atmospheric Environment. 84, 133-143.
Branco, P. T. B. S., Alvim-Ferraz, M. C. M., Martins, F. G., Sousa, S. I. V., 2014b. The microenvironmental modelling approach to assess children's exposure to air pollution – A review. Environmental Research. 135, 317-332.
Carreiro-Martins, P., Viegas, J., Papoila, A. L., Aelenei, D., Caires, I., Araujo-Martins, J., et al., 2014. CO2 concentration in day care centres is related to wheezing in attending children. Eur J Pediatr. 173, 1041-9.
Cartieaux, E., Rzepka, M. A., Cuny, D., 2011. Qualité de l’air à l’intérieur des écoles. Archives de Pédiatrie. 18, 789-796.
Decreto-Lei nº 79/2006, Ministério das Obras Públicas, Transportes e Comunicações. Diário da República - I Série, Nº 67, 2416-2468.
15
Despacho nº 5048-B/2013, Ministério da Educação e Ciência, Gabinetes do Secretário de Estado do Ensino e da Administração Escolar e do Secretário de Estado do Ensino Básico e Secundário. Diário da República - 2ª Série, Nº 72, 12320(4)-12320(5).
Fonseca, J., Slezakova, K., Morais, S., Pereira, M. C., 2014. Assessment of ultrafine particles in Portuguese preschools: levels and exposure doses. Indoor Air. n/a-n/a.
Gładyszewska-Fiedoruk, K., 2011. Analysis of stack ventilation system effectiveness in an average kindergarten in north-eastern Poland. Energy and Buildings. 43, 2488-2493.
Griffiths, M., Eftekhari, M., 2008. Control of CO2 in a naturally ventilated classroom. Energy and Buildings. 40, 556-560.
Jones, A. P., 1999. Indoor air quality and health. Atmospheric Environment. 33, 4535-4564. Mesquita, C., A influência de factores meteorológicos nas concentrações de ozono superficial na cidade do Porto. Universidade do Minho, 2007.
Nieuwenhuijsen, M., Paustenbach, D., Duarte-Davidson, R., 2006. New developments in exposure assessment: The impact on the practice of health risk assessment and epidemiological studies. Environment International. 32, 996-1009.
Pegas, P. N., Nunes, T., Alves, C. A., Silva, J. R., Vieira, S. L. A., Caseiro, A., et al., 2012. Indoor and outdoor characterisation of organic and inorganic compounds in city centre and suburban elementary schools of Aveiro, Portugal. Atmospheric Environment. 55, 80-89. Portaria nº 262/2011, Ministério da Solidariedade e da Segurança Social - Diário da República - 2ª Série, Nº 167, 4338-4343.
Portaria nº 353-A/2013, Ministérios do Ambiente, Odenamento do Território e Energia, da Saúde e da Solidariedade, Emprego e Segurança Social - Diário da República - 1ª Série, Nº 253, 6644(2)-6644(9).
Roda, C., Barral, S., Ravelomanantsoa, H., Dusséaux, M., Tribout, M., Le Moullec, Y., et al., 2011. Assessment of indoor environment in Paris child day care centers. Environmental Research. 111, 1010-1017.
Salo, P. M., Sever, M. L., Zeldin, D. C., 2009. Indoor allergens in school and day care environments. Journal of Allergy and Clinical Immunology. 124, 185-192.e9.
16
Salvi, S., 2007. Health effects of ambient air pollution in children. Paediatric Respiratory Reviews. 8, 275-280.
Schwartz, J., 2004. Air pollution and children's health. Pediatrics. 113, 1037-1043.
Sousa, S. I., Ferraz, C., Alvim-Ferraz, M. C., Vaz, L. G., Marques, A. J., Martins, F. G., 2012a. Indoor air pollution on nurseries and primary schools: impact on childhood asthma--study protocol. BMC Public Health. 12, 435.
Sousa, S. I., Pires, J. C., Martins, E. M., Fortes, J. D., Alvim-Ferraz, M. C., Martins, F. G., 2012b. Short-term effects of air pollution on respiratory morbidity at Rio de Janeiro--Part II: health assessment. Environ Int. 43, 1-5.
Sousa, S. I. V., Alvim-Ferraz, M. C., Martins, F. G., 2012c. Indoor PM10 and PM2.5 at Nurseries and Primary Schools. Advanced Materials Research. 433-440, 385-390.
St-Jean, M., St-Amand, A., Gilbert, N. L., Soto, J. C., Guay, M., Davis, K., et al., 2012. Indoor air quality in Montréal area day-care centres, Canada. Environmental Research. 118, 1-7. Theodosiou, T. G., Ordoumpozanis, K. T., 2008. Energy, comfort and indoor air quality in nursery and elementary school buildings in the cold climatic zone of Greece. Energy and Buildings. 40, 2207-2214.
Yang, W., Sohn, J., Kim, J., Son, B., Park, J., 2009. Indoor air quality investigation according to age of the school buildings in Korea. Journal of Environmental Management. 90, 348-354. Yoon, C., Lee, K., Park, D., 2011. Indoor air quality differences between urban and rural preschools in Korea. Environmental Science and Pollution Research. 18, 333-345.
Zuraimi, M. S., Tham, K. W., 2008. Indoor air quality and its determinants in tropical child care centers. Atmospheric Environment. 42, 2225-2239.
17
Figure captions
Figure 1 - Location of the study area in Porto city, Portugal.
Figure 2 - Daily profile for each day of measurement of a) CO2 in classroom B of N_URB2
on weekdays, and b) T in classroom C of N_URB2 on weekdays.
Figure 3 - Daily profile of T means registered indoors of a) N_URB1, b) N_URB2, c) N_URB3, and d) N_URB4.
Figure 4 - Daily profile of RH means registered indoors of a) N_URB1, b) N_URB2, c) N_URB3, and d) N_URB4.
Figure 5 - Daily profile of CO2 mean concentrations registered indoors of a) N_URB1, b)
18
Table 1 – Summary of the main characteristics of each studied room and sampling periods.
Nursery Room Type of use Children’s
age (years) Floor
Area (m2) Occupation (Children + staff) Occupation Period Ventilation Sampling time (weekdays + weekend days) N_URB1
A Classroom 1 Ground floor
(back) 38 17+2 07h30 – 19h30
Windows to outdoor closed. Door to inner
corridor almost always closed. A/Ca on. 5 + 2
B Classroom 3 1st floor (front) 21 6+1 09h – 11h30
15h – 15h30
Windows to outdoor closed. Door to inner corridor almost always closed. No A/C.
Electric/oil heater on.
2 + 0
C Classroom 5 2nd floor (front) 59 23+2 08h – 11h30
15h30 – 17h30
Windows to outdoor closed. Door to inner corridor almost always closed. No A/C.
Electric/oil heater on.
3 + 2
LR Lunch room 3-5 Ground floor
(back) 38 21 to 74 11h30 – 13h30
Open to kitchen and to inner corridor. No
direct connection to outdoor. 4 + 0
N_URB2
A Classroom <1 Ground floor
(front) 34 10+2
09h – 12h00 15h30 – 18h
Windows directly to outdoor (traffic street) closed – opened only after occupation. Door to inner corridor always open. Open passage
to cribs room and a small lunch room.
2 + 2
B Classroom 2 Ground floor 40 18+2 09h30 – 11h 12h – 16h30
Door to inner corridor almost always closed. Direct access to outdoor playground often
opened. No A/C and heating off.
3 + 0
C Classroom 4 Ground floor
(back) 50 25+2
09h30 – 12h 14h – 16h30
Door to inner corridor almost always opened. Direct access to outdoor playground often
closed. No A/C and heating off.
3 + 2
LR Lunch room 1-5 Ground floor
(back) 92 17 to 68 11h – 12h30
Open to kitchen, to inner corridor, and to
outdoor (during occupation). 2 + 0
N_URB3
A Classroom 3-5 Ground floor 45 23+2 09h – 11h30 13h30 – 16h
Door to inner corridor often closed. Passage to outdoor playground usually opened. No
A/C and heater.
3 + 2
B Classroom 3-5 1st floor 36 35+2 16h – 19h
Door to inner corridor often opened. Window to outdoor open during occupation. No A/C
and heater.
2 + 0
LR Lunch room 3-5 Ground floor 56 17 to 45 11h30 – 13h30 Open to inner corridor and kitchen. Windows
to outdoor closed. 2 + 0 N_URB4 A Classroom 3-5 Ground floor 51 21+2 09h – 12h
14h – 17h30
Trickle vents in windows to outdoor. Heating
19
a A/C – Air Conditioner
B Classroom 3-5 Ground floor 51 26+2 09h – 12h 14h – 17h30
Trickle vents in windows to outdoor. Heating
system was off. 2 + 0 LR Lunch room 3-5 Ground floor 104 ~240 12h – 14h Windows to outdoor closed and no trickle
20
Table 2 – Sampling methods and main characteristics of each sensor.
Sensor Detection methods Sensor minimum resolution Sensor accuracy Measurement range
T Electrochemical sensor 1 ºC +/- 3% of ºC -20 to 60 ºC RH Electrochemical sensor 1% +/- 3% 5-100% CO2 Non-dispersive infrared (NDIR) detection 92 mg m -3 < +/- 10% of reading or 2% of full scale – whichever is greater 0-9150 mg m-3
21
Table 3 – Statistical parameters of the hourly mean data for each room studied in the four nurseries.
Nursery N_URB1 N_URB2 N_URB3 N_URB4
Room A B C LR A B C LR A B LR A B LR T (ºC) Min 16 15 14 15 20 20 16 19 18 22 18 19 18 18 Max 22 19 19 18 22 23 20 22 21 25 21 21 19 21 Mean 18.4 16.9 15.5 16.6 20.6 21.1 17.6 20.5 20.1 24.1 19.5 19.3 18.3 19.1 Median 18 17 15 17 20 21 17 21 20 24 19 19 18 19 StDev 1.6 1.4 1.1 0.8 0.7 0.8 0.8 0.8 0.8 0.6 1.0 0.5 0.4 0.9 T outdoor (ºC) Min 2.7 6.6 4.4 6.3 10.1 10.0 7.6 10.9 9.1 13.3 10.5 13.1 8.1 9.4 Max 15.5 17.6 15.5 18.1 24.9 28.2 18.8 23.4 26.2 29.3 17.4 18.5 20.2 21.9 Mean 11.2 11.6 11.0 12.7 17.2 16.2 12.3 16.7 17.6 21.4 14.0 16.1 14.1 15.0 Median 11.8 10.9 10.7 13.1 16.6 15.2 11.9 16.4 18.3 21.1 13.7 16.3 14.2 14.5 StDev 2.9 4.0 2.6 2.5 4.4 4.8 2.6 3.6 4.7 4.6 2.0 1.2 3.3 3.5 RH (%) Min 37 52 54 54 42 39 56 41 48 40 41 73 64 46 Max 80 71 75 75 65 61 68 61 69 48 62 83 85 71 Mean 66.7 61.5 65.7 65.4 51.1 53.1 60.4 55.3 54.8 43.4 51.5 78.2 71.2 59.1 Median 69 61 66 66 51 53 60 57 54 43 51 79 71 59 StDev 9.7 5.1 4.6 4.8 4.6 4.9 2.6 5.1 4.3 2.4 5.3 2.7 5.2 5.9 CO2 (mg m-3) Min 792 712 710 706 697 699 704 699 696 688 700 531 878 703 Max 3874 1730 6096 2269 3472 4198 4911 1510 3150 1102 1807 4806 2961 2093 Mean 1489 954 1499 1230 978 1208 1072 863 852 760 844 1271 1752 837 Median 956 936 796 1152 704 788 709 785 701 744 705 788 1639 789 StDev 909 246 1308 338 601 838 776 205 415 85 277 1049 647 240 A – Classroom A; B – Classroom B; C – Classroom C; LR – Lunch Room
22
Table 4 – Non-compliances (%) to the ASHRAE guidelines for temperature (T) and relative humidity (RH) mean values measured on weekdays, only during occupation periods and on weekends.
Nursery Room Weekdays Only during occupation periods Weekend
Ta RHb Ta RHb Ta RHb N_URB1 A 68 67 38 62 100 100 B 100 54 100 55 n.a. n.a. C 100 85 100 96 100 85 LR 100 87 100 63 n.a. n.a. N_URB2 A 100 9 100 24 100 0 B 94 1 87 3 n.a. n.a. C 100 72 100 71 100 19 LR 100 9 100 0 n.a. n.a. N_URB3 A 100 33 100 22 100 0 B 2 0 0 0 n.a. n.a. LR 100 7 100 0 n.a. n.a. N_URB4 A 60 100 19 100 100 100 B 100 100 100 100 n.a. n.a. LR 73 44 0 67 n.a. n.a.
a) % of hourly mean values above and/or below the reference range of 22.8-26.1ºC; b) % of hourly mean values above and/or below the reference range of 30-60%; n.a. – data not available because there were no measurements on weekends in these rooms
23
Table 5 – Exceedances (%) to the Portuguese legislation (2006 and 2013) of CO2 mean concentrations measured on weekdays and only during occupation periods.
Nursery Room Weekdays Only during occupation periods
2006 legislation a 2013 legislation b 2013 legislation c 2006 legislation a
N_URB1 A 40 80 - d 78 B 0 0 0 0 C 43 100 100 76 LR 5 0 0 38 N_URB2 A 21 50 0 59 B 14 0 0 33 C 23 33 33 65 LR 0 0 0 0 N_URB3 A 17 0 0 33 B 0 0 0 0 LR 2 0 0 25 N_URB4 A 42 100 100 81 B 47 100 100 88 LR 1 0 0 33
a) % of hourly mean concentrations above the reference value of 1800 mg m-3; b) % of 8-hour running mean concentrations above the reference value of 2250 mg m-3; c) % of
8-hour running mean concentrations above the reference value of 2925 mg m-3 (2250 mg m-3+ 30% of margin of tolerance); d) in this room the margin of tolerance was not
24
Figure 1.
Study area
25 (a) (b) Figure 2. 0 500 1000 1500 2000 2500 3000 3500 4000 4500 5000 9 10 11 12 13 14 15 16 17 18 19 20 21 22 23 0 1 2 3 4 5 6 7 8 CO 2 (m g m -3) Hour
Day 1 Day 2 Day 3
0 5 10 15 20 25 30 35 10 11 12 13 14 15 16 17 18 19 20 21 22 23 0 1 2 3 4 5 6 7 8 9 T e m p e ra tu re (º C ) Hour
26 (a) (b) (c) (d) Figure 3. 0 5 10 15 20 25 30 35 0 1 2 3 4 5 6 7 8 9 10 11 12 13 14 15 16 17 18 19 20 21 22 23 T e m p e ra tu re (º C ) Hour
Classroom A - week Classroom A - weekend Classroom B Classroom C - week Classroom C - weekend Lunch room
0 5 10 15 20 25 30 35 0 1 2 3 4 5 6 7 8 9 10 11 12 13 14 15 16 17 18 19 20 21 22 23 T e m p e ra tu re (º C ) Hour
Classroom A - week Classroom A - weekend Classroom B Classroom C - week Classroom C - weekend Lunch room
0 5 10 15 20 25 30 35 0 1 2 3 4 5 6 7 8 9 10 11 12 13 14 15 16 17 18 19 20 21 22 23 T e m p e ra tu re (º C ) Hour
Classroom A - week Classroom A - weekend Classroom B Lunch room
0 5 10 15 20 25 30 35 0 1 2 3 4 5 6 7 8 9 10 11 12 13 14 15 16 17 18 19 20 21 22 23 T e m p e ra tu re (º C ) Hour
27 (a) (b) (c) (d) Figure 4. 0 10 20 30 40 50 60 70 80 90 100 0 1 2 3 4 5 6 7 8 9 10 11 12 13 14 15 16 17 18 19 20 21 22 23 R e la ti v e H u m id ity (% ) Hour
Classroom A - week Classroom A - weekend Classroom B Classroom C - week Classroom C - weekend Lunch room
0 10 20 30 40 50 60 70 80 90 100 0 1 2 3 4 5 6 7 8 9 10 11 12 13 14 15 16 17 18 19 20 21 22 23 R e la ti v e H u m id ity (% ) Hour
Classroom A - week Classroom A - weekend Classroom B Classroom C - week Classroom C - weekend Lunch room
0 10 20 30 40 50 60 70 80 90 100 0 1 2 3 4 5 6 7 8 9 10 11 12 13 14 15 16 17 18 19 20 21 22 23 R e la ti v e H u m id ity (% ) Hour
Classroom A - week Classroom A - weekend Classroom B Lunch room
0 10 20 30 40 50 60 70 80 90 100 0 1 2 3 4 5 6 7 8 9 10 11 12 13 14 15 16 17 18 19 20 21 22 23 R e la ti v e H u m id ity (% ) Hour
28 (a) (b) (c) (d) Figure 5. 0 1000 2000 3000 4000 5000 6000 0 1 2 3 4 5 6 7 8 9 10 11 12 13 14 15 16 17 18 19 20 21 22 23 CO 2 (m g m -3) Hour
Classroom A - week Classroom A - weekend Classroom B Classroom C - week Classroom C - weekend Lunch room
0 1000 2000 3000 4000 5000 6000 0 1 2 3 4 5 6 7 8 9 10 11 12 13 14 15 16 17 18 19 20 21 22 23 CO 2 (m g m -3) Hour
Classroom A - week Classroom A - weekend Classroom B Classroom C - week Classroom C - weekend Lunch room
0 1000 2000 3000 4000 5000 6000 0 1 2 3 4 5 6 7 8 9 10 11 12 13 14 15 16 17 18 19 20 21 22 23 CO 2 (m g m -3) Hour
Classroom A - week Classroom A - weekend Classroom B Lunch room
0 1000 2000 3000 4000 5000 6000 0 1 2 3 4 5 6 7 8 9 10 11 12 13 14 15 16 17 18 19 20 21 22 23 CO 2 (m g m -3) Hour