Competitive Dynamics and Economic
Growth in China: The Case of Shenzhen
Flavia Vardaro
Dissertation written under the supervision of Prof. Peter V. Rajsingh.
Dissertation submitted in partial fulfilment of requirements for the MSc in
Management, at the Universidade Católica Portuguesa, 12/06/2020.
Flavia Vardaro 2 ABSTRACT
China is poised to become one of the dominant economic forces in the world and today with the ability to affect the financial stability of every country in an interconnected global system of trade and finance. This study was conducted to understand what incentives, structural and social and political phenomena shaped the competitive dynamics leading to meteoric economic growth in China. Cities and clusters is where state and market forces interact most directly; to understand key insights, patterns of growth, future risks and opportunities we decided to focus the analysis on the case of Shenzhen, China’s fastest-growing, experimental city. Since there are numerous theories and frameworks to understand competitive dynamics, we created a three -layered conceptual taxonomy of 16 index variables based on salient aspects that emerged from an extensive literature review. To gain further qualitative understanding of the proposed conceptual model, we conducted a survey distributed to people living and working in Shenzhen and China. The research found the major causal factor for extraordinary economic growth was central and local government adaptive efficiency which ushered in reforms and capital injections from Beijing. Shenzhen is a striking example of successful competitive dynamics and market-oriented reforms. However, factors like the debt burden, lack of transparency, corruption within institutions and fragile foreign affairs are likely to impact the long-term competitive sustainability.
Key words: Competitiveness, China, Shenzhen, Clusters, Innovation, Economic Growth Title: Competitive Dynamics and Economic growth in China: The case of Shenzhen Author: Flavia Vardaro
Flavia Vardaro 3 RESUMO
A China está prestes a se tornar uma das forças econômicas dominantes no mundo e hoje pode afetar a estabilidade financeira de cada país. Este estudo foi realizado para entender que incentivos, estruturais, sociais e políticos moldaram a dinâmica competitiva levando ao crescimento econômico meteórico na China. Cidades e clusters é onde as forças do estado e do mercado interagem mais diretamente; para entender os principais padrões de insights de crescimento, riscos futuros e oportunidades, decidimos focar a análise no caso de Shenzhen, a cidade experimental e de crescimento mais rápido da China. Já que já existe um número imenso de teorias e frameworks para entender a dinâmica competitiva, criamos um sistema de taxonomia conceitual de três camadas composto por um conjunto de 16 variáveis de índice com base em aspetos salientes emergidos pela extensa revisão da literatura. Além disso, para obter insights qualitativos do modelo conceitual proposto, realizamos uma pesquisa distribuída às pessoas que vivem e trabalham em Shenzhen e na China. A pesquisa concluiu que o grande crescimento econômico foi impulsionado pela eficiência adaptativa do governo ce ntral e local, abrindo reformas e injeções de capital em Pequim. Através da evolução mostrada por suas variáveis econômicas, Shenzhen é um exemplo marcante da realização de uma dinâmica competitiva bem-sucedida e de uma reforma orientada para o mercado. No entanto, desvantagens como o peso da dívida, a transparência e a corrupção das instituições e a fragilidade dos negócios estrangeiros são suscetíveis de impactar a sustentabilidade a longo prazo do país.
Palavras-chave: Competitividade, China, Shenzhen, Clusters, Inovação, Crescimento Econômico
Título: Dinâmica Competitiva e crescimento econômico na China: O caso de Shenzhen Autor: Flavia Vardaro
Flavia Vardaro 4 ACKNOWLEDGEMENTS
Foremost, with boundless love and appreciation, thank you Sofia.
My deep and sincere gratitude goes to Professor Peter V. Rajsingh, who expertly guided me through my journey and who shared the excitement of never stop learning.
I would like to acknowledge my friends and colleagues for supporting me both on and off the pitch, making these years an extraordinary experience.
Above ground, I am extremely grateful to my family for its understanding, enthusiasm and for pushing me further than I thought I could go.
Flavia Vardaro 5
Table of Contents
1. INTRODUCTION 6
1.1 Significance of the topic 6
2. LITERATURE REVIEW 8
2.1. About competitiveness 8
2.2. Competitiveness in China 12
2.3. Characteristics of cities and clusters in China 15
3. CASE STUDY OF SHENZHEN 20
3.1. Study Area 20
3.2. Methodology 21
a. Concept framework and index variables 21
b. Data sample and processing 22
3.3. The analysis of Shenzhen’ competitiveness 23
a. Level A – Macro & Micro 23
b. Level B – SIPI and MFP 28
c. Level C – Innovation 30
3.4. Survey results 32
a. First section – Shenzhen 33
b. Second section – China 33
4. CONCLUSION 35
4.1. Directions for Future Research and Limitations 37
5. REFERENCE LIST 39
Flavia Vardaro 6
1.
Introduction
This dissertation is an intrinsic type of case study (Stake, 1995) which focuses on the competitive dynamics that shaped Chinese economic growth. The work concentrates on analysis of cities and clusters, in particular, the case of Shenzhen. According with the literature, case studies aim to explore individuals or organizations, through complex interventions, relationships, or programs and support the deconstruction and the subsequent reconstruction of various phenomena using a variety of data sources (Yin et al., 1985). The purpose of this paper is to explore the different manifestations of competitiveness in China and consequently answer the following research questions:
1. What incentives, structural, social and political phenomena have shaped the competitive dynamics leading to meteoric economic growth in China?
2. How do China’s fundamental institutions structure shape the business landscape? 3. What is driving all the changes in patterns of growth and structure and how cities and
clusters are enabling global scale?
4. Why Shenzhen can be a proxy for understanding macro factors peculiar of the Chinese economic growth?
To address these questions, the study is organized into four sections. This introductory section sets the contexts, asks the research questions and introduces the organization of the paper. The second part presents an extensive literature review about the concept of competitiveness, narrowing into the meaning of this term for China. The third section is the core of the paper, presents the case study of Shenzhen, and includes three sub-sections: study area, methodology and analysis of data. Next, the fourth section, concludes the article and suggests limitations of this study and thematic strands of further research.
1.1 Significance of the topic
China is poised to become the dominant economic force in the world. Internal dynamics have made it possible for the country to become at the heart of the global supply chain and will enhance its sustainable growth. China became the world’s largest economy in terms of purchasing-power- parity terms in 2014, is a global power in scale, but not always in global integration. Despite China’s opening and relaxation policies, operational and regulatory complexities in China’s financial markets remain a constraint for international players. China’s disclosure to the world in trade, technology, and capital has plunged in relative terms.
Flavia Vardaro 7 Conversely, the world’s exposure to China has increased. This reflects the readjusting of the Chinese economy toward domestic consumption, as the majority of Chinese enterprises’ revenue still comes from the home economy (Woetzel et al., 2019). The Mainland opening and reforms have offered economies of the rest of the world huge benefits, indeed, consumers benefited from lower and accessible prices thanks to Chinese imports and international firms have tapped into new sources of growth (Woetzel et al., 2019). As far as trade is concerned, China in the last ten years has become one of the major players in terms of both supplier and market; the country exports in 33 countries and it’s a very attractive source of imports with more than 65 countries importing in the Mainland. In terms of capital, even if the country is the world’s second-largest source of outbound FDI and recipient of inbound FDI, its financial system still is far from globalized. Moving towards a consumer market-based economy and with consumers’ purchasing behavior shifting towards e-commerce, the country has the highest percentage of internet users in the world generating an incredible amount of data, however the use of the information gathered is still limited to the country level, with cross -border data flow very low compared to the US. Also, the country has the world largest number of outgoing students and largest outbound travel market for in terms of both trips and expenditures. Factors such as higher income and friendlier visa policy encouraged the Chinese people to travel, indeed outbound trips are expected to reach 160 million by 2020 (Woetzel et al., 2019).
Flavia Vardaro 8
2.
Literature Review
2.1. About competitiveness
The term ‘competitiveness’ originated from the Latin prefix ‘con’ meaning together and the Latin word ‘petere’ meaning to seek, attack, aim at, desire (Siudek and Zawojska, 2014). In the literature, authors’ definitions of competitiveness range from those considering a nation’s competitiveness from the macro-perspective (the classical approach) to those concentrating on firms or farms, thus looking at competitiveness in micro-economic terms (the neoclassical approach) (Siudek and Zawojska, 2014).
In accordance with Porter (2003) competition is defined as one of society’s most impressive powers for improving conditions in numerous fields of human undertaking. The concept of competitiveness is hard to define and lacks a universally accepted definition; It usually refers to a country’s performance, defined by a set of indices like inflation, unemployment rate, growth and living standards (Lawrence, 2002). Furthermore, it can be applied to individual products or services, enterprises, industries, economic sectors, regions, nations or international economic blocks. Competitive indicators that measure competitiveness can help define the concept in each of the mentioned areas (Siudek and Zawojska, 2014).
According to Marginean (2006), we can distinguish between micro and macroeconomic interpretations of the concept. At the macroeconomic level, she identified at least three ways to see competitiveness: Competitiveness as productivity; Competitiveness as capacity to create welfare; Competitiveness as ability to sell on external markets (Marginean, 2006).
To cite some popular definitions in the literature, touching on productivity, we can mention Krugman (1994) who stated that, if competitiveness has any meaning, it is simply just another way to express productivity. The capacity of a nation to improve its quality of life depends mostly on its capacity to increase its productivity (Krugman, 1994).
Michael Porter and the World Economic Forum define national competitiveness as a set of factors, policies and institutions that determine the level of the productivity of a country. Raising productivity - meaning making better use of the resources – is the driving force behind the rates of return on investment which, in turn, determine the aggregate growth rate of an economy. (Global Competitiveness Report, 2007). This adhere to the WEF definition that
Flavia Vardaro 9 suggested that competitiveness composed by institutions, reforms and variables that can enhance the productivity of a nation (Schwab et al., 2018).
Recently, ex-ECB President Mario Draghi, defined a competitive economy as one in which “institutional and macroeconomic conditions allow productive firms to thrive and in turn, the
development of these firms supports the expansion of employment, investment and trade”
(quoted in Altomonte and Bekes, 2016). This productivity–oriented view of competitiveness uses as a measure of competitiveness the Growth Competitiveness Index (GCI) developed by Jeffrey Sachs and John McArthur in 2001. The 2002 World Economic Forum published the annual report on Global Competitiveness where we can find rankings related to Global Competitiveness Index, Growth Competitiveness Index, etc. (Schwab, 2019).
The second dimension highlighted by Marginean, (2006) is competitiveness as capacity to create welfare. In 1971, Bobba et al., defined competitiveness as the capacity of nations, regions and companies to produce wealth being the prequisite for high wages.
Many specialists argue that standards of living are a meaningful measure of competitiveness at macroeconomic level (Marginean, 2006). The definition proposed by European Competitiveness Reports is the key element for this interpretation of competitiveness: in the EC view, competitiveness is understood to mean high and rising standards of living of a nation or a group of nations with the lowest possible level of involuntary unemployment, on a sustainable basis (Balkytė and Tvaronavičienė, 2010). Interest in competitiveness increases particularly in countries and regions that are performing relative poorly compared to other geographical zones (Marginean, 2006). This suggests a close link between the meaning of competitiveness and the ability of an economy to create wealth for its citizens compared to other economies. The interpretation of competitiveness as ability to create welfare has to include an “outcome assessment” and a “process assessment” (Aiginger, 2006). The definition of ‘outcome competitiveness’ as the welfare of a nation correlates with per capita income, employment, distributional, social and ecological goals. The definition of ‘process competitiveness’ refers to processes and capabilities generating competitiveness.
The third dimension, according to Marginean, (2006), is the ability to sell in a market: the main rival to productivity/base definition of competitiveness is the market–share based definition. It defines competitiveness as the ability to sell on international markets and is fundamentally concerned with the sustainability of an economy’s overall external balance. In this view,
Flavia Vardaro 10 competitiveness is a country’s share of world markets for its products. This makes competitiveness a zero-sum game, since one nation's benefit comes to the detriment of another (Porter, 2003). Exports can result from subsidies or other incentives provided, for instance by exchange rate misalignment. Such incentives can explain the growth of the country’s share of the world market, but this is not based on Ricardian comparative advantage. Real competitiveness and nominal competitiveness are two different ways to achieve a better position in the world trade.
According to Delgado et al. (2012), building on the economic development literature, there exist two broad dimensions of macroeconomic competitiveness -- social infrastructure and political institutions (SIPI), and monetary and fiscal policy (MFP).
First, SIPI includes basic health and education, the quality of political institutions, and the rule of law. In recent years, a number of important analyses have identified such institutions and their long-term impact as a crucial source of disparity in productivity and wealth across nations (E.g., La Porta et al., 1998; Hall and Jones, 1999; Acemoglu et al., 2001; Rodrik et al., 2004).
The second broad dimension of macroeconomic competitiveness is MFP, which includes measures of fiscal sustainability and debt and inflation policies for managing short and medium -term fluctuations of economic activity (E.g., Fischer, 1993). While it has a clear impact on short-term economic activity, the literature finds only weak effects on long-term productivity differences. By and large, existing evidence shows that competition and a well -crafted competition policy framework can help to improve welfare and other macroeconomic outcomes (Dutz and Hayri, 1999; Strahan and Cadell, 2004; Aghion and Griffith, 2005). From a policy viewpoint, SIPI and MFP are commonly designated or largely affected by the national regime (Delgado et al., 2012).
On the other hand, the literature presents many studies regarding the microeconomic foundation of competitiveness (Şeyda and Cüreoğlu, 2013).
According to Porter “the competitiveness of a nation has microeconomic foundations” (Porter, 2003). Most debates on competitiveness and economic advancement dealt with macroeconomic, political, legal, and social issues yet these circumstances are fundamental but not sufficient as they serve as an opportunity to create wealth, but they do not actually create
Flavia Vardaro 11 wealth. Wealth is indeed built at microeconomic levels of the economy, grounded in the poise of firms as well as in the nature of the microeconomic business environment in which a nation’s companies compete. Therefore, the macroeconomic, political, legal, and social reforms will not bloom unless microeconomic conditions improve (Porter, 2003). Microeconomic determinants of competitiveness are very distinct phenomena.
Going beyond comprehensive institutional factors, microeconomic competitiveness is grounded on specific characteristics of the domestic business environment ( e.g., whether business policies improve or hinder investment and development), the arrangement of economic activity (e.g., the degree of local competition and the magnitude of congestion from cluster development), and the adoption of advanced business management approaches ( e.g., whether firms use fiscal stimulus). Porter (1990) was one of the first academic to pinpoint the role of microeconomic variables in shaping the productivity and wealth of a country.
A significant body of empirical evidence now emphasizes the role of microeconomic policies, structure and practices in national and regional economic performance (among others, Dertouzos, et al, 1989; Saxenian, 1994; Porter, 1998, 2003; Bloom and Van Reene n, 2007; Bloom et al., 2009; Freeman and Shaw, 2009; Delgado et al., 2010).
Microeconomic variables have the capacity to affect both firm’s productivity and workforce mobilization (Delgado et al., 2012). Microeconomic concepts and indicators of competitiveness have a solid theoretical base because they focus on the essential characteristics of producers in competition for market share and profits or ability to export. This ability can be measured by the size or increase of market share, performance, price ratios, cost competitiveness or by multidimensional indicators (Siggel, 2006).
In the literature there is evidence of three broad and interrelated drivers of competitiveness: social infrastructure and political institutions, monetary and fiscal policy, a nd the microeconomic environment (Delgado et al., 2012)
However, none of these approaches is satisfactory today because of the increasing importance that innovation plays in both advanced and developing countries in creating and sustaining competitiveness (Distanont and Khongmalai, 2018).
Flavia Vardaro 12 Competitiveness can be seen as the result of a constant innovation process that enables firms to catch up and keep up in terms of technology as the mode of competition changes. (Mytelka, 1999). In order to understand how competitiveness in the developing countries is created and sustained it is important to further analyze the elements that enhance the innovating process.
Understanding how competitiveness is created and sustained in developing countries requires a deeper analysis of factors pertaining to the innovating process within firms in those countries. In sum, one cannot assume linearity in the relationship between competition and competitiveness. Instead, as the above analysis illustrates, the link between these t wo processes is intermediated by other factors that affect innovation.
Mytelka (1999) assumes that since competition in the current context of globalization is increasingly innovation-based, it is important for technological ‘latecomers’ to integrate innovation into the relationship between competition and competitiveness. Her study demonstrates the importance of continuous innovation over time for latecomers in how and what they produce, so costs decline, and quality constantly improves. Latecomers thus n eed policies to stimulate development of appropriate management and organizational techniques, as well as development of a domestic science and technology base.
An inspiring approach to the competitiveness is offered by Schumpeter (1934) in his theories of the entrepreneur and innovation stating that the mere capability of creating innovations and an owner’s entrepreneurial activities determine the firm’s competitive advantage. A company’s ability to innovate is, therefore, key for achieving competitive advantage over rivals. The ability to create new solutions and a disposition for risk-taking undergirds the competition process and entrepreneurship. Differences in the level of innovative capacity and entrepreneurship explain differences in competitive positions of any economic agent (Karlsson et al., 2019).
2.2. Competitiveness in China
The source of China’s Competitiveness since 1979 has been her declining transaction costs. These are costs that hinder or facilitate mutually beneficial trade among people across time and space and the costs of maintaining and changing institutions and incentives for trade, investment, and growth. Indeed, competitiveness can be seen as follows:
Flavia Vardaro 13 where factor costs depend on supply and demand conditions while transaction costs depend on institutions, institutional change and technology (Geng, 2019).
According to the Nobel Laureate in economics Douglass C. North, institutio nal change is the admixture of formal rules, informal norms, and enforcement characteristics that shape economic performance. Also, politics significantly shape economic performance because they define and enforce economic rules (North, 2008).
Geng (2019) argues that China’s institutions address economic, social and environmental challenges and have driven its rapid growth since the late 1970s. Indeed, a proper understanding of China’s institutions and reform processes is crucial to any analysis of the country’s rapid development. Within its rapidly changing dynamics, the Chinese political system is characterized by its ability to respond and adapt, implementing the institutional innovations and policy reforms required to meet changing problems and needs (Ahlers, 2014). Accordingly, Tsai (2006) adopted the term “adaptive informal institutions” to describe the actions undertaken by Chinese officials. Geng et al., (2015) claim that looking at the matrix of China’s institutions, we can understand China’s competitive dynamics. Institutional changes and economic performances in China are characterized by adaptive efficiency. The drivers of this are the state -market dynamics, the central-local/SOE dynamics and the global governance-sovereign states dynamics. The matrix of relationships among institutions, also called the “tiáo-tiáo kuài-kuài” – literally, “lines and pieces”, is formed by the tiáo-tiáo which refers to the vertical lines of control from the central government through national organs to local-level institutions. They include central planning concerning development and reform; the nomination and promotion of officials to important posts in ministries, state-owned enterprises, and local governments at all levels; and macroeconomic tools, particularly fiscal, monetary, exchange -rate, and regulatory policies. The other element, the kuài-kuài refers to the lateral, highly competitive relationships among regional entities, to which the central government delegates a certain amount of autonomy. In order to achieve genuine stability, China’s leaders have always strived to find a delicate balance between tiáo-tiáo control and kuài-kuài autonomy.
Kuài-kuài is the competitive market of local governments: China’s economic mechanism largely depends on local-government competition as this complement market rivalries between companies. Competition occurs horizontally in which entities with similar responsibilities compete on the same level (Cheung, 2009). Local politicians compete for two main reasons.
Flavia Vardaro 14 On one hand, the bureaucratic-promotion structure drives officials to seek economic growth through successful reforms. On the other hand, officials pursue strong economic moves to increase their prestige and responsibility external to the promotion structure (Geng et al., 2015).
Clearly, local governments play an important role in China’s economic growth as they are directly involved in the economy and have significant autonomy and freedom of action w ithin their jurisdictions (Yang, 1994; Oi, 1995; Fitzgerald, 1996; Yep, 2004; Unger and Chan 2008; Saich and Hu 2012). Oi (1995) uses the term “local state corporation” to emphasize how local governments treat local enterprises as key elements of their administrative provinces that are sources of growth for the country. Local government authorities are both market participants and drivers of development and competition. The interaction between the state and the market also occurs in cities, where needs and challenges produce local innovations that can then be implemented on a larger and politically effective scale. Local government competition creates strong incentives and constraints for officials to foster productivity and create value by deploying market’s resources, capital and talent and to avoid rent-seeking and corrupt behavior that does not create new wealth. Therefore, this local competition stimulates innovation that, in turn, supports achieving country-wide goals. Local governments, contrary to western economies behave like firms, yet with a strong exposure to moral hazards. (Geng et al., 2015).
Tiáotiáo describes how although, local competition may be a fundamental element of China’s economic dynamism, proper supervision and direction is also cru cial. This is the task undertaken by tiáotiáo institutions which are the basic means of central control. Central government is in charge of policymaking and administration, party control, national planning, fiscal relationships and market regulation. The sophisticated interaction that ti áo-kuài play builds an unconventional combination of long-term policy commitment and institutionalized policy experimentation (Xu, 2010).
This competition between local governments, guided and constrained by central control, is the fulcrum of the institutional model of China’s political economy. The tiáo-kuài mechanisms create political frictions that improves institutions. How accurately private -sector markets operate is, in turn, determined by the quality of those institutions (Xu, 2010).
According to a large body of literature, competition and a well-crafted competitive policy framework can help improve welfare and other macroeconomic outcomes (Dutz and Hayri
Flavia Vardaro 15 1999; Strahan and Cadell, 2004; Aghion and Griffith 2005; OECD 2014). The WEF (2019) placed China at number 28 in the global competitive index, its ranking unchanged from the previous year. Its score increased by 1.3 points, characterized by an important rise in ICT adoption (78.5, 18th). China is the best performer among the BRIC economies and the country’s assets, including the size of its market (both the domestic and export markets), and macroeconomic stability, rank it 98.8 and 39th. In several areas, China’s performance aligns with OECD standards. For instance, China exceeds 25 OECD countries in ICT adoption. Life expectancy is 1.5 years longer than in the United States and only 0.8 years shorter than the OECD average. Infrastructure is also a strength (77.9, 36th) and the country has been rapidly increasing its innovation capability (64.8, 24th) (Schwab, 2019).
Aburaki (2013) argued that the true nature and scope of China’s competitiveness is in key technology areas, as well as the current state of China’s economic policies. The country has also adequately used competition among individuals, companies, cities, and provincial administrations to make sure that all stakeholders grant to productivity and GDP growth (Geng and Sheng, 2018).
Until now, China’s achievement was based on constructive competition between local governments and different departments, benchmarked according to performance indicators such as GDP and fiscal revenues. Unfortunately, this has led to problems of social inequity and environmental sustainability, which require complex coordination between siloed bureaucracies to overcome resistance from powerful vested interests (Geng and Sheng, 2012). Competitifueled growth, occurring across multiple dimensions between market and n on-market actors, has propelled China emerging as the world’s second-largest economy. But this is unsustainable. The imperative now is to recalibrate competitive forces to address the array of negative externalities caused by state and market activities that harm citizens’ interests (Geng and Sheng, 2014).
2.3. Characteristics of cities and clusters in China
From the reform era that began in 1978 (Garnaut et al., 2018), China’s cities became institutionally important and more independent in terms of economic p lanning and management. From the 90s, local governments started to be considered as proper entities with
Flavia Vardaro 16 not only social and governance responsibilities, but also in charge of local government financing vehicles (I.e. infrastructure projects) (Garnaut et al., 2018).
At the same time, the centralized hukou1 system created a regime of migrant workers providing
a cheap and captive labor force for factories in cities. China’s economic miracle is largely predicated upon a labor arbitrage whereby cheap labor and higher productivity would turn China into the manufacturer of first and last resort in the global economy (Cheng and Selden, 1994). Residents were divided into urban ‘hukou’ holders and agricultural ones. This resident permit system restricted heavily migration; however, in the 90s relaxation of policy and reforms permitted migration flow more freely allowing the urbanization process. Rural to urban migration increased dramatically during the first ten years of the twenty-first century, although the system has been largely relaxed, limitations still exists and mirror into some social factors such as relative income and educational levels. Since about 2003, policy -makers have implemented measures and policies to abolish this traditional dualistic system; most substantial steps have been the reduction of ‘ urban bias ’ to raise rural compensation, the encouragement of migration, combined with loosening of urban residence permit system (“New-Style Urbanization) and the strengthening farmer property rights in land (Chan, K. W., 2019).
The centralized command economy has created a level of uniformity across cities in terms of infrastructure and production capacities. But since regulations, policies and institutions are locally managed, different outcomes and growth paradigms also arise. Researchers have sought to understand the development trajectories of different cities and analyze how the balance between people, profit and planet can be rendered more sustainable. (Geng et al., 2015).
Geng et al. (2015) argue that cities represent the locus where state-market dynamics interact most explicitly. Urban studies offer insights on China’s growth model pertaining to past, present and future risks and opportunities as they explicitly affect market, social, institutional and economic activities. Cities drive business and household activities and push local and central governments to be more responsive to economic, socio-political and environmental factors. China’s municipal areas comprise of more than 300 autonomous entities that behave like small
1Hukou is a system of household registration used in mainland China. Until very recently, each citizen was classified in an
agricultural or non-agricultural hukou (commonly referred to as rural or urban) and further categorized by location of origin
Flavia Vardaro 17 states, controlling and managing resources to optimize economic, industrial and urban development.
A major driver of the growth of cities is the continuous development of economic specialization caused and sustained by urbanization processes. (Turok and Mcgranahan, 2013).
Fujita and Thisse (2002) and Krugman (1991) explain that concentrations of economic activity can result in endogenous and scalable increases in efficiency, thus attracting human capital which is positively correlated with productivity and crucial for a city’s development (Rosen, 1983). Not only human capital, but also infrastructure and sector -specific institutions are requisites for a city’s long-term development (Acemoglu et al., 2004; Rodrik, et al, 2004; Rodrik, 2007; Saxenian, 1994; Becattini, 1990). Several studies highlight the positive externalities generated by clusters that promote economic growth such as the talent pool, infrastructure development and innovation capacity. These positive outcomes are driven and sustained by the critical role played by political and social institutions and effective policies. Also, local measures and development successes influence regional and, in turn, national growth and innovation. (Best, 1990; Brusco, 1982; Piore and Sable, 1984; Morgan and Sayer, 1988; Scott, 1993; Wolfe and Gertler, 1998).
As Porter (1998) outlined competitiveness depends on improving knowledge and creativity through clusters. This view aligns with theories from the “endogenous school” concerning regional development which points out that clusters are organized and independent entities that create and sustain competitive advantage through coordinated efforts (Courlet and Soulage, 1995; Garofoli, 2002; Lawson and Lorenz, 1999; Mailat, 1998).
According to Mytelka and Farinelli (2000), clusters can be developed into two ways; the first is when clusters emerge in a spontaneous way due to geographical proximity of group of interconnected and different parties. The second way is when clusters are inducted, thus designed by policy makers to promote industrial development, innovation, competitiveness and growth. Clusters in general, can be characterized by innovation systems, mainly explicated in three forms (learning, linkage and investment) that help develop and sustain activities of different actors of the cluster (Mytelka, 2000).
This innovation-system process is based on three cluster-related elements. First, clusters enhance and deepen local understanding. This is enhanced by including design, quality controls
Flavia Vardaro 18 and marketing. Second, clusters stimulate deepening of learning inputs. Finally, clusters are capable of transforming low tech industries into pools filled with tacit knowledge that yield competitive advantage. This knowledge transferability within an individual cluster stimulates investment and growth in innovation. Clusters thus align with Schumpeter’s notion of entrepreneurs being the driving force behind competitiveness (Schumpeter, 1934). Clusters offer market opportunities and favorable conditions for entrepreneurial activities, stimulating innovation and improving productivity (Meier Zu Koecker, 2016).
Reducing transaction costs is crucial for China’s evolving growth model (Geng, 2019). Clusters create solid vertical relationships between different actors (i.e. suppliers and use rs) that reduce costs, risks and time to market associated with new products or innovation (Lundvall, 1988; Lundvall, 1992; Ernst et al., 1998, Nelson, 1993). At the same time, horizontal links between small and medium enterprises of the same industry generate ‘collaborative efficiency’ (Schmitz, 1995). Location advantages play an important role for cluster development (Best, 1990; Camagni, 1986; Piore and Sable, 1984; Tolomelli, 1990; Saxenian, 1994).
A national economy is an aggregation of regional ones. Its strength depends on the competitiveness of each sector. Several studies detail the positive relationship between GDP per capita and cluster concentrations, as well as cluster strength and wage levels in clusters (Mills et al., 2008).
According to Geng and Sheng (2018), Between 1978 and 2012, China’s impressive GDP growth allowed the country to lift more than 500 million people out of poverty. Data shows that the top 100 cities employ roughly 53% of the total population and generated 75.7% of China’s GDP in 2016. The national average GDP growth of 6.7% has been outpaced by six of those 100 cities, reaching more than 10% annual GDP growth. Furthermore, in 33 Chinese cities, per capita GDP is at a ‘high income’ level (using the World Bank standards).
Defined areas or clusters are distinguished by the presence of several smart cities. The major ones are the Yangtze River Delta (YRD), the Pearl River Delta (PRD), and the Beijing - Tianjin-Hebei cluster (BTH). By 2014, the PRD had expanded into the Greater Bay Area (GBA), covering nine cities around the PRD in Southern Guangdong, among them Shenzhen and Guangzhou plus Hong Kong and Macau. China is currently working towards the creation of 19 supercity clusters, by tightening links among cities. Those clusters are projected to account for
Flavia Vardaro 19 about 80% of the country’s total GDP by 2030. These clusters will not only facilitate economic growth but will be crucial in addressing structural social challenges such as inequality, pollution and excess capacity. The PRD’s competitiveness is mainly due to Deng Xiaoping reforms which transformed the region and to the technological progress which drove down transaction costs, improving market efficiencies through more rational resource allocation. (K amal-Chaoui et al., 2009).
Flavia Vardaro 20
3.
Case Study of Shenzhen
3.1. Study Area
The research focuses on a selected coastal city located in South China in Guangdong province, adjacent to Hong Kong, Shenzhen. The dramatic economic growth of China enabled the country to become the second largest economy of the world and undoubtedly, cities and clusters have played and still play a crucial role in spurring and sustaining competitive dynamism.
Among them, the most important is the Pearl River Delta, by 2014, the PRD had morphed into the Guangdong-Hong Kong-Macao Greater Bay Area, that comprises the Hong Kong and Macao special administrative regions and the nine cities of the Guangdong province, among them Shenzhen. Promoting the advancement of the Greater Bay Area is a notable decision made by the Central Committee of the Communist Party of China (CPC) under the leadership of Comrade Xi Jinping and facilitated the province to become the biggest contributor to Chinese GDP (Upton, 2019).
Shenzhen is the fastest-growing experimental city that developed from an angling village into a global city in 40 years, it is nowadays known as the 'China's Silicon Valley'. The city of Shenzhen was set up in 1979, the following year, it was home for the first Special Economic Zone and in December 2018 Shenzhen Special Cooperation Zone was authoritatively established. The city was planned as a national pilot city for thorough transformation and reforms. The administration of Shenzhen has effectively determined its own changes of functions and fortified the development of a service-oriented government. The city under the guidance of building a law-based, mindful and effective government, has improved its regulatory transparency and management efficiency, so as to give a reasonable, straightforward, productive and law-based environment for the advancement of the general public and welfare of the residents. The government rejected the ‘one-size fits all’ approach and implemented the so called ‘BREEP methodology’ (browse, research, experiment, evaluate and push forward) enabling flexible and responsive reforms; therefore, Shenzhen started to lead the pack in completing the market-oriented reform of the economic system. The city has advanced in more than 1,000 unique fields in the nation, from building the primary export-oriented economic development zone in China to holding China's first land sell off, from taking the lead in "bringing in" to "going worldwide” and to implementing comprehensive reforms in economic,
Flavia Vardaro 21 political, cultural, social, ecological civilization and Party building systems. Shenzhen keeps on creating a world-class business environment to enormously animate the market vitality. It is the national economic, science and innovation center, regional financial, commercial and logistics heart. Shenzhen today has achieved efficiency in specialization, and it is a proxy for understanding China’s growth (Upton, 2019).
3.2. Methodology
a. Concept framework and index variables
The approach is qualitative and descriptive, the intent is not to try constructing another index of city competitiveness, several are already available; rather this study analyses the state of Chinese competitiveness and the pursuit for a competitive Shenzhen from macro, micro and innovation perspectives, drawing upon the international competitiveness literature (part II). The report then provides a definition of city competitiveness and creates a simple taxonomy of four drivers of competitiveness. It is really hard to evaluate the overall level of a city’s competitiveness by only a single indicator; indeed, we developed an index system that covers all the aspects of the city’s competitiveness. Therefore, the taxonomy system we developed is divided into three main levels, as shown in Table 1. The first level (level A) analyses the macro - and micro- factors that characterize competitiveness. The second level (level B), investigates external factors peculiar of the Chinese government matrix: social infrastructure and political institutions (SIPI), and monetary and fiscal policy (MFP). The third level (level C) covers the innovative and technological elements that enhance the competitiveness of a city.
Table 1. Competitive Framework
SC2 Level A – Macro & Micro
- GDP growth rates - Labour market statistics - FDI
- Wages, income levels - House Prices
- Market characteristic - Exports/global trade - Basic Infrastructure
Flavia Vardaro 22 Level B – SIPI and MFP - Social infrastructure and political institutions
- Fiscal and monetary policy
Level C – Innovation - ICT adoption - Environmental level - Innovation capability - Entrepreneurial culture - Patents - R&D levels Source: Author
In addition to secondary research, we decided to carry out an empirical analysis of the proposed conceptual model based on the survey instrument. The survey consisted of 18 questions and 2 matrix table type of questions where the respondents had to answer with a 7-point Lickert scale. The aim was to gain a qualitative understanding of competition from an internal perspective thus from people living and working in Shenzhen and China in general.
b. Data sample and processing
There are mainly three data sources in this study. The first two sources are annual statistical reports, statistical yearbooks and networks, published by accredited statistical institutions, both at the state and city level; the last source is the published reports and research data from international statistical institutions or companies. The statistical data ranges from 1979 to 2018. Because of the existence of missing data for certain indicators in certain years, different year ranges have been considered for the analysis of a particular index for a specific purpose. After having collected sufficient data sources, scientific methods were conducted to further analyze patterns in order to enable the purpose of the research. In accordance with the research objectives, the data should explain the characteristics and determinants that enabled the creation and growth of Shenzhen.
Concerning the empirical analysis, the survey was distributed to a sample of 200 Chinese citizens. Participants were given a link to fill out anonymously. The amount o f finished surveys was 144; respondents not living in China (24%) have not been taken into account, as not significant for the scope of the research. Given the 109 relevant responses, the 79,3% of participants either live in Shenzhen or own a business there, while the remaining in other cities
Flavia Vardaro 23 of China. The 60% of the respondents are employed, 82,7% employed by Private sector and for‐profit organization, 5,8 % by Nonprofit organization and 11,5% by public sector or government organization. 96,7% of respondents stated that their firm is exposed to international competition and their firms belong for the majority to one of the following sectors: Wholesale and Retail Trade, Educational, Financial and professional services.
In this context, the reliability of data might be not reasonably accurate a nd subject to inappropriate alteration, as the government data contains errors and biases, which is not unique to China, and has been a cause for concern among scholars. Accordingly, a study carried out by Koch-Weser (2013), concludes that China’s official statistics are not as reliable as those produced in the United States and Europe because there are serious deficiencies in the way the Chinese government gathers, measures, and presents its data. This is also common knowledge as the Chinese population is very concerned about the concept of “Saving face” or “面子” (mianzi) that refers to a sociological concept that links the ideas of honor, dignity, self -worth and prestige that a person feels when in social situations.
3.3. The analysis of Shenzhen’ competitiveness
a. Level A – Macro & Micro
Looking at the trajectories of the main indicators of national economic accounting, is clear that Shenzhen’s evolution pattern is very unique. Starting from an impressive grow of the population that shifted from 330.000 to 13.000.000 over forty years, we can notice positive trends in macroeconomic variables such as employment rate. Indeed, the number of employed persons increased by 6953,4% and the GDP trend over the years from 1979 to 2018 followed an exponential curve, increasing by 1233324% (Appendix: Figures 10 and 11). Figure 1 shows the correlation between the number of employed persons and the Gross Domestic Product Per Capita: as the R2 value is close to 1, we can state that the relationship between the variables is
positive, thus an increase in number of employed persons correlates with an increase in GDP per capita. Another useful economic indicator is the real estate appreciation over a time frame, Figure 2 illustrates the rise of house prices over 20 years in Shenzhen, increasing by 813% to 54090¥ per square meter in 2018.
Flavia Vardaro 24 Figure 1. Correlation between number of employed persons and GDP
Source: Shenzhen Statistics Bureau, 2018
Figure 2. Average Selling Price of Commercial houses in Shenzhen, 1998-2018
Source: Shenzhen Statistics Bureau, 2018
A corollary of the urbanization boom is the demand for a strong infrastructure system. This pushed officials to find creative solutions mainly in roads, ports and telco networks. Shenzhen, adjacent to Hong Kong, enjoys unique geographical advantages. It is a significant t ransportation hub in the Asia-Pacific region under the Belt and Road Initiative. The city also boasts of the international deep-water port, a large international airport, the largest land port, important
y = 168.65x - 17179 R² = 0.8897 ¥-50,000.00 ¥50,000.00 ¥100,000.00 ¥150,000.00 ¥200,000.00 0.00 200.00 400.00 600.00 800.00 1000.00 1200.00
Cor r e la t ion Be t we e n Numbe r of Employe d P e r s ons
and GDP per capit a
¥0 ¥10,000 ¥20,000 ¥30,000 ¥40,000 ¥50,000 ¥60,000 Pri ce (y u an / sq.m ) Year
Average Selling Price of Commercial Houses in Secondary
Market, 1998 - 2018
Flavia Vardaro 25 expressways, national railways and passenger lines. Shenzhen ranks top in terms of the subway comprehensiveness by China Urban Cities’ Transit-Oriented Development Index Report and ranks Fourth in the World Container Port with its large throughput in 2018. The favorable geographical position and the positive trend of economic indicators enabled the city to become a strategic player for the changing relationship between China and the rest of the world, helping to create engagement with foreign investors and global integration.
If we look at the market characteristics and the transformation of the industry, we can notice China's transition from a planned economy to a more market-based economy. Figure 3 graphically illustrates the changing composition of key industries in Shenzhen from 1979 to 2018.
Figure 3. The Changing composition of key industries in Shenzhen, 1979 - 2018
Source: Shenzhen Statistics Bureau, 2018
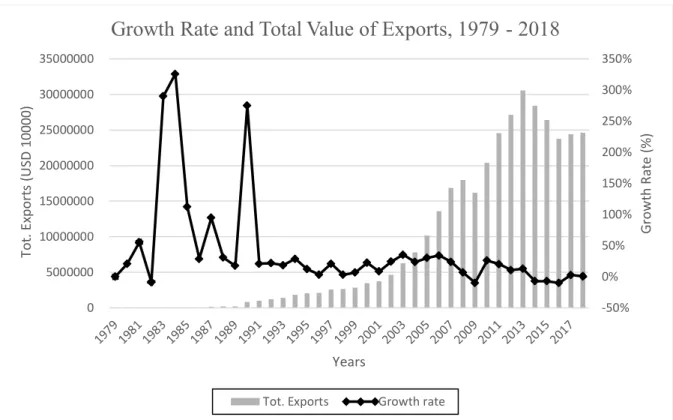
In 2019, the primary sector accounted only for 0.1% g the GDP with an added value of RMB 2.21 billion, the secondary industry explained 41.2% of the GDP with an added value of RMB 996.19 billion and the tertiary market accounted for 58.7% of the GDP with an added value of RMB 1,423.79 billion. Key industries today in Shenzhen are high-tech, finance, logistics and culture related. Shenzhen’s key industries are crucial for attracting Foreign Direct Investment (FDI) and supporting foreign trade. The changing economic structure has developed an export-oriented economy and Shenzhen in 2019 became the No.1 export city for 26 consecutive years with a total foreign trade import and export value of USD447.8 billion (RMB 3 trillion). The Growth rate of Exports in 2018 increased by 10% from 2016 and the Total Value of Exports was USD246 billion in 2018 (Figure 4). On the other hand, also total imports followed a
1979 Primary Industry Secondary Industry Tertiary Industry 1989 1999 2009 2018
Flavia Vardaro 26 positive trend with a minor magnitude increasing from USD7.4 million in 1979 to USD207 billion in 2018 (Figure 5).
Figure 4. Growth rate and total value of exports, 1979 - 2018
Source: Shenzhen Statistics Bureau, 2018
Figure 5. Total Exports and Imports, 1979 - 2017
Source: Shenzhen Statistics Bureau, 2018
-50% 0% 50% 100% 150% 200% 250% 300% 350% 0 5000000 10000000 15000000 20000000 25000000 30000000 35000000 G row th R at e (% ) Tot . E xport s ( U SD 1 00 00 ) Years
Growth Rate and Total Value of Exports, 1979 - 2018
Tot. Exports Growth rate
0 5000000 10000000 15000000 20000000 25000000 30000000 35000000 19791981198319851987198919911993199519971999200120032005200720092011201320152017
Total Exports and Imports, 1979 - 2017
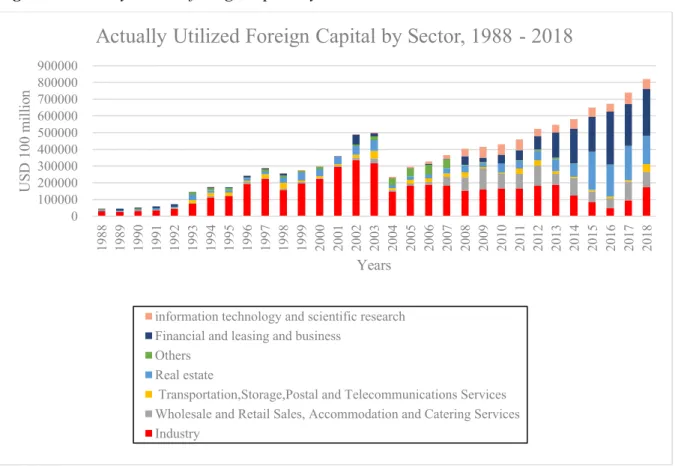
Flavia Vardaro 27 FDI has made a tremendous contribution to Shenzhen’s industrialization, the increasing inflows of capital reached the value USD161 billion in 2018, with the amount of FDI actually utilized of USD8 billion (Table 2). In recent years, most foreign capital has gone to the service industry, Figure 6 shows the distribution of foreign capital grouped by sector over the last 30 years (1988 – 2018).
Table 2. Foreign direct capital actually utilized and growth rate
Source: Shenzhen Statistics Bureau, 2018
Figure 6. Actually utilized foreign capital by sector, 1998 - 2018
Source: Shenzhen Statistics Bureau, 2018
0 100000 200000 300000 400000 500000 600000 700000 800000 900000 1988 1989 1990 1991 1992 1993 1994 1995 1996 1997 1998 1999 2000 2001 2002 2003 2004 2005 2006 2007 2008 2009 2010 2011 2012 2013 2014 2015 2016 2017 2018 U S D 100 mi ll io n Years
Actually Utilized Foreign Capital by Sector, 1988 - 2018
information technology and scientific research Financial and leasing and business
Others Real estate
Transportation,Storage,Postal and Telecommunications Services Wholesale and Retail Sales, Accommodation and Catering Services Industry
Year 1979 1989 1999 2009 2018
Amount of direct foreign capital actually
utilized (USD100 million) 548 29252 177839 416001 820301
Flavia Vardaro 28 Other important economic indicators to take into consideration analyzing the state of the economy of the city are the Total Investments in Fixed Assets that reached RMB 514.7 billion in 2019 and Total retail sales of consumer goods that valued RMB 601.6 billion in 2019.
b. Level B – SIPI and MFP
The literature shows that the Chinese growth model may be characterized by an in extricable relationship between the market and institutions, particularly the public sector. Shenzhen’s government adopted a flexible approach to boost the economy and promote competition; this methodology proved to be a valuable strategy for achieving growth. Shenzhen has been the very first Chinese Special Economic Zone created during the early period of modern China’s economic reforms and has been serving as China’s “window to the world” and “an experimentation field” ever since the nation’s opening up. The city development went through several stages, all of them characterized by a comprehensive series of institutional reforms and fiscal incentives. Shenzhen has assumed an exemplary role in driving China's progressive changes and urban remaking, which incorporate land, labor, financial, price and enterprise reforms. During the initial breakthrough stage, the municipal government promoted competition in design and construction for infrastructure, introducing a bidding system that changed permanently the old administrative allocation model (Zeng, 2010).
Furthermore, with the price system reform in 1980, the city began to relax price controls on capital goods to ease constraints on pricing and fees on commodities in order to set up a mechanism in which commodity prices would have been imposed by the law of the supply and the demand. Other important reforms have been carried out by the Shenzhen government for the labor market, introducing procedures to determine employees’ wages and pension insurance. Shenzhen was the first city in China to allow foreign financial institutions and to privatize the financial system with two models for privatization; also, in 1990 the Shenzhen Stock Exchange and the first foreign exchange transaction center was established to encourage foreign capital inflows. The same year, with the reform of state-owned enterprises, Shenzhen allowed domestic and foreign investors to invest in former state-owned enterprises. Between 1986 and 1991, Shenzhen reformed the administrative management system, si mplifying it in three layers: comprehensive, administrative and asset management. During the same period, the government encouraged hi-tech entrepreneurship to invest in private enterprises by introducing incentives and promoting innovation in production. After 1997, the government
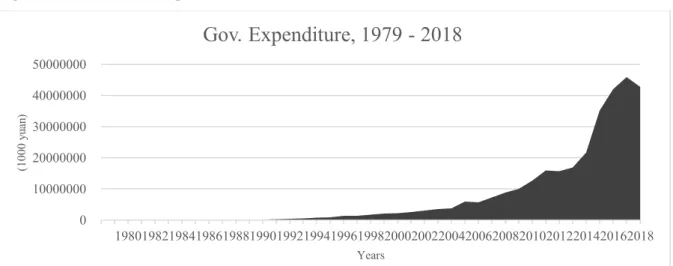
Flavia Vardaro 29 increased the efficiency and role of the market in resource allocation, simplifying administrative procedures and increasing transparency to prevent corruption. Flexible reforms were implemented thanks to the special authority given to local officials by the central government. This allowed the opening up and dramatic growth of the city. Indeed, the central government not only pushed for system innovation, but it granted full recognition to innovative policies and adopted them on a national scale. Figure 7 illustrates government expenditure over 39 years by sector, fiscal stimulus for improvement of infrastructure, social institutions (Table 3 and 4) and industrialization through hi-tech industrial parks (Shenzhen Government Online, 2019).
Figure 7. Government expenditure, 1979 - 2018
Source: Shenzhen Statistics Bureau, 2018
Table 3. Data on Education Intuitions
Year 1979 1989 1999 2009 2018
Education Insitutions (unit) 340 520 970 1626 2533
Students Enrolled (person) 65375 198549 466595 1222243 2142917 Source: Shenzhen Statistics Bureau, 2018
Table 4. Data on Health Care Institutions
Year 1979 1989 1999 2009 2018
Health Care Institutions (unit) 62 332 687 1963 3806
Medical Personnel (person) 1214 7923 18841 67028 114882
Source: Shenzhen Statistics Bureau, 2018
0 10000000 20000000 30000000 40000000 50000000 19801982198419861988199019921994199619982000200220042006200820102012201420162018 (1000 y u an ) Years
Gov. Expenditure, 1979 - 2018
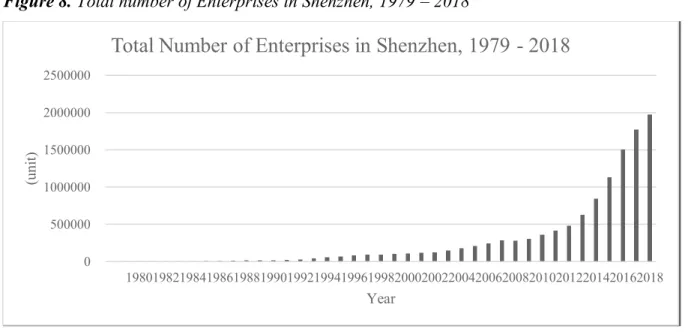
Flavia Vardaro 30 The business environment is particularly attractive for investors as the Shenzhen SEZ enjoys tax exemptions, grant/loans, and reduced tax rates (Appendix: Table 5). Shenzhen’s proactive government has simplified the process for establishing companies, shor tening the time to register a company from 20 working days to just one (Upton, 2019). Also, the city is the headquarters of seven Fortune Global 500 companies, namely: Ping An, Huawei, China Merchants Bank, Amer, Vanke, Tencent and Evergrand. The total volume of 3.05 million commercial entities in Shenzhen ranks it 1st in China in terms of the volume and density (Figure 8), SMEs are promising to be the main source of innovation and their success is crucial for the country’s long-term growth.
Figure 8. Total number of Enterprises in Shenzhen, 1979 – 2018
Source: Shenzhen Statistics Bureau, 2018
c. Level C – Innovation
Drawing upon the literature, competition in the current context of globalization is increasingly innovation-based. Accordingly, Shenzhen is not only home for entrepreneurs (Figure 8) but also is a city conducive for startups and innovators. The city is the first Chinese international technology and industrial innovation center, with leading industries in Financial Technology, Electronic Information, High-end equipment manufacturing, Green and low-carbon and Biology (Shenzhen Government Online, 2019). Many of tech giants such as Huawei and Tencent established their headquarter in the ‘Silicon Valley’ of China, benefiting from the sparkling and stimulating environment, loose regulations and a pool of young and international
0 500000 1000000 1500000 2000000 2500000 19801982198419861988199019921994199619982000200220042006200820102012201420162018 (uni t) Year
Flavia Vardaro 31 talent. Due to the nature of the city, the average age of the population is 29 years. This facilitated ICT adoption and shifted consumer preferences towards an ever-greater green-smart city. The city also continuously leads in improvements of New Generation Technology such as: Integrated Circuits3, Artificial Intelligence, 5G Technology of mobile communication, IoT4 and
ICV5. Proxies for understanding the level of innovation can be the number of filed patents and
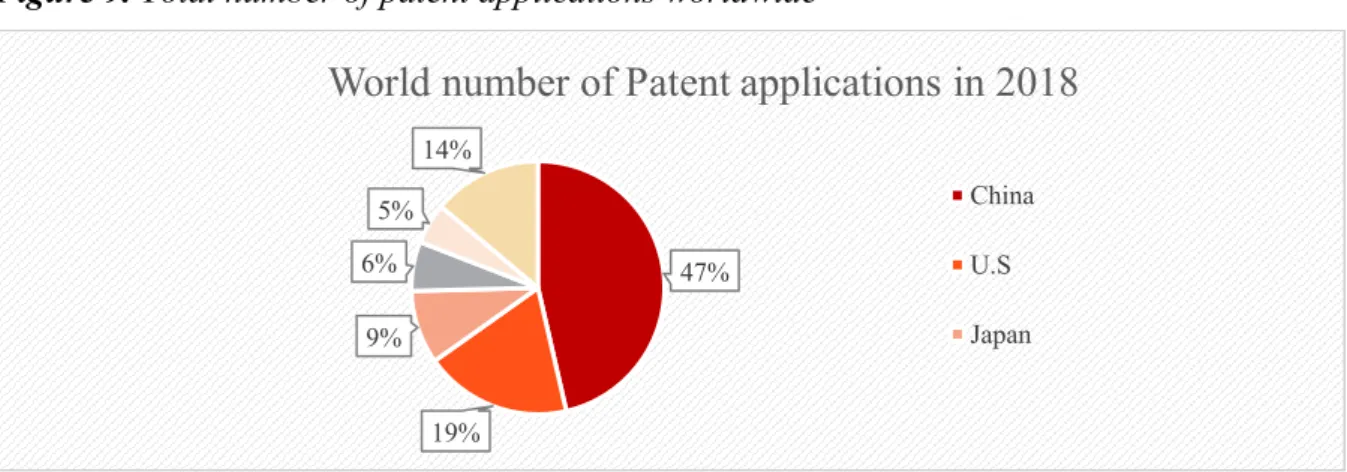
R&D investments. In 2018, China filed 46,40% of the 3,326,300 world's total p atent applications (Figure 9), with Shenzhen increasing the number of applications by 29,1% from 2017 to 228608 in 2018 (Figure 10). R&D investments, financing of enterprises self -raised funds and government appropriations reached ¥116 billion in 2018 (Figure 11).
Figure 9. Total number of patent applications worldwide
Source: WIPO Statistics Database, March 2020
Figure 10. Number of Patent applications in Shenzhen, 1991 - 2018
Source: Shenzhen Statistics Bureau, 2018
3 Industrial ecosystem with synergies to support the upgrading of new generation information technology industry
4 Internet of Things
5 Intelligent connected vehicle
47% 19% 9% 6% 5% 14%
World number of Patent applications in 2018
China U.S Japan 0 50000 100000 150000 200000 250000 300000 350000 1991 1992 1993 1994 1995 1996 1997 1998 1999 2000 2001 2002 2003 2004 2005 2006 2007 2008 2009 2010 2011 2012 2013 2014 2015 2016 2017 2018 (uni t) Years
Flavia Vardaro 32 Figure 11. Expenditure on R&D in Shenzhen, 2009 - 2018
Source: Shenzhen Statistics Bureau, 2018
Shenzhen’s leading position in terms of exports (Figure 5), is mainly due to the fact that the city is the world's hub for electronics manufacturing. For instance, Shenzhen is the first and largest hardware accelerator and manufacturing hub, attracting enormous amoun ts of freelance mechanical and electrical engineers. Another industry of interest for entrepreneurs and the local government is green and low-carbon ventures; trends towards energy conservation, environmental protection and the use of hydrogen fuel cell, helped the city to rank top in terms of air quality in China. In addition, its levels of energy and water consumption are the lowest among cities in the country, improving the entire industrial supply chain and continuously developing the hydrogen-based economy (UN-Habitat, 2019). Shenzhen’s position as an innovative and technological center helps businesses to flourish and remain competitive. The local administration optimizes, supervises and evaluates the city’s public infrastructure, security, financial and health systems. For instance, security is managed with the 159.09 cameras per 1,000 people in the urban areas.
3.4. Survey results
The survey, distributed in the form of a questionnaire, was divided into two main sections: the first to test the competitiveness in Shenzhen, and the second part to gain insights regarding competitiveness more in general in China (Appendix; Table 6).
0 2000000 4000000 6000000 8000000 10000000 12000000 14000000 2009 2010 2011 2012 2013 2014 2015 2016 2017 2018 (10000 y u an ) Years
Flavia Vardaro 33
a. First section – Shenzhen
Respondents were asked to rate Shenzhen compared to other super cities like Shanghai, Guangzhou, Suzhou, Beijing using 18 different indicators of the city's business environment that affect how well firms in Shenzhen can compete in the global marketplace. From the results, the city emerged as performing very well in almost all parameters relative to the peer group
(Appendix; Table 6). Highlights of the data including positive ratings for Logistics (97,7%) and
Communication (93,2%) infrastructures, confirming the positive trend of the economic variables analyzed. Furthermore, Shenzhen proved again to be a positive environment for entrepreneurs with respondents highly rating availability of capital for good quality ideas, ease of setting up new businesses, quality of suppliers, service providers, supporting institutions and availability of skilled labor all above average (Appendix; Table 6). In terms of innovation, 95,5% of respondents valued the excellent innovation infrastructure and 72,7% rated above average the protection of physical and intellectual property rights. Furthermore, a positive evaluation was assigned also to the education system, including access to high‐quality education, good curricula that prepare students for productive and first-class universities. On the other hand, the quality of healthcare system and relative costs associated was rated in line with other first-tier cities, the efficiency of the legal framework and the complexity of the local tax code received ratings from a very small portion of respondents, with 36,4% of participants choosing the ‘Don’t know’ option and 79,5% rating these variables about average. In general, compared to other first tier cities, participants stated that Shenzhen’s business environment overall is 32% somewhat better than average and 59% much better than average. Overall, the data shows that the competitiveness of enterprises, based in Shenzhen, over the years has improved (93,2%).
b. Second section – China
Respondents were also asked to rate the Chinese business environment using the same set of 18 indicators, but this time comparing China to the world’s other largest economies (Appendix;
Table 6). Results are mostly consistent with the trends that emerged from the analysis of
Shenzhen, However, the magnitude of each indicator tended to be smaller. For example, positive ratings for logistics and communication infrastructure for China were respectively, 93% and 83,7% compared to 97,7% and 93,2% that resulted for Shenzhen. Context for entrepreneurship, strength of clusters and innovation infrastructure were evaluated above
Flavia Vardaro 34 average, respectively with 86%, 83,7% and 81,4% positive ratings. Also, the availability for skilled labor produced an outcome somewhat better than average, with just 6 7,4% of positive ratings. Social infrastructure such as the education system, including the quality of universities were judged about average with all indicators yielding roughly 54,7% of positive and 45,3% negative responses, while the quality of health care has been rated somewhat worse than average (72%). With regard to the efficiency of the legal framework (62,8%), the effectiveness of regulations (44,2%) and the complexity of the national tax code (48,8%), participants rated all of aforementioned indicators about/worse than average, with a small proportion of respondents choosing the ‘Don’t know’ option. To conclude, participants overall think that the competitiveness of enterprises based in China is improving (93%) and that the business environment is keeping pace with the others advanced economies (50%) yet pulling ahead of emerging ones (71,7%).
Flavia Vardaro 35
4.
Conclusion
The foregoing analysis aims to answer the research questions formulated in the introduction. We examined the dynamics that shaped the meteoric economic growth of China through the specific lens of a key city – Shenzhen – and we concluded that the major causal factors have been reforms opening up of the economy, government incentives, competitive dynamism, and ad hoc policies. Central and local government interaction, characterized by adaptive efficiency, has led cities, clusters and, in turn, the entire country towards an era of flourishing and has created a more market-based economy. But the state remains, nevertheless, an activist player in economic activity. GDP growth is a reasonable proxy for representing the country’s overall economic advancement (Appendix; Figure 12). Also, data on imports and exports shows the evolving relationship with foreign countries and global supply chains. Indeed, relaxed legislation, strategic incentives, technological innovation, and infrastructure creation stimulated inbound FDI and foreign entrepreneurs to invest and establish new SMEs in China.
The best outcome of efficiency-enhancing reforms and competitive dynamics can be seen throughout the patterns of growth of the so-called ‘megacities’ of China. We looked at Shenzhen and its evolution over 40 years, as an illustrative explanatory phenomenon whereby relevant factors concerning China’s growth could be examined. Shenzhen’s population climbed from just 30,000 in the 1970s to over 12 million in 2019, the city is home for the first Special Economic Zone and today Shenzhen, together with the other cities of the Guangdong province, is the biggest contributor to Chinese GDP, with almost CN¥9 trillion (US$1.3 trillion) in contributions (2017) (Statista, 2019).
But all that glitters is not gold; although China is implementing an economic miracle, nowadays it is facing major economic headwinds. Some negative aspects of the Chinese business environment, such as lack of transparency, an opaque legal system, the complexity of the national tax code, and the quality of social infrastructure, emerged as noteworthy constraints from the survey responses. In particular, several articles reproach China for promulgating suspicious and inaccurate data pertaining to various economic indicators such as GDP growth, company fundamentals, the level of NPLs in the banking sector and on infrastructure efficiency. For example, a report by the University of Oxford’s Saïd Business School suggests that the Chinese construction system led to colossal waste producing cost overruns equal to one-third