Hugo Manuel Ramos Moreira
Master of Science in Biomedical Engineering
Investigating the mechanisms of α-particle
therapy in prostate cancer
Thesis submitted in partial fulfilment of the requirements for the degree of
Doctor of Philosophy in
Radiation Biology and Biophysics
Supervisor: Professor Kevin Michael Prise, Full Professor School of Medicine, Dentistry and Biomedical Sciences, Queen’s University Belfast
Co-supervisors: Dr. Stephen Joseph McMahon, Lecturer School of Medicine, Dentistry and Biomedical Sciences, Queen’s University Belfast
Professor Maria Alice Santos Pereira, Assistant Professor
NOVA School of Sciences and Technology
Examination Committee
Chairperson: Professor Paulo Manuel Assis Loureiro Limão Vieira
Rapporteurs: Professor Giuseppe Schettino
Professor Mark Hill
Members: Professor Kevin Michael Prise
Professor Pedro António de Brito Tavares March 2020
Investigating the mechanisms of α-particle therapy in prostate cancer
Copyright © Hugo Manuel Ramos Moreira, Faculdade de Ciências e Tecnologia, Universidade NOVA de Lisboa.
A Faculdade de Ciências e Tecnologia e a Universidade NOVA de Lisboa têm o direito, perpétuo e sem limites geográficos, de arquivar e publicar esta dissertação através de exemplares impressos reproduzidos em papel ou de forma digital, ou por qualquer outro meio conhecido ou que venha a ser inventado, e de a divulgar através de repositórios científicos e de admitir a sua cópia e distribuição com objetivos educacionais ou de investigação, não comerciais, desde que seja dado crédito ao autor e editor.
v
A
CKNOWLEDGMENTS
I want to start by thanking my supervisors Kevin Prise and Stephen McMahon for the opportunity given to me, for all their vast experience shared with me and for the countless discussions we had about this work. Every conversation was incredibly valuable and allowed me to grow and succeed after failing. I also want to thank my colleagues from our research group at CCRCB, both students, post-docs and technicians. To the Cancer Centre staff, Cyril, Conor and Ray, for their help in building the α-source holder and collimators used in our research work.
To the Portuguese National Funding Agerncy FCT-MCTES for the scholarship they provided me (SFRH/BD/52534/2014). This work was also supported by Radiation Biology and Biophysics Doctoral Training Programme (RaBBiT, PD/00193/2012), UIDB/00068/2020 (CEFITEC) and UIDB/04378/2020) (UCIBIO).
I want to especially thank my group of friends who I met in Belfast. Fiammetta, Alessandro, Jordan, Soraia, Matt, Federica, Tommaso, Carla and Francisco. They made my life, as a stressed PhD foreigner student, easier.
To the improv community, I thank them for keeping me sane and joyful after many stressed days at the lab.
To Natalie, she supported me through light and dark days throughout my thesis. She always believed I could make it. I can’t thank her enough.
From this point on I’ll continue my acknowledgements in Portuguese. This is for my friends and family from Portugal, it would not sound as real and truthful as if I did it in English:
Aos meus amigos de longa data do grupo “Coubes”. Fazem-me sentir perto mesmo não estando. De cada vez que volto, nunca sinto que estive longe. São a minha casa.
Finalmente, aos meus pais. O agradecimento mais importante é para eles. Sempre me apoiaram nas minhas escolhas, muitas vezes com consequências difíceis. A minha viagem para Belfast foi uma delas. Não é fácil estar longe deles. Mas fazem de tudo para que sinta que estão presentes. E estão. Esta tese é dedicada a eles.
vii
A
BSTRACT
The use of α-particle radionuclide emitters in the treatment of bone metastasis has been an active area of research within targeted radionuclide therapies. From a radiobiological perspective, α-particles are known to be more effective at killing cells in comparison to low linear energy transfer (LET) radiation particles, such as X-rays, with increased relative biological effectiveness of around a factor of 3 in most models. α-particle irradiated cells also show a reduced dependency on radioresistance mechanisms observed in the absence of oxygen, with an oxygen enhancement ratio (OER) close to 1.0. Such advantageous radiobiological properties of α-particles demonstrate their potential for radiotherapy treatments.
In recent years, the bone targeting high LET radionuclide Radium-223 (223Ra) has been shown to
not only have a palliative effect but also a survival prolonging effect in castration resistant prostate cancer patients with bone metastases. This has encouraged the use of 233Ra in more extensive clinical
trials. Despite the clinical utility of 233Ra, little is known regarding the radionuclide’s mechanisms of
action in this treatment setting, where accurate assessments of the dosimetry underpinning its effectiveness are lacking. There is a pressing need to model and quantify α-emitter effects in pre-clinical models so the next generation of trials utilising 223Ra can be optimally designed.
The research work presented in this thesis focused on studying the dosimetry involved in α-particle irradiation systems for in vitro and clinical settings, using computational simulation methods. We have also studied the α-particle irradiation effects on cell survival, DNA damage and tumour control, focusing specifically on 223Ra treatment scenarios.
ix
R
ESUMO
O uso de radionuclídeos emissores de partículas α para tratamentos de metástases ósseas tem sido uma das áreas de investigação científica mais ativamente exploradas no que toca a tratamentos com radionuclídeos. Numa perspetiva radiobiológica, sabe-se que as partículas α são mais eficientes na indução de morte celular em comparação com partículas radioativas de baixa transferência linear de energia (LET), como os raios-X, sendo que as partículas α têm também uma maior eficiência biológica relativa (RBE), cerca de 3 vezes mais. As células que são irradiadas com partículas α demonstram também uma redução na dependência de mecanismos de radiorresistência observados na ausência de oxigénio, apresentado valores de relação de enriquecimento em oxigénio (OER) perto de 1.0. Estas propriedades radiobiológicas demonstram o potencial das partículas α para tratamentos de radioterapia. Nos últimos anos, o radionuclídeo Rádio-223 (223Ra), tendo maior absorção no tecido ósseo, não
só tem demonstrado um efeito paliativo positivo como também um efeito de maior longevidade em doentes com cancro da próstata resistente a castração e com metástases ósseas. Isso estimulou o uso do
223Ra em ensaios clínicos avançados. Apesar da utilidade clínica do 223Ra, pouco se sabe sobre os seus
mecanismos de ação, principalmente na dosimetria e no seu efeito para a eficácia de tratamentos. Existe assim uma necessidade premente em quantificar os efeitos de radionuclídeos emissores de partículas α em ensaios pre-clínicos, de forma a que se possa otimizar a próxima geração de tratamentos com 223Ra.
O trabalho de investigação apresentado nesta tese foca-se no estudo da dosimetria envolvida em sistemas de irradiação com partículas α em modelos in vitro e clínicos, usando métodos de simulação computacional. Neste trabalho, também se estudou os efeitos de partículas α na sobrevivência celular, deterioração de DNA e controlo de crescimento tumoral, com particular foco em cenários de tratamento com 223Ra.
Palavras-chave: partículas α; Radio-223; cancro da próstata; metástases; controlo tumoral;
xi
C
ONTENTS
LIST OF FIGURES ... XV LIST OF TABLES ... XXI NOMENCLATURE ... XXIII
CHAPTER 1 : INTRODUCTION ... 1
1.1CANCER ... 1
1.1.1 Prostate cancer ... 2
1.2RADIOTHERAPY ... 4
1.2.1 External beam radiotherapy ... 5
1.2.2 Targeted radionuclide therapy ... 6
1.3PHYSICS OF IONIZING RADIATION IN RADIOTHERAPY ... 9
1.3.1 X-rays and gamma radiation ... 9
1.3.2 Charged particles ... 10
1.3.3 Radionuclides: Physical and biological half-lives ... 14
1.4RADIOBIOLOGY ... 15
1.4.1 Absorbed dose ... 15
1.4.2 Linear quadratic model ... 16
1.4.3 Relative biological effectiveness ... 16
1.4.4 Oxygen enhancement ratio ... 18
1.4.5 DNA damage and repair ... 19
1.4.6 Bystander effects ... 20
1.5MICRODOSIMETRY ... 21
1.6MONTE CARLO SIMULATION ... 22
1.6.1 Monte Carlo ... 22
1.6.2 Geant4 and TOPAS ... 23
1.7PROJECT OBJECTIVES ... 24
CHAPTER 2 : 𝛂-SOURCE VALIDATION AND OPTIMIZATION ... 27
xii
2.2MATERIALS AND METHODS ... 28
2.2.1 The 241Am source setup ... 28
2.2.2 Experimental analysis... 30
2.2.3 Monte Carlo simulation of the 241Am source setup ... 37
2.2.4 Monte Carlo simulation of cell dosimetry using the 241Am source setup ... 41
2.3RESULTS ... 45
2.3.1 Experimental data ... 45
2.3.2 Experimental and simulated data comparison ... 50
2.3.3 Monte Carlo simulation of α-particle interactions with a cell target ... 53
2.4DISCUSSION ... 59
CHAPTER 3 : DEVELOPMENT OF A NOVEL COLLIMATOR FOR 𝛂 -SOURCES ... 65
3.1INTRODUCTION ... 65
3.1.1 Influence of collimator’s geometry on particle flux ... 65
3.2MATERIALS AND METHODS ... 68
3.2.1 3D printed collimator ... 68
3.2.2 Experimental analysis... 69
3.2.3 Monte-Carlo simulation of the 241Am source with a collimator ... 73
3.2.4 In vitro experimental validation ... 76
3.3RESULTS ... 76
3.3.1 Experimental data ... 76
3.3.2 Experimental and simulation data comparison of a collimated α-source ... 80
3.3.3 Monte Carlo simulation of α-particle interactions with a cell target when using a collimator ... 82
3.3.4 Dose rate ... 87
3.4DISCUSSION ... 88
CHAPTER 4 : IN VITRO ASSAYS ... 93
4.1INTRODUCTION ... 93
4.2MATERIALS AND METHODS ... 93
4.2.1 Cell culture ... 93
4.2.2 In vitro cell assays ... 96
4.2.3 External source cell irradiations ... 99
4.2.4 223Ra cell irradiations ... 100
xiii
4.3.1 α-source validation through clonogenic survival assays ... 106
4.3.2 α-particle effects on cells ... 108
4.3.3 223Ra effect on cells ... 111
4.4DISCUSSION ... 118
CHAPTER 5 : MECHANISTIC MODELLING OF RADIUM-223 TREATMENT OF BONE METASTASES ... 123
5.1INTRODUCTION ... 123
5.2MATERIALS AND METHODS ... 124
5.2.1 Tumour growth ... 124
5.2.2 Modelling the effect of 223Ra on tumour growth ... 127
5.2.3 Clinical trial data ... 130
5.2.4 Sensitivity analysis to the tumour growth model parameters ... 131
5.3RESULTS ... 132
5.3.1 Modelling the radiation effect on the tumour growth ... 132
5.3.2 Sensitivity analysis of tumour growth model parameters ... 134
5.4DISCUSSION ... 141
CHAPTER 6 : CONCLUSION ... 145
xv
L
IST OF FIGURES
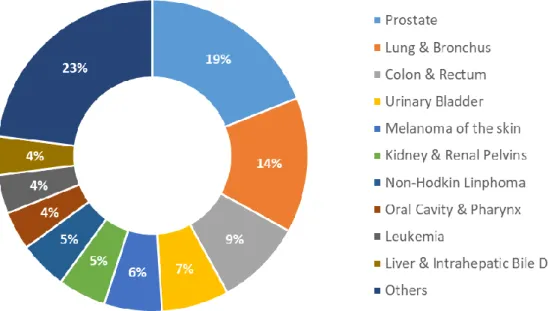
Figure 1.1 - Estimated incidence of the ten leading male cancer types in USA, 2018... 2
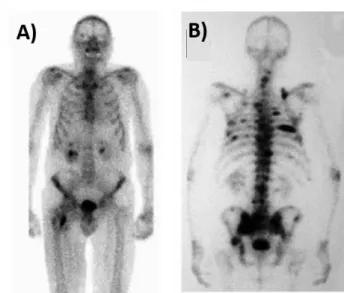
Figure 1.2 – Scintigraphy images using 99Tc from two patients with multiple bone metastasis.. ... 4
Figure 1.3 – Schematic representation of α and β- emissions from a radionuclide X with atomic mass A and atomic number Z.. ... 6
Figure 1.4 – Schematic representation of the track length of α-particles (a) and β-particles (b) while going through cells and their nuclei.. ... 7
Figure 1.5 - Schematic representation of the 223Ra decay chain.. ... 8
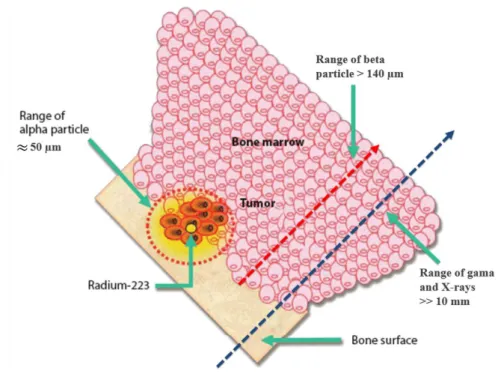
Figure 1.6 – Bone-targeted localized mechanisms of action of the α-emitter isotope 223Ra comparing treatment area ranges to other ionising radiation. ... 10
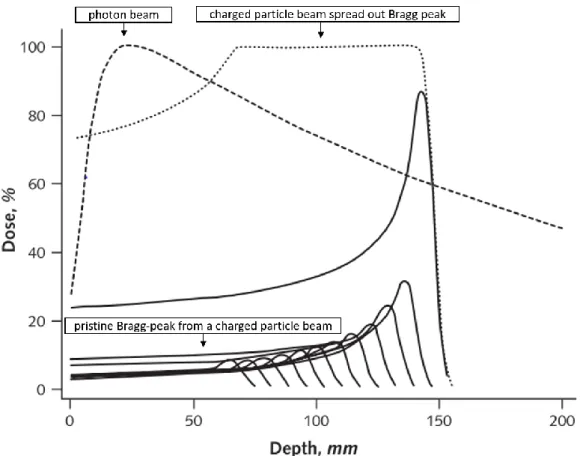
Figure 1.7 – Dose distributions of a photon beam and charged particle beams. ... 11
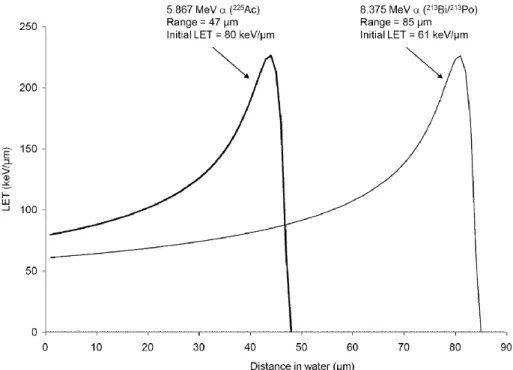
Figure 1.8 – LET variation with distance travelled in water of α-particles with 2 different initial kinetic energies. ... 13
Figure 1.9 – Example of the calculation of the relative biological effectiveness for a cell survival fraction of 10% between deposited doses of a radiation particle and X-rays.. ... 17
Figure 1.10 – Oxygen enhancement ratio variation with LET.. ... 18
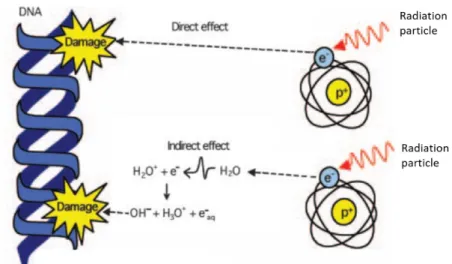
Figure 1.11 – Schematic representation of the effect of radiation particles to DNA. ... 20
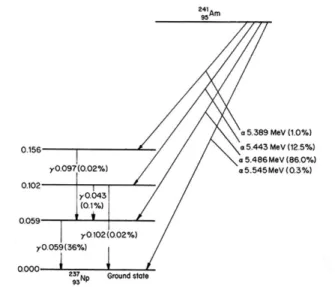
Figure 2.1 – Decay scheme of 241Am.. ... 29
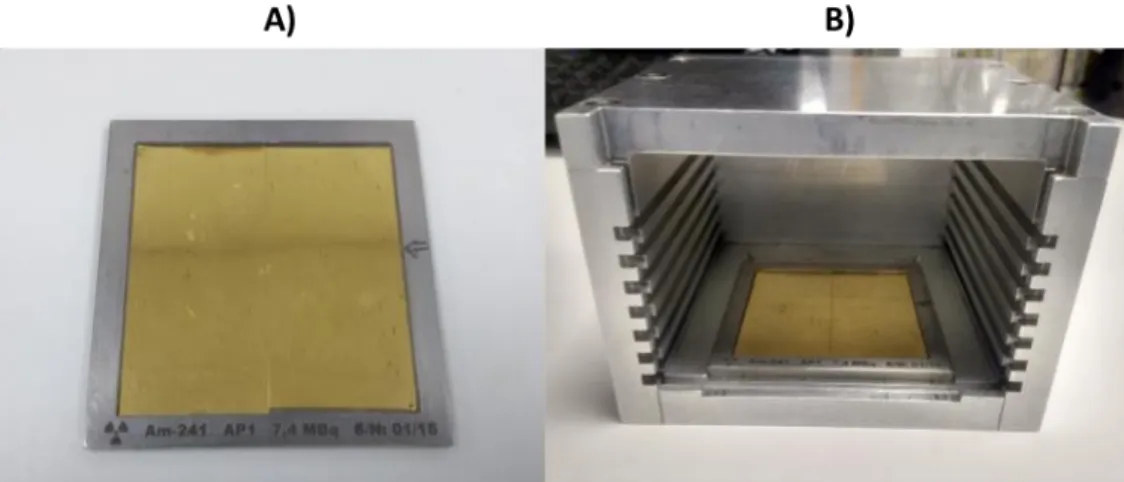
Figure 2.2 – A) α-source used for experimental tests, composed of two 241Am layers glued together. The two layers are sitting on top of a holder, with metallic edges surrounding them. B) Source holder box used to vary the distance between the target and the source. ... 30
Figure 2.3 - A) Mylar dish components (left side) and final assembled dish (right side). B) Source holder box with a Mylar dish positioned at the 4th step from the α-source. ... 30
Figure 2.4 – Representation of the relation between radiochromic film optical density and radiation dose. ... 31
xvi
Figure 2.6 – Representation of the NOD pixel averaging process to build the film horizontal NOD
profile. ... 33
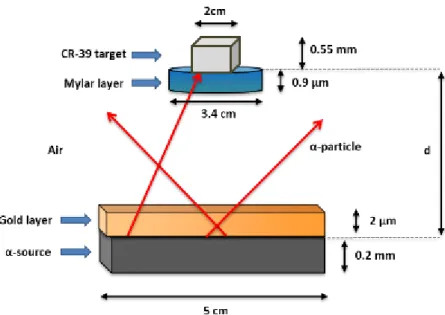
Figure 2.7 - Schematic representation of the materials present between the α-source and a target, where d represents the distance between the target and the source... 34
Figure 2.8 – Schematic representation of two α-particles, travelling the same distance but with different emission angle θ, reaching different target distances. ... 34
Figure 2.9 - Schematic representation of the materials present between the α-source and semiconductor detector, where d represents the distance between the detector and the source. ... 36
Figure 2.10 - Schematic representation of the simulation setup of all the materials present between the α-source and a target. ... 38
Figure 2.11 – Schematic representation of the simulated cell target with an inner nucleus layer. ... 42
Figure 2.12 - Example of an energy spectrum peak and the definition of the FWHM. ... 43
Figure 2.13 - EBT3 customized film scans after exposed to the α-source. ... 45
Figure 2.14 - EBT3 customized film areas showing calculated net optical densities (NOD) after exposure to the α-source. ... 46
Figure 2.15 - Average net optical density profiles of middle vertical and horizontal lines of EBT3 customized films after exposed to the α-source.. ... 47
Figure 2.16 - Microscope images of CR-39 samples exposed to the α-source for one minute at different distances from source to target (d). ... 49
Figure 2.17 - Particle flux from the α-source at different distances from source to target. ... 49
Figure 2.18 - Absolute particle flux from the α-source for experimental (n=9) and simulation data, at different distances from source to target. ... 50
Figure 2.19 – Experimental and simulated energy spectra of α-particles hitting a target placed at different distances d from the α-source. ... 52
Figure 2.20 - Simulated average energy of α-particles reaching the cell target at different distances from the source, with an initial α-particle energy of 5.48 MeV. ... 53
Figure 2.21 - Simulated energy spectra of the α-source at a cell target positioned at different distances from the source.. ... 54
Figure 2.22 - Simulated distribution relating particle energy and angle with surface of the target layer (θS) positioned at different distances from the source.. ... 55
xvii
Figure 2.23 - Probability density distributions of the α-particles energy scored at 3 different material surfaces. ... 56 Figure 2.24 - Simulated distribution relating particle energy and angle with surface of the cell target (θS)
positioned 14.9 mm away from the source. ... 57 Figure 2.25 - Simulated average α-particle energy deposition per particle in the first micrometre layer of a cell target (A) and LET profile of the α-particles irradiated from the source at different targets, based on the simulated particle energies and data from the NIST database (B).. ... 58 Figure 2.26 - Experimental and simulation calculations of the surface dose rate of the α-source at different cell target distances from the source. ... 59 Figure 2.27 - Average net optical density profiles of middle vertical and horizontal lines of EBT3 customized films after exposed to the α-source.
Figure 2.28 – Linear energy transfer (LET) of alpha particles in water, with particle energies varying from 0.1 MeV and 10 MeV. ... 63 Figure 3.1 – Representation of an α-particle with an emission angle θ entering a hexagon hole in two collimator examples, varying only in hole diameter (D1 < D2). ... 66 Figure 3.2 – Schematic representation of a cross-section from the collimator’s honeycomb pattern structure.. ... 66 Figure 3.3 - Representation of an α-particle with an emission angle θ going through a hexagon hole in two collimator examples, varying only in thickness ... 67 Figure 3.4 - Representation of α-particles going through two collimators varying only in septa (S1 > S2).. ... 67 Figure 3.5 – Default infill options from the 3D printing software Simplify 3D. ... 69 Figure 3.6 – Microscope images taken of 3 hole areas from each collimator sample.. ... 70 Figure 3.7 – Schematic representation of the experimental setup of a Gafchromic film sample placed on top of a collimator and exposed to the α-source... 70 Figure 3.8 – EBT3 customized film sample irradiation pattern after being placed on top of collimator sample C50 and exposed to the α-source for 30 minutes. ... 71 Figure 3.9 - Schematic representation of the relation between the collimator’s geometry parameters with the distance between 5 consecutive vertical holes (ny=5) or 9 consecutive diagonal holes (nxy = 9). ... 72
Figure 3.10 - Representation of the collimator hole long diameter (Dlong) and its relation to the shorter
xviii
Figure 3.11 – Simulated geometry of the C50 collimator used in Monte-Carlo simulations in TOPAS. Each side has 4.9 cm width. ... 74 Figure 3.12 - Schematic representation of the simulation setup of the collimated α-source. ... 75 Figure 3.13 - EBT3 customized film areas showing their calculated net optical densities (NOD) normalized to the irradiation time (IRtime) after exposure to the α-source. ... 78
Figure 3.14 - Average net optical density profiles of middle horizontal (A) and vertical (B) lines of EBT3 customized films after exposure to the α-source with without a collimator.. ... 79 Figure 3.15 - Particle flux from the α-source with and without collimator C50 at different distances from source to target. ... 80 Figure 3.16 - Experimental and simulated particle flux from the α-source with and without the collimator C50 at different distances from source to target. ... 81 Figure 3.17 - Experimental and simulation data of the particle flux ratio between collimator C55 and collimator C50 at different distances from the α-source.. ... 82 Figure 3.18 - Simulated average energy of α-particles reaching the cell target at different distances from the source, with an initial α-particle energy of 5.48 MeV. ... 83 Figure 3.19 – Simulated energy spectra of the α-source at a cell target positioned at different distances from the source. ... 84 Figure 3.20 – Simulated probability distribution for α-particle angle with the cell target’s surface positioned at different step distances from the source without a collimator (A) and with a collimator (B)... 84 Figure 3.21 - Simulated density distributions relating particle’s energy and angle with surface of the cell target positioned at d=2.9 mm (A) and 26.9 mm (B) with a non-collimated source. ... 85 Figure 3.22 - Simulated average α-particle energy deposition per particle at the first micrometre layer of the cell targets (A) and LET profile of the α-particles irradiated from the source at different targets, based on the simulated particle energies and data from the NIST database (B) with and without a collimator.. ... 86 Figure 3.23 - Surface dose rate of the α-source based on experimental and simulation particle fluxes at different cell target distances from the source with and without a collimator... 87 Figure 4.1 – Schematic representation of a cell sample in a 6 well plate well for clonogenic assay (A) and a cell sample plated on a 24 well plate well for DNA damage assay (B) following 223Ra treatment..
xix
Figure 4.2 – A) Simulated cell as a semi-ellipsoid with 20 μm side diameters and a 7.8 μm thickness. The nucleus is simulated as a full ellipsoid with 6 μm side diameters and 3 μm thickness, centered at the middle of the cell. B) Simulated cylindrical volume of a treatment solution with α-particle emissions resulted from 223Ra decays. ... 103
Figure 4.3 - Clonogenic survival data to the PC-3 cell line with α-particle irradiation from the α-source with and without the C50 collimator (n=3) compared to literature data for the same radiation and cell line. ... 107 Figure 4.4 - Clonogenic survival data comparing the PC-3, RWPE and NT01 cell lines dose responses to α -particle irradiations. ... 108 Figure 4.5 - Clonogenic survival data for PC-3 (A), RWPE (B) and NT01 (C) cell lines with X-ray and α-particle external beam irradiations. ... 109 Figure 4.6 - 53BP1foci data of PC-3 cells exposed to 0.5, 1 and 2 Gy doses of X-rays or α-particles. Cells were fixed at time points of 1 and 24h post-irradiation for 3 replicate experiments (n=3). ... 111 Figure 4.7 - 53BP1foci data of in PC-3 and RWPE cells exposed to a 2 Gy dose of α-particles. ... 111 Figure 4.8 - Clonogenic survival data for the PC-3 cell line comparing external irradiations with X-rays or α-particles to 223Ra α-particle internal radiation exposure. ... 112
Figure 4.9 - Clonogenic survival data comparing the PC-3 (A), RWPE (B) and NT01 (C) cell lines dose responses to α-particles from external source and 223Ra exposures. ... 113
Figure 4.10 - 53BP1foci data in PC-3 cells exposed to 0.5, 1 and 2 Gy radiation doses of external irradiations exposures to α-particles or X-rays, and internal exposures to 223Ra α-particles. ... 114
Figure 4.11 - 53BP1foci data in PC-3 and RWPE cells exposed to a 0.5, 1 and 2 Gy doses from 223Ra
α-particle internal exposure (24h).. ... 114 Figure 4.12 - 53BP1foci data in PC-3 and RWPE cells exposed to a 2 Gy radiation dose from an external source of α-particles and 223Ra α-particle internal exposures (24h).. ... 115
Figure 4.13 - Clonogenic survival data on PC-3 cells exposed to 223Ra for 6h (A) and 24h (B) using vials
with similar activities.. ... 116 Figure 4.14 - Clonogenic survival data on PC-3 cells exposed to 223Ra for texp = 6h (A) and for texp = 24h
(B) using vials with different activities. ... 116 Figure 4.15 – Effect of the Xofigo treatment volume/dose ratios on the survival fraction (SF) of PC-3 cells. Here the SF are displayed as logarithm values. ... 118
xx
Figure 5.1 - Xenograft tumour growth data from mice implanted with PC-3 metastatic prostate cancer cells... 126 Figure 5.2 - Tumour growth curves for the Gompertz models A to F, with initial starting volumes of 0.1% and 10% of the maximum tumour volume (K). ... 127 Figure 5.3 - Schematic representation of the radiation exposed (orange) and non-exposed (blue) tumour volumes for the uniform (A), outer layer (B) and constant volume (C) exposure scenarios. ... 130 Figure 5.4 - Illustrative tumour growth curves for the uniform (A), outer-layer (B) and constant volume (C) exposure scenarios. ... 133 Figure 5.5 - Kaplan-Meier curves for the clinical data of placebo and treatment groups from the ALSYMPCA trial data 43, comparing to the uniform model fit with initial dose rate estimation (𝐷0=
0.0103 Gy/h). ... 133 Figure 5.6 - Illustration of Agrowth and SMet model parameters which lead to plausible metastatic growth
kinetics. ... 134 Figure 5.7 - Dependence of best fitting parameters for each radiation effect model on Agrowth (A, C, E),
SMet (B, D, F) and maximum number of cells, K. ... 135
Figure 5.8 - Fit quality parameter (R2) of different radiation model as a function of A
growth (A) and SMet
(B)... 136 Figure 5.9 - Dependence of optimum CFraction in constant volume model on initial dose rate (𝐷0) when
fit to the ALSYMPCA treatment data, for different values of Agrowth (A) and SMet (B).. ... 138
Figure 5.10 - Dependence of the fit quality (R2) on the initial dose rate (𝐷0) when the constant volume
model is fit to the ALSYMPCA treatment data. ... 138 Figure 5.11 - Variation of CFraction with 𝐷0 for different tumour growth rates.. ... 139
Figure 5.12 - Effect of initial dose rate (𝐷0) on the best-fitting CFraction (A) and the product of 𝐷0and
xxi
L
IST OF TABLES
Table 1.1 – Main properties of radionuclides used in bone metastasis palliative treatment. ... 8 Table 2.1 – Table showing the simulated spectra maximum peak’s energies (𝐸𝑠𝑖𝑚) and maximum peak channel numbers (𝑁𝑐ℎ𝑎𝑛𝑛𝑒𝑙) used for calibrating the experimental energy spectra obtained from exposing a charged particle detector to the α-source.. ... 41 Table 2.2 – Table showing the experimental and simulated fluxes of particles hitting a target at different distances from the source (d).. ... 51 Table 2.3 - Simulated results of α-particle physical properties when reaching the cell target positioned at different distances from source to target (d). ... 64 Table 3.1 – Results of the averaged geometry parameters of the collimators C50 and C55.. ... 76 Table 3.2 – Simulation results of α-particle physical properties when reaching the cell target positioned at different distances from source to target with and without the collimator C50.. ... 92 Table 4.1 – Linear quadratic parameters obtained from experimental data of PC-3 cells exposed to α-particles compared to literature data... 107 Table 4.2 – Linear quadratic parameters ( standard deviation) obtained from experimental data of PC-3, RWPE and NT01 cell lines exposed to X-rays and α-particles with their associated RBE for 10% survival fraction. ... 109 Table 4.3 - List of Xofigo vials with corresponding activity concentrations for clonogenic experiments. ... 117 Table 4.4 – Decimal reduction dose (R10) value estimates from the curve fits to the surviving fraction
results shown in Figure 4.15... 118 Table 5.1 - Gompertz tumour growth parameters from different tumour models in literature and experimental data. ... 125 Table 5.2 - Results of the highest fit quality (R2) for the 3 tumour treatment models by varying the 3
xxiii
N
OMENCLATURE
53BP1 p53 Binding Protein 1 223Ra Radium-223 241Am Americium-241 A Radionuclide activity𝐴𝑐𝑡𝑣𝑖𝑎𝑙 Activity of the Xofigo vial used in experiments
ALSYMPCA Alpharadin in Symptomatic Prostate Cancer Patients clinical trial
𝐶𝐹𝑟𝑎𝑐𝑡𝑖𝑜𝑛
Ratio between the constant volume of radiation affected cells and the tumour maximum number of cells
CR-39 Allyl diglycol carbonate
CRPC Castration resistant prostate cancer
D Dose
𝐷̇𝑛𝑢𝑐𝑙𝑒𝑢𝑠 Nucleus dose rate
DAPI 6-diamidino-2-phenylindole
DNA Deoxyribonucleic acid
DSB Double strand break
EBRT External beam radiotherapy
eV Electron volt
Eμt Energy deposited per particle on the first micrometre layer of a target
FBS Fetal bovine serum
FDA US Food and Drug Administration
FWHM Full width at half maximum
Gy Gray
HR Homologous recombination
xxiv
IF Immunofluorescence
IMRT Intensity modulated radiotherapy
J Joule
𝐾 Maximum number of cells the tumour can have
LET Linear energy transfer
MCA Multichannel analyser
MRI Magnetic resonance imaging
Mylar Biaxially-oriented polyethylene terephthalate
n Number of experimental repeats
NaOH Sodium hydroxide
NHEJ Non-homologous end joining
NIST National Institute of Standards and Technology
NOD Net optical density
OD Optical density
OER Oxygen enhancement ratio
P(E) Probability density distribution
PBS Phosphate buffered saline
PE Plating efficiency
PSA Prostate-specific antigen
PETG Glycol-modified polyethylene terephthalate
Q Quality factor
R10 Decimal reduction dose
RBE Relative biological effectiveness
ROS Reactive oxygen species
SE Standard error
SF Survival fraction
xxv
SSE Symptomatic skeletal events
Sv Sievert
TOPAS Tool for particle simulation
V10 Decimal reduction volume
Xofigo Radium-223 dichloride
α-particle Helium ion (+2 charge) emitted by radioactive decay α1 Rate of cell killing by a single-hit particle
β1 Rate of cell killing by multi-hit particle events
β- particle Electron emitted by radioactive decay
∆ Energy cut-off threshold
θC Critical angle
θS Angle between a particle’s direction and the detector’s surface
1
CHAPTER 1 : I
NTRODUCTION
1.1 Cancer
Cancer is characterized by an abnormal cell proliferation which leads to the formation of malignant tumour cells. It can originate from any body part and is able to affect secondary body tissues that are either adjacent or distant to the primary location. This occurs when cancer cells spread through the bloodstream or lymphatic systems. Tumour progression and spread across different tissues occurs through the process of metastasis. 1
Cancer formation is related to alterations in cellular physiology, which impact the regulation of controlled cell production and programmed cell death. A disruption in this process can lead cells to uncontrollably multiply, evade programmed death mechanisms and spread to secondary tissues. These cancer cell properties are examples of the hallmarks of cancer described by Hanahan and Weinberg. 2
When a tissue has cells going through unregulated and uncontrolled growth, it becomes a neoplasm. The neoplastic cells can continue to grow and form a tumour. What differentiates between malignant tumour from a benign tumour state is the ability to spread to different tissues, usually correlated with fast growth. Malignant neoplasms, which typically grow faster and are able to spread, are more difficult to treat since removing the primary tumour might not be enough to eradicate tumour cells that metastasized. On the other hand, benign neoplasms are characterized by their slow growth and localised disease stage, usually being easier to treat. 3
In terms of disease incidence, cancer is one of the leading causes of death worldwide. In 2018, there were 9.6 million cancer related deaths reported. 4 In the same year, it was reported to be the second
leading cause of death in United States. 5 Figure 1.1 shows the estimated incidence of cases of the ten
2
1.1.1 Prostate cancer
Prostate cancer is estimated to be the third most diagnosed cancer in the world, having a worldwide incidence in men of 13.5%, being the most diagnosed male cancer in 2018. 4 According to
a variety of patient statistics, prostate cancer causes are highly related to either lifestyle and environmental risk factors or family history of disease. 6–8
1.1.1.1 Diagnosis and treatment
One of the characteristic proteins produced by the prostate gland is the prostate-specific antigen (PSA). This protein is important in fertility and in the dissolution of the seminal fluid coagulation. When a prostate tumour develops, the concentration of PSA increases. Therefore, one of the first steps on the diagnosis of prostate cancer is usually done by quantification of the PSA protein concentration in blood. However, more tests are needed since an increase of PSA concentration in blood might not necessarily be related to prostate cancer, but other diseases instead. Another important screening exam for prostate cancer is the digital rectal examination. These preliminary exams, if showing abnormal results, lead to deeper diagnosis tests, such as prostate biopsy, magnetic resonance imaging (MRI) or other imaging techniques. 9 Only after such analysis can a patient be positively diagnosed with prostate cancer.
Figure 1.1 - Estimated incidence of the ten leading male cancer types in USA, 2018. Adapted from Siegel et al. 5.
3
Depending on the disease stage, there is a variety of treatment options for localised prostate cancer. One of the options is active surveillance, as certain low-grade diseases pose very few risks for patients. In these cases, patients would be actively followed-up by checking their PSA levels in blood, collecting and analysing prostate tissue samples from biopsies, and MRI checks. 10,11
For higher-grade disease stages, there are local treatment options such as radical prostatectomy (removal of the entire prostate gland), androgen deprivation therapy or radiotherapy (external beam radiotherapy and brachytherapy). These treatment options are considered when test results indicate that cancer is progressing (increase in PSA blood levels, for example). In some cases, multimodality treatments can be used, for example using androgen deprivation as an adjuvant therapy, to reduce cancer growth stimulation by androgen, together with radiotherapy, for tumour eradication and control. Other non-standard treatment options that can be used are the recent modalities such as cryotherapy, high-intensity focal ultrasound, and photodynamic therapy, which can be considered for low grade local treatment before or after radiotherapy. 9,10
1.1.1.2 Bone metastasis in prostate cancer
As previously mentioned, the standard-of-care for patients with advanced prostate cancer is androgen deprivation therapy. After prolonged androgen deprivation, the disease can invariably progresses to a castration-resistant stage, an ultimately fatal condition for patients. 12 At this lethal stage,
a large percentage of patients with castration resistant prostate cancer (CRPC) (between 65%-90%) develop bone metastases. 13,14
The development of bone metastasis involves primary tumour cells that invade the vascular system and reach the bone marrow, as well the bone marrow microenvironment and bone cells, which accommodate and allow the metastization of the tumour cells. 15 As metastatic cells grow and evolve,
patients start feeling severe pain and develop symptomatic skeletal events (SSE), which include spinal-cord compression and symptomatic pathological fractures. 16 Figure 1.2 shows two scintigraphy images
of two patients with multiple bone metastatic lesions. Bone metastases not only affect patients with CRPC, but they are also a major complication of several other solid cancers, such as breast, lung, kidney, and thyroid cancers as well as multiple myeloma. 17
Treatment of bone metastases in patients with CRPC may involve bisphosphonates, denosumab and β- emitting radiopharmaceuticals, which reduce pain levels and the incidence of SSE, but fail to
prolong survival. Fortunately, the number of therapeutic approaches is increasing and new promising modalities have been approved based on evidence of prolonged survival. These include the use of chemotherapy (docetaxel, cabazitaxel), androgen receptor directed therapy (e.g. Abiraterone and
4
Enzalutamide) and radionuclide systemic therapy (223Ra). 18 The latter has emerged as one of the most
important modalities for cancer management for patients with multiple skeletal metastases.
1.2 Radiotherapy
Radiotherapy is a cancer therapy modality where radiation is used to cure or control tumours. It has been used since 1896, almost immediately after the discovery of X-rays by Wilhelm Roentgen in 1895. 19
This treatment modality uses ionizing radiation, such as X-rays, gamma rays or electrons, which travel through body tissues. Heavier particles can also be used - protons, helium ions (α-particles) or carbon ions as part of heavy particle radiotherapy. Although they have different physical properties, all these types of ionizing radiation damage cancer cells, inducing DNA strand breaks. When cells fail to properly repair such damages, they end up dying. Subsequently, the higher the absorbed radiation dose is, the higher the chance of killing a cell. 20
The goal of radiotherapy is the use of ionizing radiation to kill cancer cells while minimizing damage to the surrounding healthy tissues. This can be done by several radiotherapy techniques, where different radiation particles are used as part of single or adjuvant therapies. Deciding which radiotherapy approach is most appropriate depends on the tumour type, surrounding tissues, patient clinical diagnosis as well as the radiation dosimetry involved for that treatment. 21
Figure 1.2 – Scintigraphy images using 99Tc from two patients with multiple bone metastasis. Adapted from
5
1.2.1 External beam radiotherapy
External beam radiotherapy (EBRT) is the most common type of radiotherapy. In this modality, one or more beams of ionizing radiation are aimed at a tumour. The goal is to deliver the highest radiation dose to the tumour, with lower doses in the surrounding healthy tissues. This is possible when a treatment plan has different sets of beams targeting the tumour from different incident angles and beam source locations. The use of multiple beams usually allows higher dose painting areas focused on the tumour while sparing other tissues from significant radiation doses.
Another important factor to consider in radiotherapy, and more specifically in EBRT, is fractionation. Fractionation is related to the number of radiation treatment sessions (fractions) that a patient is planned to receive. Opting for a treatment with a few fractions of radiation with high doses each or a treatment with higher number of fractions with low radiation doses each are important choices to make. In addition, the time delay between each of those fractions is equally important to consider.
The advantages of fractionated radiotherapy can be explained by the five R’s of radiotherapy: • Repair of sublethal cellular damage in healthy tissues
• Repopulation of cells after radiation exposure
• Redistribution of cells to more sensitive cell cycle phases • Reoxygenation of surviving cells
• Radiosensitivity
Redistribution and reoxygenation are associated with increased cell kill, since they lead to treatment resistant cells moving into more sensitive states. On the other hand, repair and repopulation are related to increased cell survival, as they lead cells, particularly cells from healthy surrounding tissues, to recover between treatment fractions. Radiosensitivity is an intrinsic effect in radiotherapy that is related to the different cells sensitivities to different radiations and radiation doses. 22,23
EBRT treatments mostly use photons, protons or carbon ions. These radiation particles are externally produced but have distinct physical and biological interactions with matter. Photons typically deposit most of their energy near the surface of the tissue they are travelling through. However, heavier particles like protons or carbon ions, deliver most of the treatment dose at the end of their path – commonly called the Bragg peak region. 21 These physical differences will be covered later.
6
1.2.2 Targeted radionuclide therapy
Targeted radionuclide therapy typically consists on the use of radionuclides for internal radiotherapy exposure. It consists of the administration of radionuclide labelled drug vectors, acting as radiopharmaceuticals, that target and bind to cancer cells, inducing cytotoxic radiation effects in them. The radionuclides emit radioactive particles, such as β-particles, gamma rays or α-particles, through decay. In comparison with EBRT, this radiotherapy modality is specifically targeted at cancer sites, often with lower cytotoxic effects on healthy tissues.
Other targeted radionuclide therapies can include brachytherapy, where capsuled radionuclide materials are placed in contact with targeted cancerous tissues, such as in prostate cancer.
1.2.2.1 α and β emitter radionuclides
Most of the radionuclides used in targeted radionuclide therapy are α and β- emitters. β- particles,
sometimes referred as β particles only, are electrons emitted through decay, usually with energies varying from a few keV to hundreds of keV. These particles have long ranges in tissue (typically >1 mm). α-particles are helium ions with +2 charge also emitted through decay. α-particles usually have higher energies than β- particles, in their case of a few MeV, with lower ranges in tissues (< 0.1 mm).
Figure 1.3 shows a schematic representation of α and β- emissions produced through decay processes.
In comparison to β- emitters, α-particles can only travel through a few dozens of micrometres in
tissue before they are completely stopped. This has important implications when considering the microdosimetry of this therapy modality. Figure 1.4 shows a typical path length comparison between α and β- particles at cell level. It also shows that the number of ionization events in a cell per incident
particle is significantly higher for α-particles. 24,25 The number of ionization events is directly related to
DNA damage and cancer cells death, as it will be discussed later.
Figure 1.3 – Schematic representation of α and β- emissions from a radionuclide X with atomic mass A and
7
1.2.2.2 Palliative treatment of bone metastasis using radionuclides
One of the uses of targeted radionuclide therapy is related to the palliative treatment of bone metastasis, often associated with breast, prostate, myeloma and lung cancers. 26 Typically, these
radionuclides are labelled with bone seeking tracers. 27 By specifically targeting bone metastatic sites,
the radioactive decay products will mostly affect the cancer cells, sparing healthy tissue from most of the damage. Some examples of radionuclides used for bone metastasis treatment are displayed in Table 1.1.
Some of the main differences in the radionuclides used are the type of particle emissions and their range in tissue. As shown in the previous section and in this table, βelectrons can travel through more than 0.5 mm in tissue (water equivalent) before they stop. On the other hand, α-emitting radionuclides such as 223Ra have particle emissions that can travel less than 0.1 mm in tissue.
Figure 1.4 – Schematic representation of the track length of α-particles (a) and β-particles (b) while going through cells and their nuclei (coloured as darker blue). α-particles can only go through a couple of cell diameters causing multiple ionization events for a short distance while β-particles can go through multiple cell layers (final track length not represented) with few ionization events along their path. Adapted from Couturier et al 24.
8
Table 1.1 – Main properties of radionuclides used in bone metastasis palliative treatment – radionuclide’s half-life, main particle emissions (CE stands for conversion electron), average particle energy and average particle range in water. Examples of conducted studies and clinical trials are also shown. Adapted from Tomblyn et al 26.
Radionuclide Half-life (days) Particle emission Average energy (keV) Average range (mm)
Previous trials and studies 32P 14.3 β- 695 3.0 Silberstein et al 28 89Sr 50.5 β- 580 2.4 Zheng et al 29 153Sm 1.9 β- 233 0.5 Ratsimanohatra et al 30 186Re 3.7 β- 349 1.1 Minutoli et al 31 188Re 0.7 β- 2120 3.5 Liepe, Knut 32 117mSn 13.6 CE 127 < 0.1 Srivastava et al 33 223Ra 11.4 α 5870 < 0.1 Cabrera et al 34
Figure 1.5 - Schematic representation of the 223Ra decay chain. The energy of each emitted 𝛼-particle is
shown in brackets. The physical half-life of each radionuclide is also displayed, as well as the probability of each decay emission (100% probabilities are not displayed).
9
1.2.2.3
223Ra use in bone metastatic prostate cancer
Over the last decades, α-emitting radionuclides have evolved from being used in in vitro studies to being used in in vivo studies and clinical trials. 24,35–38 In particular for patients with multiple skeletal
metastases, 223Ra has emerged as one of the most important modalities for cancer management.
Radium-223 (223Ra) is a calcium-mimetic and complexes with hydroxyapatite crystals in
osteoblastic bone metastases. 39 This means that when injected into the body, 223Ra will specifically
target tissues with high cell activity and bone turnover, such as bone metastasis. 223Ra treatments have
been approved by the US Food and Drug Administration (FDA) and are given to patients in the form of
223Ra dichloride injections (Xofigo; Algeta–Bayer HealthCare Pharmaceuticals, Wayne, NJ). 40
223Ra has a physical half-life of 11.4 days and each 223Ra decay results in the emission of 4
α-particles in the primary decay chain (Figure 1.5). 41 In treatments for bone metastatic patients, 223Ra has
shown a mean effective half-life of 8.2 days, based on the radiopharmaceutical biokinetics that take into account its biological clearance rate. 42 The differences between the physical and biological half-lives
of radionuclides will be covered in a later section of this introduction.
The average range of 223Ra emitted α-particles is about 50 µm (it varies for the different particle
energies). For small lesions such as skeletal metastasis, this is important as it minimizes the damage to the surrounding bone marrow cells. A schematic representation of different radiation particles ranges compared to a bone metastatic cell cluster is represented in Figure 1.6. For these types of lesions, α-emitting radionuclides and, in particular, 223Ra, offer one of the most targeted therapies.
In the recent years, 223Ra radiopharmaceuticals have been shown to improve overall survival and
time to first symptomatic skeletal events (SSE) of patients with multiple bone metastasis, in particular in patients with castration resistant prostate cancer (CRPC). This was demonstrated during the phase 3 clinical trial ALSYMPCA in 2013, with a total of 921 patients randomly assigned to being treated or not with 223Ra. The trial results showed that the 223Ra led not only to a prolonged time to the first SSE
for treated patients (5.8 months) but also to a significant positive effect on overall survival (3.6 months), without evidence of long-term toxicity. 43
1.3 Physics of ionizing radiation in radiotherapy
1.3.1 X-rays and gamma radiation
X-rays are photons that can be produced externally by the collision of accelerated electrons with a metal. In EBRT, the acceleration of electrons process usually occurs through high-frequency
10
electromagnetic waves on medical linear accelerators (Linac). The collision of these high energy electrons with a heavy metal result in an energy release in the form of heat and X-ray photons. These resulting photons have energies in the order of MeV. When interacting with cell tissues, X-rays will produce secondary ionizing events, which can lead to cell death. 44,45 This will be further discussed later.
Another form of ionizing radiation based on photons is gamma radiation (γ). γ-rays are produced through radioactive decay of radionuclides, such as 99mTc, 60Co and 137Cs. γ-rays are typically used for
nuclear medicine imaging techniques or radiotherapy treatments, either for EBRT or targeted radionuclide therapy.
1.3.2 Charged particles
One of the disadvantages of using photons in radiotherapy is related to the dose distribution through the tissue thickness. The maximum dose peak is observed within the first centimetres of soft tissue, followed by an approximately exponential dose fall-off that continues to impact tissue cells that are distant from the tissue’s entry point. This has many negative implications, especially for healthy tissues that surround the cancer. This is not the case for charged particle radiotherapy. 46
Figure 1.6 – Bone-targeted localized mechanisms of action of the α-emitter isotope 223Ra comparing
treatment area ranges to other ionising radiation (β particles, X-rays and gamma radiation). Adapted from Philippa et al 38.
11
For treatments using charged particles, such as protons or carbon ions, it is possible to control the damage to healthy tissue with much better results than when using photons. These particles travel mostly with well-defined trajectories, depositing their energy as they interact with the electrons of a medium. As charged particles lose energy, they start to slow down. Up until a limit, the “slower” the particle is, or the lower its energy, the higher the chance to interact with matter, leading to a higher energy deposition. The higher energy deposition occurs closer to the end of the particle’s path, at a region known as the Bragg peak. This position of this region mostly depends on the energy of the incident particle. 20,47,48
The dose distribution profile of charge particles follows a Bragg peak distribution, as shown in Figure 1.7. Here we compare the dose deposition profiles of proton and photon beams. We can also take further advantages of charged particle properties and use multiple beams coming from the same entry point with different intensities and particle energies. The summed beam dose contributions follow a spread out Bragg peak distribution, as shown in the previous figure. The spread out Bragg peak is
Figure 1.7 – Dose distributions of a photon beam and charged particle beams. The dashed line shows the dose distribution in depth of a 10 MV photon beam. The solid lines represent the dose distribution of 12 charged particle beams with different initial energies. The dotted line represents the dose distribution of the spread-out Bragg peak particle beam combined from the contributions from the pristine Bragg peaks of the different charged particle beams. Adapted from Levin et al 20 and Terasawa et al 47.
12
particularly relevant when treating a tumour with a size bigger than a single beam Bragg peak, as the single beam treatment would fail to target the whole tumour.
However, unlike photon-based radiotherapy, charged particle beams can generate neutrons which will scatter into adjacent normal tissues from the target volumes. These neutrons can increase the risk of secondary malignancies as they lead to considerable biological effects in healthy surrounding tissues. Furthermore, charged particle beams become less sharp at greater depths due to the higher number of scattering events. Charged particle also lead to more sensitive biologic effects due to differences in tissue densities. In order avoid tumour underdosing and to account for tissue heterogeneity, a margin of uncertainty is usually added in such treatments. 49,50
Charged particles are generated by decay of radioactive isotopes or produced through particle accelerators.
1.3.2.1 α-particles
As previously mentioned, α-particles are helium ions with +2 charge. These particles are emitted through radioactive decay from isotopes such as 241Am, 238Pu or 223Ra. In radiotherapy, α-particles are
used as part of internal radionuclide therapies, using 223Ra injections to target bone metastasis for
example. 43 In cell radiobiology research laboratories, experiments are typically conducted using
α-sources – materials coated with a radioactive layer of a long-lived α-emitting radionuclide, such as
241Am or 238Pu. 51,52
These α-particles have similar radiobiological properties to protons or carbon ions. The main difference is how they interact with tissue. Protons and carbon ions can travel through hundreds of millimetres of human tissue’s thickness before they are stopped, as opposed to an α-particle’s range – typically less than 100 micrometres. This is due to the initial energy of these particles, typically below 10 MeV for α-particles and above 100 MeV for protons and carbon ions in radiotherapy.
1.3.2.2 Linear energy transfer of α-particles
Linear energy transfer (LET) can be defined as the energy transferred to matter per unit length of a particle’s track. It depends on the type of particle, its energy and the medium which the particle is travelling through. LET is an average value and its units are usually expressed as kiloelectron volt per micrometre (keV/μm). The higher the LET, the higher the number of ionization events per unit travelled.
13
An ionization event from a particle track consists on the transfer of enough energy from the travelling particle to an atom, leading to the ejection of an electron from it. As a result, that atom is ionized. The ejected secondary electron can interact with other atoms and result in further ionization cascades, with multiple secondary electron ejections.
Charged particles like α-particles, protons or carbon ions are considered to be high LET particles (>10 keV/μm). These particles deposit high amounts of energy in a short distance, compared to low LET particles such as photons. As a result, high LET particles are densely ionizing with most of the ionizations occurring along the particle track. This has important implications in cell survival, as ionization events lead to DNA damage which can result in cell death. 53,54
As previously mentioned, α-particles are high LET particles. The LET variation with travelled distance is similar to the Bragg peak behaviour, as shown in Figure 1.8. As demonstrated in this figure, the higher the initial particle energy, the longer its track path before the particle is stopped, with the highest LET occurring at a greater depth in the medium, in this case water (human tissue equivalent).
55
The LET calculation is highly related to the stopping power of the material the ionizing particle is travelling through. It corresponds to the sum of the nuclear and electronic collision stopping power of the medium locally. The stopping power is denoted as −𝑑𝐸
𝑑𝑥, where 𝑑𝐸 is the particle’s energy lost
while travelling through a 𝑑𝑥 length distance. The LET and the stopping power are many times Figure 1.8 – LET variation with distance travelled in water of α-particles with 2 different initial kinetic energies (5.9 and 8.4 MeV). Adapted from Sgouros et al 55.
14
considered to be the same. However, the main difference between the two concepts is that the LET can correspond to the restricted stopping power − (𝑑𝐸𝑑𝑥)
∆, in the sense that it only considers particle
interactions where energy transfers associated with each particle collision are lower than the energy cut-off threshold ∆. The restricted stopping power calculation does not take into account energy transfers that are higher than ∆. The reason for this is because higher energy transfers lead to the ejection of energetic secondary electrons which will travel for longer distances and produce fewer secondary ionizations in the immediate vicinity of the track in comparison to lower energetic secondary electrons. The density of ionization events per particle track is therefore lower for electrons produced through higher energy transfer events. 46,56 These electrons will more likely lead to secondary ionizations at
further distances than the original particle track depth.
For certain applications with charged particles, it’s relevant to consider the LET as the restricted stopping power, while for others it is acceptable to consider ∆ as infinite, which approximates the LET to be the same as the stopping power. The distinction between the two concepts is not trivial, especially as it is not straightforward to properly define the energy cut-off threshold ∆. For simplification purposes we have considered the LET to be the same as the general stopping power, which should be approximate for the experimental and simulated conditions considered in this thesis work.
It is also important to distinguish track-averaged LET and dose averaged LET. Track averaged LET is the mean of each individual particle LET traversing a target. This parameter averages together particles that can have higher LET, depending on energy differences, which will typically lead to higher biological effects than lower LET particles. In order to take particle LET differences into account, the dose averaged LET weights each particle’s LET according to the dose they deposit in a targeted volume. This parameter describes more accurately the LET impact of a particle beams. 57,58
1.3.3 Radionuclides: Physical and biological half-lives
There are important aspects involved in targeted radionuclide therapy that EBRT does not involve, such as the physical and biological half-lives of the radionuclides used. These are related to the radioactive decay processes of isotopes and their clearance rate from the patient tissues after a treatment injection, respectively. Both factors should be taken into account in treatment planning as they impact the treatment dosimetry, tissue toxicity and therapy effectiveness.
The physical half-life directly affects the radioactivity of the radionuclide with time. It dictates the number of particle emissions per time, which are important to consider for radiation dose calculations. Its value represents the amount of time needed to pass for the number of the initial
15
radionuclide atoms to be reduced by half. The physical half-life is directly related to the radionuclide’s physical decay constant (λp):
𝑇𝑝=
𝑙𝑛 (2)
𝜆𝑝 1.1
The number of radionuclide nuclear disintegrations per unit time is represented by the radionuclide’s activity (𝐴) and is calculated following the equation:
𝐴(𝑡) = 𝐴0𝑒−𝜆𝑝𝑡 1.2
where, 𝐴(𝑡) is the radionuclide’s activity at a certain time period 𝑡 and 𝐴0 is the initial activity.
Its units are usually expressed in Becquerel (Bq), as the number of nuclear disintegrations per second. The biological half-life, 𝑇𝑏, is related to the biological clearance of the radionuclide labelled drug
by the organ tissues. 59 It dictates the number of radionuclide atoms that remain in tissue with time. It is
also directly related to the biological decay constant, λb. This parameter is independent of the physical
activity of the radionuclide used.
The combination of 𝑇𝑝 and 𝑇𝑏 influences the radionuclide’s activity in tissue with time:
𝐴(𝑡) = 𝐴0𝑒−𝜆𝑒𝑡 1.3
where 𝜆𝑒 is the effective decay constant (λ𝑝 + λb). The effective half-life is:
𝑇𝑒=
𝑇𝑝 𝑇𝑏
𝑇𝑝+ 𝑇𝑏
1.4 For example, as discussed in section 1.2.2.3, 223Ra effective half-life is T
e = 8.2 days, in
comparison to its physical half-life (Tp = 11.4 days).
1.4 Radiobiology
1.4.1 Absorbed dose
There are different parameters that describe and evaluate ionizing radiation effects on matter. The LET is one of those, mentioned in the previous section. Another of the most important parameters is the absorbed radiation dose (D). It represents the amount of absorbed energy by matter that was exposed to a certain radiation. It is expressed with units of gray (Gy). 1 Gy corresponds to 1 Joule per kilogram of matter (J/Kg). The absorbed dose needed to achieve a certain biological effect in a tissue is dependent on the tissue and the radiation used. High LET radiation, such as α-particles, is often more biologically damaging than low LET radiation for the same dose. 44,60
16
Other parameters that are important when comparing different radiation types are the relative biological effectiveness and the oxygen enhancement ratio. These radiobiological parameters provide a better radiation characterization and comparison, especially when comparing dosimetric effects at the cell level.
1.4.2 Linear quadratic model
Cells can lose their ability to divide when they are exposed to radiation. In radiotherapy, this is important to consider as the targeted cancer cells may not necessarily need to die, as long as they lose the ability to grow. The number of viable cells decreases with increasing dose. One of the models that describes this relation between growth loss ability and radiation absorbed dose is the linear quadratic model. This model has been well established as a radiobiological model for a long time and has been proved to accurately describe dose response relationship in most cell models. 44
The model describes the surviving probability of cells when receiving a dose D:
𝑆𝐹 = 𝑒−(𝛼1𝐷 + 𝛽1 𝐷2) 1.5
where 𝛼1 represents the rate of cell killing by single-hit particle events, 𝛽1 refers to the rate of
cell killing by multi-hit particle events. These parameters depend on the cell type and radiation particles used, being expressed in units of Gy-1 and Gy-2, respectively.
Assuming a target population of Nc cells, the surviving fraction of the cell population can be rewritten based on each individual cell surviving probability, SPi: 61
𝑆𝐹 = ∑ 𝑆𝑃𝑖
𝑁𝑐
𝑖=1
𝑁𝑐
1.6
1.4.3 Relative biological effectiveness
The relative biological effectiveness (RBE) is used to compare biological effects of radiation exposures by different radiation types. The RBE is defined by the ratio of the absorbed doses of two radiation sources that led to the same biological effect:
𝑅𝐵𝐸 = 𝐷1 𝐷2
1.7 where D1 is the radiation dose of a radiation type that led to the same biological effect of a dose
17
effective than the other if the RBE is greater than 1. The biological effect can be, for example, the same cell survival percentage after a cell population is exposed to radiation. An example is shown in Figure 1.9 comparing the doses that led to a 10% survival fraction from charged particle and X-ray exposures.
53
It is known that high LET radiations lead to higher RBE in comparison to lower LET. 62–64 This
was proved when helium ion irradiation results from hamster lung cells were compared to gamma radiation exposure from 60Co decays. The RBE increased for increasing average particle LET values up
until 131 keV/μm, to which the RBE values decrease for higher LET values than that. 65
RBE is also taken into account in radiation risk calculation, through quality factors. An example of that is the calculation of the equivalent dose (HT), which considers the radiosensitivity of tissues to
a radiation type. It is expressed in units of Sievert (Sv):
𝐻𝑇 = 𝐷 × 𝑄 1.8
Here, D is the absorbed dose and Q is a quality factor directly related to the radiation LET. The quality factor of photons and electrons is considered to be 1, whereas for α-particles it is typically considered to be higher than 20. 44,60
Figure 1.9 – Example of the calculation of the relative biological effectiveness for a cell survival fraction of 10% between deposited doses of a radiation particle and X-rays. Adapted from Fokas et al 53.
18
1.4.4 Oxygen enhancement ratio
The oxygen concentration in tissues and cells plays an important role in cellular dose response to radiation. The biological effect of a given radiation delivering the same dose to cells that have different oxygen concentrations can be different. Typically, cells with low oxygen concentrations (hypoxic cells) are more radioresistant. This is due to the fact that molecular oxygen is a chemical radiosensitizer, enhancing the radiation cell kill effect by increasing the chance of the production of free radicals. 66
It is important to understand the different radiation dose responses of cells in hypoxic or aerobic conditions. The oxygen enhancement ratio (OER) characterizes that effect. It is defined as the ratio between the dose necessary to achieve a certain biological response on cells under full hypoxic conditions and the dose necessary to achieve the same response on cells under normal oxygenated conditions.
For low LET particles, the OER values are typically significantly greater than 1. This means that the dose necessary to reach a certain biological effect in hypoxic conditions needs to be higher than in aerobic conditions, for the same biological outcome. In comparison to low LET particles, α-particles have demonstrated to have lower OER values, which can be close to 1 depending on their energy. Figure 1.10 shows a comparison of α-particles OER varying with LET. 55
The reasons OER typically decrease with increasing LET are related to the lower presence of reactive oxygen species in low oxygen concentration tissues after irradiation. The presence of these species indirectly increase DNA damage from radiation in cells. It is known, however, that high LET radiation leads to more direct and complex DNA damages, even with lower number of reactive oxygen species products. We will discuss how these products impact DNA damage levels below.
Figure 1.10 – Oxygen enhancement ratio variation with LET. The data used in this plot was from human kidney-derived cells that were incubated in air (aerobic conditions) or nitrogen (hypoxic conditions). Authors irradiated cells with α-particles of different energies (having different initial LET values) that were generated through a cyclotron. Adapted from Sgouros et al 55.