EUROSTEEL 2014, September 10-12, 2014, Naples, Italy
EXPERIMENTAL ANALYSIS OF A T-STUB COMPONENT SUBJECTED
TO IMPACT LOADING
Pedro Barataa, Aldina Santiagoa, João Paulo C. Rodriguesa, Constança Rigueirob
aISISE - Institute for Sustainability and Innovation in Structural Engineering - University of Coimbra, Portugal
[email protected], [email protected], [email protected]
bISISE – Polytechnic Institute of Castelo Branco, Portugal
INTRODUCTION
After the accidents occurred during the first decade of this millennium, such as the World Trade Center (2001), London (2005) and Madrid (2004), special attention was given to the study of robust structures subjected to different accidental loads. Additionally, the World Trade Center attack has highlighted troublesome weakness in design and construction technologies of structural connections, which exhibited poor performance caused by brittle failure. Structural details played a very significant behavioural role when the structure is subjected to impulsive loads [1].
Concerning the behaviour of steel joint, the literature presents several studies on steel connections under both static and cyclic loads [2, 3]; many results of these studies have contributed for improving the current standards, such as the Eurocode 3, part 1-8 [4]. However, only scarce information exists concerning the behaviour of these joints directly loaded by higher loading rates [5].
This paper is devoted to the report of an experimental programme on steel joints under impact loading, in particular to the assessment of the welded T-stub response under tension. The T-stub is used to evaluate the behaviour of the tensile components that are responsible for the deformability of the joint, such as the end plate in bending. Firstly, the paper describes the features of an experimental system developed at the University of Coimbra, to apply high rates of loading; then, it presents the experimental campaign and compares the response of T-stubs under quasi-static and impact loading.
1 EXPERIMENTAL SYSTEM FOR APPLYING HIGH RATES OF LOADING
Experimental programme
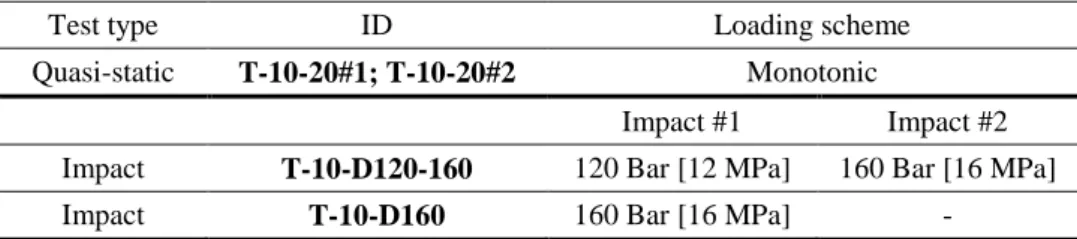
The experimental programme includes two impact tests on welded T-stubs (Table 1): i) rapidly applied loading of 120 Bar [12 MPa], followed by 160 Bar [16 MPa] (test T-10-D120-160); and ii) rapidly applied loading of a single impact equal to160 Bar [16 MPa] (test T-10-D160). The results of these tests are compared against reference quasi-static tests, performed by Barata and co-authors [6]. The T-stub geometry is defined by two plates, the flange and the web, welded by means of a continuous 45º fillet (aw), as illustrated in Fig.1. The thickness of the flange plate (tf) and the thickness
of the web plate (tw) are 10 mm. The flange is bolted through two bolts M20, grade 8.8 fully threaded. Table 1 – Experimental programme.
Test type ID Loading scheme
Quasi-static T-10-20#1; T-10-20#2 Monotonic
Impact #1 Impact #2 Impact T-10-D120-160 120 Bar [12 MPa] 160 Bar [16 MPa]
Impact T-10-D160 160 Bar [16 MPa] -
ID: first letter is the connection reference: T – T-stub; the second field represents the thickness of the T-stub flange; the third field represents the type of the test: 20 – static reference test; D120-160 – impact test under sequential increase of pressure: 120 Bar [12 MPa] followed by 160 Bar [16 MPa]; D160 - impact test under 160 Bar [16 MPa].
Fig. 1. T-stub geometry.
Experimental system
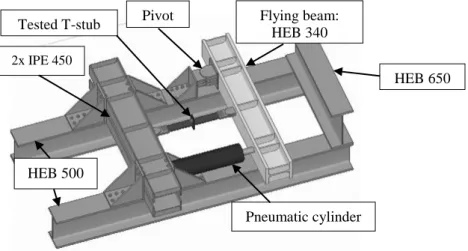
The test apparatus to apply the high rates of loading (Fig. 2) has been designed and constructed at University of Coimbra within the research project Impactfire PTDC/ECM/110807/2009.
The rig was designed according the current Standards [4, 7], providing resistance and stiffness for the proposed tests. Two main HEB 500 beams, placed horizontally are fixed to the reaction slab. In one end, these two beams are orthogonally bolted to a rigid reaction frame built from two IPE450, and in the other end they are connected to a HEB 650, all in structural steel grade S355. The impact force is applied in the “flying beam” by a pneumatic cylinder with a 125 mm of diameter. The cylinder was designed to work with a maximum operating pressure of P = 300 Bar [30 MPa]. During the tests, it is mandatory that the deformation of this beam be negligible; so, a welded section HEM 340, steel grade S355J2 was chosen for this purpose; it presents a very high flexural stiffness (EI) of 160 MN.m2, and the elastic moment capacity is equal to 1438 KN.m, which is much higher than the value
expected during the tests (maximum moment around 130 KN.m) [8].
Fig. 2. Layout of the experimental system.
Test procedure
The load is applied in the flying beam through a pneumatic driven cylinder that is fixed to the reaction frame (Fig. 2). Before applying the first impact, the rod of the cylinder is in contact with the beam. The accumulator is filled with the predefined pressure; then, the quick open valve is opened and the air flows from the accumulator to the cylinder inducing the impact force in the “flying beam”. For sequential tests, incremental impact loading is considered; so, after the first impact, the specimen is unloaded and then loaded again with a second impact.
Instrumentation
During the impact tests, force, displacements, accelerations and strains are measured. Because this type of tests occurs in a very short time intervals (hundredths of a second), specific equipment with large sample rate should be used. The data are recorded with a NI Compact DAQ 9172 chassis system, providing high performance for data acquisition. Chassis is connected to a host computer over USB; this type of data acquisition provides a very good relation signal-noise. The acquisition of the accelerations are performed with a 4-Channel, ±5 V, 24-Bit IEPE Analogue Input Device, the strains with a Bridge Module 24 bits for quarter, half and full bridge measurements and the displacements
170 105
30
30
Top view Lateral view
aw tf tw Pneumatic cylinder Flying beam: HEB 340 Tested T-stub Pivot
HEB 500 2x IPE 450 HEB 650 tw tf aw
with a 16 bits module, with 8 Channel Current Input. The signal obtained from different types of measurements is processed in a virtual instruments program in Labview [9] environment.
Fig.3 identifies the locations of the instrumentation used in the flying beam and specimen. The
displacements are measured at three points: in the middle of the beam dcm, in boundary of the
application point of the force df, and in the T-stub (T1 and T2). A laser triangulation sensors Riftek
model RF603/500, with a 9.4 Khz of bandwidth and a accuracy of +/- 0.5 mm, is used for these measurements. For measuring the accelerations, two piezoelectric accelerometers Brüel & Kjær model 4370 are used. The acceleration values are obtained for centre of mass of the “flying beam” Acm and in the point where the force is applied Af. The force FA is measured with a purpose built load
cell, located between the rod end of the cylinder and the “flying beam”.
Fig. 3. Location of the instrumentation.
Evaluation of the specimen response
Fig. 4 depicts the free body diagram force-rotation in the “flying beam”. This beam consists in a
second class lever pivot located at point (1); the load is applied in point (2) and the tested specimen is subjected to the force Ft at point (3). If quasi-static tests are performed, only the static force
equilibrium is required, no inertia forces are involved; however, during the impact tests, it is necessary to calculate the inertial resistance moment of the beam because of the inertial forces that are involved during the impact [9].
Fig. 4. Free body diagram in the flying beam.
The equilibrium of the dynamic force with inertial effects is represented in the Eq. (1):
𝐹𝑡(𝑡) = 𝐹𝐴(𝑡) − 𝐹𝐼(𝑡) + 𝑅𝐴(𝑡) (1)
where: Ft is the force in the tested specimen [KN]; FA is the applied force by the cylinder [KN]; FI is
the force of inertial and RA is the reaction in the pivot [KN].
By taking into account the centre of rotation and the location of the centre of mass, the dynamic moment equilibrium at pivot (location (1) at Fig. 4) is calculated by Eq. (2) :
𝐹𝑡(𝑡) × 𝑥2 = 𝐹𝐴(𝑡) × (𝑥2(𝑡) + 𝑥3(𝑡)) − 𝑚 × 𝑧𝑐𝑚̈ (𝑡) × 𝑥𝑐𝑚− 𝐼 ×
𝐴𝑓
𝑋2(𝑡) + 𝑋3(𝑡) (2)
where: x2(t) is the distance x2 in time [m]; x3(t) is the distance x3 in time [m]; xcm is the distance of FAdf Af Acm T1 T2 x1 x2 x3 x4 L dcm X1 X2 X3 X4 RA Ft FA (1) Z2 Z3 Z1 Center of mass r (1) L (3) (2)
of the centre of mass of beam [m/s2]; I is the inertia of the “flying beam” [kg.m2]; and Af is the
acceleration in the point where the force is applied [m/s2].
2 RESULTS
Assessment of the force transmitted to the T-stub
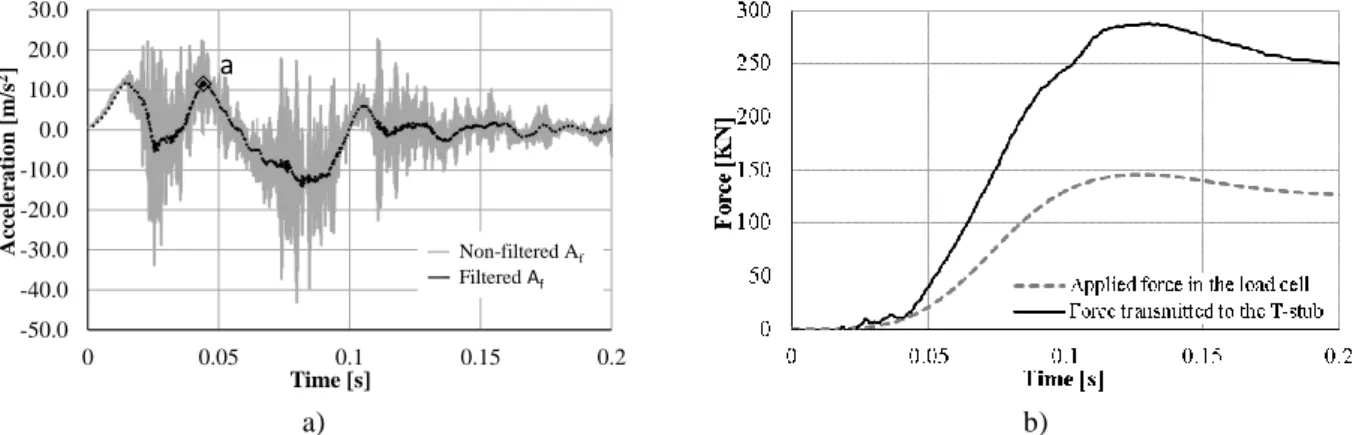
To solve Eq. (1) and Eq. (2), it is necessary to take into account the inertia effects, which are dependent of the measured accelerations in the center of mass (𝑧𝑐𝑚̈ ) and in the point where the force is applied (Af). In order to exemplify these calculus, Fig.5a) presents the acceleration Af (non-filtered
and filtered) vs time for the specimen T-10-D160; the high frequencies are filtered to reduce the noise of the signal, and the filter was calibrated based on the power spectrum of the accelerogram. Similar measurement and treatment is made for the acceleration 𝑧𝑐𝑚̈ . After known these values, Eq. (2) is solved and the force transmitted to the T-stub (Ft), taking into account the inertia effects, is obtained
(Fig.5b). It should be highlighted that for future calculations (section §2.2), the force transmitted to the T-stub is relevant only after the second peak of acceleration, t = 0.045 s (point a, in Fig. 5a); before this instant, the force measured in the load cell is very low and it is used to overcome the inertia of the system.
a) b)
Fig. 5 – a) acceleration Af for 10-D160 specimen; b) Applied force in the load cell and force transmitted to the T-stub.
Test results
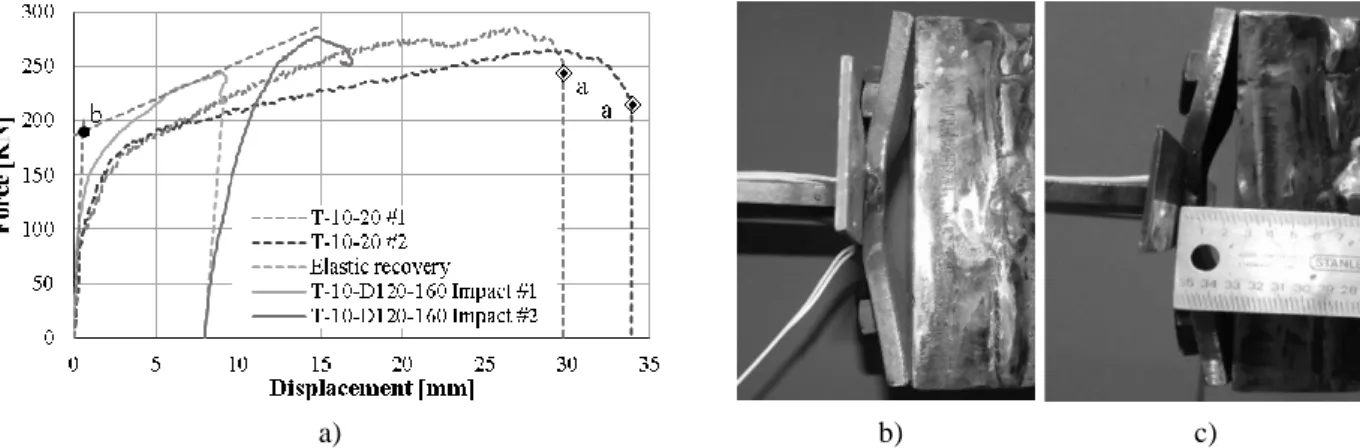
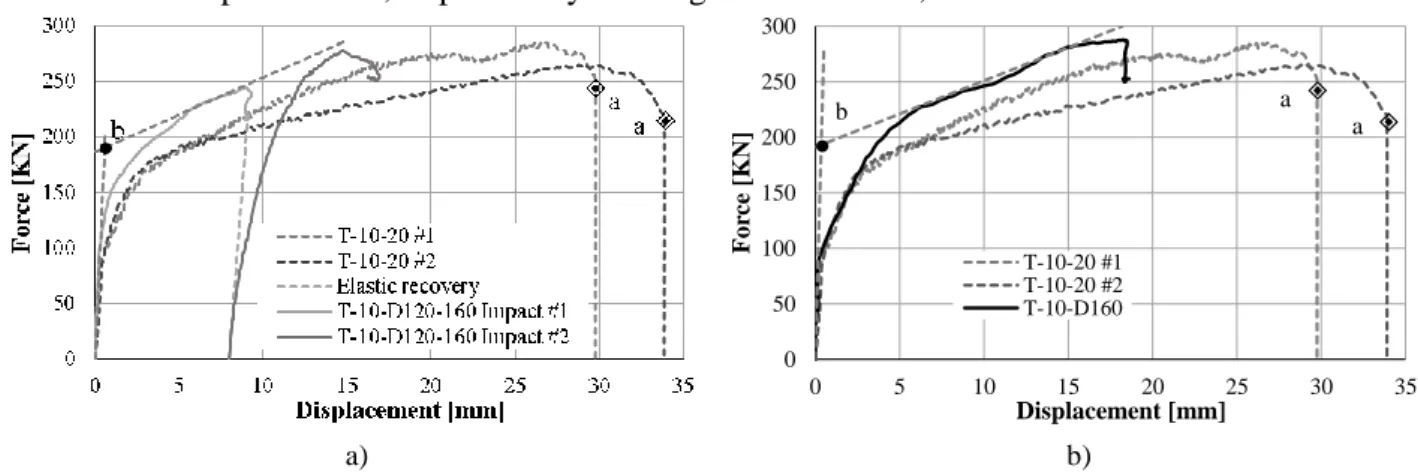
In this section, the force-displacement response of the T-stubs when subjected to impact loading is presented and compared with those obtained from the reference quasi-static tests [6]. The results for the sequential test T-10-D120-160 are presented in Fig. 6; after impact #1, the specimen yields and a plastic resistance of 191 KN is calculated (point b, in Fig. 6a)), which corresponds to an increase of 8 % of the value in the quasi-static reference tests. Concerning the displacements, a maximum displacement of 9 mm for a maximum resistance of 245 KN is measured. Fig. 6b) depicts the corresponding deformed shape. Following, impact #2 is applied: a reduction in the initial stiffness is measured; the resistance remains above the reference tests values, but the maximum displacement is 16 mm, substantially smaller than the 30 mm reached in the reference tests. The final deformed shape of the T-stub is depicted in the Fig. 6c): complete yielding of the flange is observed, but due to the low displacements, no bolt failure occurs. In the reference tests, bolt fracture was occurred after the yielding of the flange (point a, in Fig. 6a)).
Concerning to the test T-10-D160 (single impact), Fig. 7a) compares the force-displacement curves with the reference quasi-static values. The results present a plastic resistance of 192 KN (point b, in
Fig. 7a)) corresponding to an increase of 9% compared with the reference values. The maximum
resistance of the T-stub reached during this test is 287 KN, corresponding to a maximum displacement of 18.21 mm. Again, for the same displacements, impact test yields higher resistances. Fig. 7b) presents the deformed shape of the T-stub after the test; no bolt failure is observed.
-50.0 -40.0 -30.0 -20.0 -10.0 0.0 10.0 20.0 30.0 0 0.05 0.1 0.15 0.2 Ac ce ler ation [m /s 2] Time [s] Non-filtered Af Filtered Af a
a) b) c) Fig. 6. Results of test T-10-D120-160: a) Force-displacement curve; b) after impact #1; c) after impact #2.
a) b)
Fig. 7. T-10-D160 test results: a) Force-displacement curve; b) after test
Fig. 8 compares both quasi-static and impact tests. It is observed that the impact tests reach higher
values of resistance, for lower displacements, than those observed during the reference quasi static tests. Additionally, in the sequential impact test (T-10-D120-160), a slight reduction in the deformation capacity, when compared with the single impact test T-10-D160, is identified. Concerning the stiffness evaluation, in the initial phase of the test, the results for the displacement are no reliable; and in the unloading phase of T-10-D120-160 the measuring of the displacements were not recorded, only the residual displacement (point a in Fig. 8) was measured with a ruler, and of course the values are not very accurate for the stiffness calculation; this evaluation will be made analytically after calibrated the numerical model with these experimental results.
Fig. 8. Force-displacement curves
0 50 100 150 200 250 300 0 5 10 15 20 25 30 35 F or ce [K N] Displacement [mm] T-10-20 #1 T-10-20 #2 T-10-D160 1 b a a 0 50 100 150 200 250 300 0 5 10 15 20 25 30 35 F or ce [K N] Displacement [mm] T-10-20 #1 T-20-20 #2 T-10-D120-160 T-10-D160 Elastic recovery a
3 CONCLUSIONS
This paper describes the features of an experimental system developed to apply high rates of loading, and compares the results from two experimental tests on a welded T-stub component subjected to impact loading with the results obtained from similar specimens under quasi-static reference tests. The results of the tests showed that the system is capable to apply and simulate an impact force in specimens; the shape of the force and acceleration (duration and magnitude) are in accordance with the objectives.
For both impact tests, the results showed an increase of the plastic resistance of the T-stub compared with the values reached under quasi-static loading. Concerning the post-limit phase, the maximum resistances of the T-stub under dynamic loading is higher than those reached in the quasi-static reference tests and are reached for much lower displacements. Comparing both impact tests: sequential impact and single impact, the maximum values of resistance are similar, but it is reached for slight lower displacements in the sequential impact. Finally, in both tests, the mode of failure of the T-stub corresponds to the development of two plastic hinges, and no bolt failure is observed for these small displacements.
The remarks presented in this paper correspond only to the studied specimens; now, this experimental programme is being enlarged to others loading levels and others T-stub geometries, in order to parameterize the final conclusions.
4 ACKNOWLEDGMENT
The authors acknowledge the financial support of the Portuguese Foundation for Science and Technology under the research project PTDC/ECM/110807/2009.
REFERENCES
[1] British Constructional Steelwork, A. and I. Steel Construction, 2002, Joints in steel construction: simple connections, Ascot: Steel Construction Institute.
[2] Jaspart, J.P., 1991, Etude de la semi-rigidite des noeuds poutre-colonne et son influence sur la resistance et la stabilite des ossatures en acier, Ph.D. thesis at University of Liège.
[3] Faella, C., Piluso, V. and Rizzano, G., 1998, Cyclic Behaviour of Bolted Joint Components, Journal of Constructional Steel Research, Vol. 46, pp. 433–434.
[4] CEN, 2005, Eurocode 3: Design of steel structures Part 1-8: Design of joints. Brussels: European Committee for Standardization.
[5] Midterm report, 2011, IMPACTFIRE Project PTDC/ECM/110807/2009.
[6] Barata, P., Santiago, A. And Rodrigues, J. P., 2013, Experimental behaviour of t-stub joint component at
elevated temperatures, 2nd CILASCI, Coimbra, Portugal, pp. 345-354.
[7] CEN, 2006, Eurocode 3: Design of steel structures. Part 1-1: General rules and rules for buildings, Brussels: European Committee for Standardization.
[8] Barata, P., Santiago, A., Rodrigues, J.P, Rigueiro, C., 2014, Development of an Experimental System to
Apply High Rates of Loading, Proceedings XIV Portuguese Conference on Fracture, Régua, Portugal, pp. 123-130.
EUROSTEEL 2014, September 10-12, 2014, Naples, Italy
EXPERIMENTAL ANALYSIS OF A T-STUB COMPONENT SUBJECTED
TO IMPACT LOADING
Pedro Barataa, Aldina Santiagoa, João Paulo C. Rodriguesa, Constança Rigueirob
aISISE - Institute for Sustainability and Innovation in Structural Engineering - University of Coimbra, Portugal
[email protected], [email protected], [email protected]
bISISE – Polytechnic Institute of Castelo Branco, Portugal
KEYWORDS: T-Stub, impact loading, instrumentation, experimental techniques. ABSTRACT
After the accidents occurred during the first decade of this millennium, such as the World Trade Center (2001), London (2005) and Madrid (2004), special attention was given to the study of robust structures subjected to different accidental loads. The World Trade Center attack highlighted troublesome weakness in connections, which exhibited poor performance caused by brittle failure. Structural details played a very significant behavioural role when the structure is subjected to impulsive loads [1].
Concerning the behaviour of steel joint, the literature presents several studies on steel connections under both static and cyclic loads [2, 3]; many results of these studies have contributed for improving the current standards, such as the Eurocode 3, part 1-8 [4]. However, only scarce information exists concerning the behaviour of these joints directly loaded by higher loading rates [5].
This paper is devoted to the report of an experimental programme on steel joints under impact loading, in particular to the assessment of T-stub response under tension. The T-stub is used to evaluate the behaviour of the tensile components that are responsible for the deformability of the joint, such as the end plate in bending. Firstly, the paper describes the features of an experimental system developed at the University of Coimbra, to apply high rates of loading; then, it presents the experimental campaign and the corresponding results.
The test apparatus is defined by a rigid reaction frame fixed to a reaction slab and connected to a rigid “flying beam” (HEM 340, S355J2); the impact force is applied in this beam through a pneumatic driven cylinder ( = 125 mm). This “flying beam” consists in a second class lever pivot located at the opposite end of the cylinder location, and the tested specimen is subjected to the dynamic force at the middle of this beam. The pneumatic cylinder was designed to work with a maximum operating pressure of 30 MPa. During the impact tests, force, displacements, accelerations and strains are measured. Because this type of tests occurs in a very short time intervals (hundredths of a second), specific equipment with large sample rate are used.
The experimental programme includes two impact tests on welded T-stubs: i) test T-10-D120-160 - rapidly applied loading of 120 Bar [12 MPa], followed by 160 Bar [16 MPa]; and ii) test T-10-D160 - rapidly applied loading of a single impact equal to 160 Bar [16 MPa]. The results of these tests are compared against reference quasi-static tests [6]. The T-stub geometry is defined by two plates, the flange and the web, both with 10 mm of thickness and welded by means of a continuous 45º fillet. The flange is bolted through two bolts M20, grade 8.8 fully threaded.
CONCLUSIONS
Firstly, the results of the tests show that the system is capable to apply and simulate an impact force in specimens; the shape of the force and acceleration (duration and magnitude) are in accordance with the objectives.
In fig. 1, the results of the impact tests on welded T-stubs are presented and compared with those obtained from the reference quasi-static tests [6]. The results for the sequential test T-10-D120-160
calculated (point b, in Fig. 1a)), which corresponds to an increase of 8 % of the value in the quasi-static reference tests. Concerning the displacements, a maximum displacement of 9 mm for a maximum resistance of 245 KN is measured. Following, impact #2 is applied: a reduction in the initial stiffness is measured; the resistance remains above the reference tests values, but the maximum displacement is 16 mm, substantially smaller than the 30 mm reached in the reference tests; no bolt failure occurs. In the reference tests, bolt fracture occurred after the yielding of the flange (point a, in Fig. 1a)).
Concerning to the test T-10-D160 (single impact), Fig. 1b) compares the force-displacement curves with the reference quasi-static values. The results present a plastic resistance of 192 KN (point b, in Fig. 1b)) corresponding to an increase of 9% compared with the reference values. The maximum resistance of the T-stub is 287 KN, corresponding to a maximum displacement of 18.21 mm. Again, for the same displacements, impact test yields higher resistances; no bolt failure is observed.
a) b)
Fig. 1 - Force displaceme nt curve for: a) test T -10-D120-160; b) Test T -10 -D160.
The remarks presented in this paper correspond only to the studied specimens; now, this experimental programme is being enlarged to others loading levels and others T-stubs geometries, in order to parameterize the final conclusions.
ACKNOWLEDGMENT
The authors acknowledge the financial support of the Portuguese Foundation for Science and Technology under the research project PTDC/ECM/110807/2009.
REFERENCES
[1] British Constructional Steelwork, A. and I. Steel Construction, 2002, Joints in steel construction: simple connections, Ascot: Steel Construction Institute.
[2] Jaspart, J.P., 1991, Etude de la semi-rigidite des noeuds poutre-colonne et son influence sur la resistance et la stabilite des ossatures en acier, Ph.D. thesis at University of Liège.
[3] Faella, C., Piluso, V. and Rizzano, G., 1998, Cyclic Behaviour of Bolted Joint Components, Journal of Constructional Steel Research, Vol. 46, pp. 433–434.
[4] CEN, 2005, Eurocode 3: Design of steel structures Part 1-8: Design of joints. Brussels: European Committee for Standardization.
[5] Midterm report, 2011, IMPACTFIRE Project PTDC/ECM/110807/2009.
[6] Barata, P., Santiago, A. And Rodrigues, J. P., 2013, Experimental behaviour of t-stub joint component at
elevated temperatures, 2nd CILASCI, Coimbra, Portugal, pp. 345-354.
0 50 100 150 200 250 300 0 5 10 15 20 25 30 35 F or ce [K N] Displacement [mm] T-10-20 #1 T-10-20 #2 T-10-D160 1 b a a