Regulating agro-forest areas for a
sustainable cork harvest
Coelho ANA
1, Cristina ALEGRIA
21
EMPEV - Gestão de Espaços Verdes, Lda.
2
Politechnical Institute of Castelo Branco, School of
Agriculture, Department of Natural Resouces and
Sustainable Development
The aim of this study was to apply the classical methods for forest regulation (Davis & Johnson 1986) in a management unit after fire disturbance.
The area control method combined with the volume control method were used to achieve a sustainable annual cork harvest while regenerating old stands.
Methods
Study area
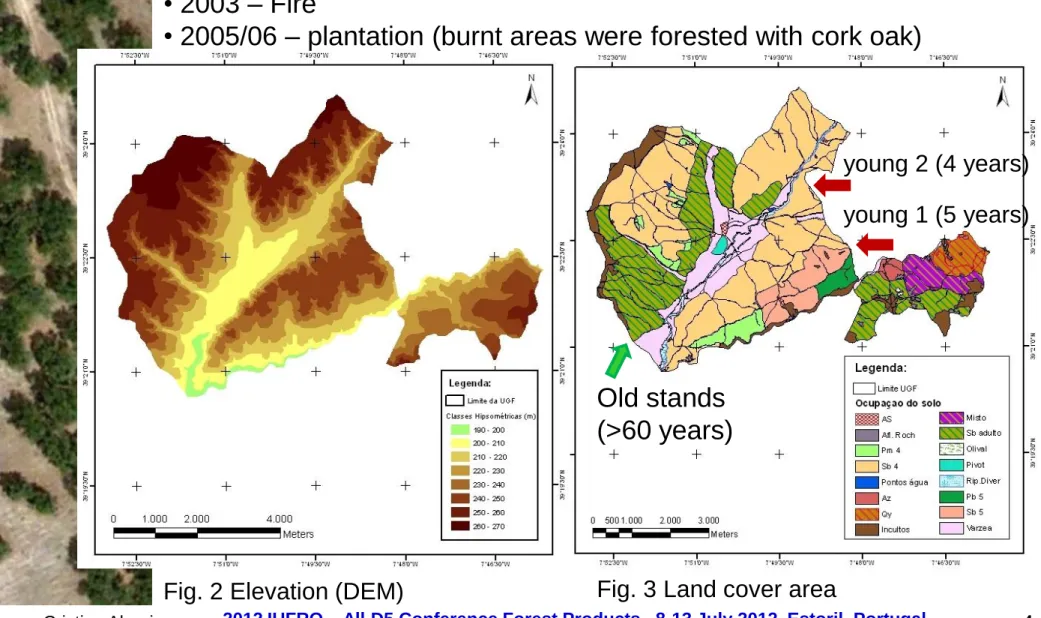
• Located in a Mediterranean region of Portugal. • An agro-forestry management unit ofcork oak partial
affected by fire was considered.
Fig. 3 Land cover area
Old stands (>60 years)
Fig. 2 Elevation (DEM)
• 2003 – Fire
• 2005/06 – plantation (burnt areas were forested with cork oak)
young 2 (4 years) young 1 (5 years)
0 50 100 150 200 250 300 350 400 450 F_1 0 F_ 1 1 F_ 1 2 F_1 3 F_ 1 4 F_1 5 F_ 1 6 F_1 7 F_ 1 8 A re a (h a) Compartiments
Fig. 4 Current compartments (old stands): a) harvest years and areas; b) sample plots (n=12)
• 2010 - Forest inventory (old
stands); support forest
management plan
Field measurements
a) b)
Individual tree growth and yield model Suber v3.0
Fig. 5 Suber model (Tomé et al. 2001)
Cork yield simulation
Cork extraction cycle – nine years
Simulation
along 27 years:
- 1st cycle: 2010-2018
- 2nd cycle: 2019-2027
Area control method
• Management surface (S) • Cork extraction cycle (R) • Annual harvest area (s)
s=S/R
Fig. 6 Compartments - 2010 old
young 2 (4 years)
Harvest and regenerate the same number of ha each year (Davis & Johnson 1986).
New compartment's areas were tied to the ground using a GIS.
young 1 (5 years) Cork stands Areas (ha)
Old 845.82 Young 1 207.08 Young 2 1523.00
Total 2575.90 Table 1 Old and young stands
• Harvest rules
1. Rotation age is 9 years.
2. Area regulation: extract and regenerate one compartment each year. 3. Never harvest before reaching 9 years after previous cork extraction. 4. Never harvest if tree legal dimension (d>22.3 cm) is not verified.
5. Harvest older compartments first. 6. Harvest, then grow.
Current
Old stands (>60 years) Young stands (4-5 years)
1st cycle >69 years 14 years 2nd cycle >78 years 23 years 3rd cycle >87 years 32 years 4th cycle >96 years 41 years Age 110-135 years: final cut
Age 25-35 years: 1st cork extraction (d>22.3 cm)
• Silvicultural prescription (Louro et al. 2000)
Area control and volume control combined
1. Make an area control calculation for the forest to estimate the annual regeneration harvest area.
2. Calculate the average cork yield that would come off these hectares 3. Decide what stands to explore over the next few periods.
4. Draw up a specific budget for the 1st extracting cycle and draw up a
tentative budget for the 2nd cycle.
5. Extract the cork, compare the results to the expectations, and when
the 1st cycle ends, start the analysis all over again (Davis & Johnson
Fig. 7 Current compartments (old stands): harvest years and areas
Current compartments don't allow a sustainable annual cork harvest. 0 50 100 150 200 250 300 350 400 450 F_ 1 0 F_ 1 1 F_ 1 2 F_ 1 3 F_ 1 4 F_ 1 5 F_ 1 6 F_ 1 7 F_ 1 8 A re a (h a) Compartiments current regulated
Results
Area control method
Table 2 New compartments area – 1st cycle (old stands) N_1 N_2 N_3 N_4 N_5 N_6 N_7 N_8 N_9 F_10_1 F_10_2 F_10_2 F_10_3 F_10_4/F_12_1 F_12_1 F_12_2/F_15_1 F_15_2/F_16_1 F_16_2/F_18_1 Compartments Area (ha) 2010 2011 2012 2013 2014 2015 2016 2017 2018 F_10 390.15 93.98 93.98 93.98 93.98 14.23 F_12 201.88 79.75 93.98 28.15 F_15 120.52 65.83 54.69 F_16 85.91 39.29 46.62 F_18 47.36 47.36 Total 845.82 93.98 93.98 93.98 93.98 93.98 93.98 93.98 93.98 93.98
1st cycle - old stands (2010-2018)
S= 845.82 ha R=9 years
Annual harvest area s= 93.98 ha
Sacrifices - extract cork later than 9 years In order to achieve regulation
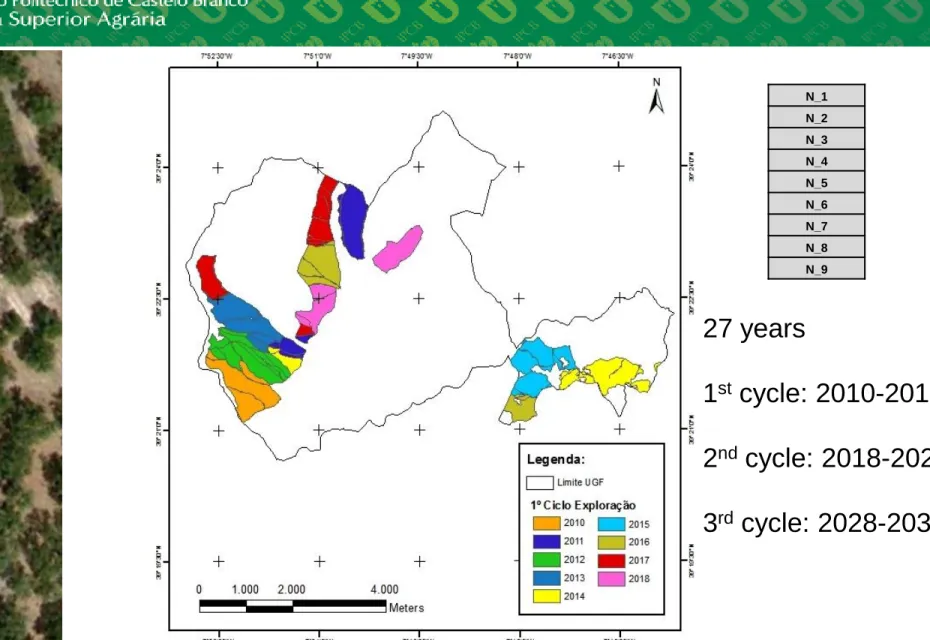
Figure 8. New compartments design – 1st cycle, 2nd cycle and 3rd cycle 27 years 1st cycle: 2010-2018 2nd cycle: 2018-2027 3rd cycle: 2028-2036 N_1 N_2 N_3 N_4 N_5 N_6 N_7 N_8 N_9
4th cycle - old stands plus young stands (2045-2045)
Young stands S= 1730.08 ha
Age around 32 years – ready for the 1st cork extraction
Cork extraction cycle R=9 years
• Young stands annual harvest area s2=192.23 ha
• Total annual harvest area s=s1+s2=286.21 ha • Old stands annual harvest area s1=93.98 ha
Compartments Area (ha) 2037 2038 2039 2040 2041 2042 2043 2044 2045 N_1 93.98 93.98 N_2 93.98 93.98 N_3 93.98 93.98 N_4 93.98 93.98 N_5 93.98 93.98 N_6 93.98 93.98 N_7 93.98 93.98 N_8 93.98 93.98 N_9 93.98 93.98 Old 845.82 93.98 93.98 93.98 93.98 93.98 93.98 93.98 93.98 93.98 Compartments Y1 Y2 Y3 Y4 Y5 Y6 Y7 Y8 Y9 Y1 207.00 192.23 14.77 Y2 1523.04 177.46 192.23 192.23 192.23 192.23 192.23 192.23 192.23 Young 1730.08 192.23 192.23 192.23 192.23 192.23 192.23 192.23 192.23 192.23 Total 2575.90 286.21 286.21 286.21 286.21 286.21 286.21 286.21 286.21 286.21
Figure 9. Compartments (old and young stands) – 4th cycle N_1 N_2 N_3 N_4 N_5 N_6 N_7 N_8 N_9 Y_1 Y_2 Y_3 Y_4 Y_5 Y_6 Y_7 Y_8 Y_9
Table 4 Annual cork harvest - 1st cycle
Cork yield
2010 2011 2012 2013 2014 2015 2016 2017 2018 Cork yield (ton ha-1)
F_10 2.28 2.28 2.31 2.44 2.51 F_12 2.45 2.43 2.37 F_15 2.23 2.24 F_16 2.26 2.69 F_18 2.12 Area (ha) F_10 93.98 93.98 93.98 93.98 14.23 F_12 79.75 93.98 28.15 F_15 65.83 54.69 F_16 39.29 46.62 F_18 47.36
Total cork yield (ton)
214.26 214.71 217.14 229.01 231.21 227.96 213.68 211.26 225.58
Annual cork harvest is quite stable in the 1st cycle.
In both 2nd cycle and 3rd cycle:
- increasing tendency - more variability
Fig. 10 Annual cork harvest
0 50 100 150 200 250 300 350 400 2010 2011 2012 2013 2014 2015 2016 2017 2018 2019 2020 2021 2022 2023 2024 2025 2026 2027 2028 2029 2030 2031 2032 2033 2034 2035 2036 C o m p a rt m e n ts co rk yi e ld ( to n ) years
Table 5 Inventory data in 2010 Compartments N (trees.ha-1) Crown area (%) Average diameter (cm) F_10 75 37 31.6 F_12 47 28 47.3 F_15 70 49 36.2 F_16 105 52 33. 7 F_18 45 20 44.0 Old stands:
- very low stand densities - problems of tree vitality
- near final cut age (100-135 years)
• Restore density around 100-150 trees per hectare in order to obtain a crown occupation between 40-60% (Louro et al. 2000).
In the 4th cycle - an increase in annual cork harvest is expected
old stands + young stands
It makes possible planning old stands regeneration/renovation without great loss of previous annual cork production.
Discussion
• The area control method was applied to fully regulate the existing old cork stands.
• New compartments for old stands were designed in a GIS.
• These new compartments will fulfill this goal for the next 27 years.
• Annual cork harvest was quite stable in the 1st cycle.
• More reliable cork yield simulation for the next two following cycles is expected to be achieved with updated inventory data after each cycle. • Young stands inventory should also be promoted.
• Planning must be re-evaluated with the updated inventory data.
• Simulated cork yield and cork selling prices should also be considered in forest regulation analysis.
• After the 27 years, it is expected that young cork stands will be ready
for the 1st cork extraction.
• The area control method was again applied to fully regulate the young cork stands.
• New compartments for young stands were added in a GIS.
• In the 4th cycle both old and young stands will be in production.
• Good opportunity for planning old stands regeneration/renovation without great loss of previous annual cork production.
• This strategy will make possible to achieve cork oak areas sustainability while regenerating/renovating old stands.
• The area control method and volume control method combined was also essayed and an increasing yield was obtained.
Our participation was
supported by
Centro de Estudos de Recursos Naturais, Ambiente e Sociedade