EUROPEAN ORGANIZATION FOR NUCLEAR RESEARCH (CERN)
CERN-PH-EP/2013-037 2015/05/04
CMS-SMP-13-014
Measurement of the Zγ production cross section in pp
collisions at 8 TeV and search for anomalous triple gauge
boson couplings
The CMS Collaboration
∗Abstract
The cross section for the production of Zγ in proton-proton collisions at 8 TeV is mea-sured based on data collected by the CMS experiment at the LHC corresponding to an integrated luminosity of 19.5 fb−1. Events with an oppositely-charged pair of muons or electrons together with an isolated photon are selected. The differential cross sec-tion as a funcsec-tion of the photon transverse momentum is measured inclusively and exclusively, where the exclusive selection applies a veto on central jets. The observed cross sections are compatible with the expectations of next-to-next-to-leading-order quantum chromodynamics. Limits on anomalous triple gauge couplings of ZZγ and Zγγ are set that improve on previous experimental results obtained with the charged lepton decay modes of the Z boson.
Published in the Journal of High Energy Physics as doi:10.1007/JHEP04(2015)164.
c
2015 CERN for the benefit of the CMS Collaboration. CC-BY-3.0 license
∗See Appendix A for the list of collaboration members
1
1
Introduction
The study of Zγ production in proton-proton (pp) collisions at TeV energies represents an im-portant test of the standard model (SM), which prohibits direct coupling between the Z bo-son and the photon. Within the SM Zγ production is primarily due to radiation of photons from initial-state quarks (ISR) or final-state leptons (FSR). However, new physics phenomena at higher energies may be manifested as an effective self-coupling among neutral gauge bosons, resulting in a deviation from their predicted zero values in the SM. Models of anomalous triple gauge couplings (aTGC) have been introduced and discussed in Refs. [1–3].
This paper presents a measurement of Zγ production in pp collisions at a center-of-mass en-ergy of 8 TeV, based on data collected with the CMS experiment in 2012, corresponding to an integrated luminosity of 19.5 fb−1. For this analysis the decays of the Z boson into a pair of muons (µ+µ−) or electrons (e+e−) are considered. The processes of ISR and FSR contribute to
`+`−γ(` =µ, e) production in the SM at leading order (LO), and these are exemplified by the first two Feynman diagrams in Fig. 1. Photons can also be produced by jet fragmentation, but these photons are not considered as signal in the present analysis and are strongly suppressed by requiring that the photon is isolated. The production of Zγ through triple gauge couplings is represented by the third diagram in Fig. 1.
Both ATLAS and CMS Collaborations have presented measurements of the inclusive Zγ cross section and searches for anomalous ZZγ and Zγγ couplings using data collected at a center-of-mass energy of 7 TeV [4, 5]. The larger 2012 data sample and the increased cross section at 8 TeV allow for the first measurement of the inclusive differential cross section for Zγ produc-tion as a funcproduc-tion of the photon transverse momentum pγ
T. Results on the differential Zγ cross
section for events with no accompanying central jets, referred to as exclusive cross sections, are also presented, providing some insight into the effect of additional jets on the distribution of pγ
T. The cross sections are measured for photons with p
γ
T > 15 GeV and restricted to a phase
space defined by kinematic requirements on the final-state particles that are motivated by the experimental acceptance. In addition, the photon is required to be separated from the leptons by∆R(`, γ) > 0.7 where∆R =
√
(∆φ)2+ (∆η)2, φ is the azimuthal angle and η the pseudo-rapidity. Furthermore, the dilepton invariant mass is required to be above 50 GeV. With this selection the fraction of FSR photons is reduced and photons originating from ISR or aTGCs are dominant. q ¯ q γ l− l+ Z/ γ∗ q ¯ q Z/ γ∗ l− γ l+ q ¯ q Z/ γ∗ γ l− l+ Z
Figure 1: Leading-order Feynman diagrams for Zγ production in pp collisions. Left: initial-state radiation. Center: final-initial-state radiation. Right: diagram involving aTGCs that are forbid-den in the SM at tree level.
2 3 Signal and background modeling
2
The CMS detector and particle reconstruction
The central feature of the CMS apparatus is a superconducting solenoid of 6 m internal diam-eter, providing a magnetic field of 3.8 T. Within this superconducting solenoid volume are a silicon pixel and strip tracker, a lead tungstate crystal electromagnetic calorimeter (ECAL), and a brass and scintillator hadron calorimeter (HCAL), each composed of a barrel and two endcap sections. Muons are measured in gas-ionization detectors embedded in the steel flux-return yoke outside the solenoid. Extensive forward calorimetry complements the coverage provided by the barrel and endcap detectors.
The silicon tracker measures charged particles within the pseudorapidity range|η| < 2.5. The ECAL provides coverage in pseudorapidity |η| < 1.479 in a barrel region (EB) and 1.479 <
|η| <3.0 in two endcap regions (EE). A preshower detector consisting of two planes of silicon sensors interleaved with a total of three radiation lengths of lead is located in front of the EE re-gions. Muons are measured in the pseudorapidity range|η| <2.4, with detection planes made using three technologies: drift tubes, cathode strip chambers, and resistive-plate chambers. The particle-flow (PF) algorithm [6–8] reconstructs and identifies each particle with an op-timized combination of all subdetector information and categorizes reconstructed objects as photons, muons, electrons, charged hadrons, and neutral hadrons. The energy of photons is obtained from a cluster of energy depositions in ECAL crystals. The photon direction is deter-mined by assuming it is associated to the main interaction vertex, defined as the vertex that has the highest value for the sum of p2Tof the associated tracks that is also compatible with the beam interaction point. The energy of electrons is determined from a combination of the track momentum at the main interaction vertex, the ECAL cluster energy, and the energy sum of all bremsstrahlung photons attached to the track [9, 10]. The energy of muons is obtained from the corresponding track momentum measured in the silicon tracker and the muon detection system. The energy of charged hadrons is determined from a combination of the track momen-tum and the corresponding ECAL and HCAL energies. Finally, the energy of neutral hadrons is obtained from the corresponding ECAL and HCAL energies.
Jets used for the exclusive measurement presented in this paper are reconstructed from PF objects, clustered by the anti-kT algorithm [11, 12] with a distance parameter of 0.5. The
mea-sured jet momentum is the vectorial sum of all particle momenta in the jet and is found from the simulation to be within 5–10% [13] of the initial jet momentum over the whole pT range
and detector acceptance. An offset correction is applied to take into account the extra energy clustered in jets due to additional pp interactions within the same bunch crossing (pileup) [14]. A more detailed description of the CMS detector, together with a definition of the coordinate system used and the relevant kinematic variables, can be found in Ref. [15].
3
Signal and background modeling
Simulation samples for the signal process, `+`−γ+n partons (n = 0, 1, 2) at matrix element level are produced with the event generatorSHERPA1.4 [16] for the muon and electron channels separately. The cross sections are calculated at next-to-leading order (NLO) in quantum chro-modynamics (QCD) usingMCFM6.4 [17] and the CT10 [18] parton distribution functions (PDF).
Additional PDF sets are provided by CT10 to represent the uncertainties in the PDFs. These are used to estimate the PDF uncertainties in the cross sections following the prescription in Ref. [19]. The effect of using the CT10 PDF sets, where the value of the strong coupling con-stant αs is varied in the fit, has been studied and is considered as an additional uncertainty.
3
The uncertainties from factorization, renormalization, and photon fragmentation scales are es-timated by varying each of these scales up and down by a factor of two. The uncertainty in the exclusive cross section calculation is obtained by following the recommendation in Ref. [20] of adding in quadrature the scale uncertainties of the`+`−
γNLO and the`+`−γ+1 parton LO calculations. We also compare the measurement with a next-to-next-to-leading-order (NNLO) calculation of the inclusive cross section provided by Ref. [21].
The major sources of background to the Zγ process are Drell–Yan (DY) + jets, WW, WZ, ZZ, and tt production. These are simulated with the MADGRAPH4 [22] matrix element generator, using the CTEQ6L PDF set [23], and interfaced withPYTHIA 6.4.26 [24] to describe parton showers, fragmentation, and initial and final state radiation of photons. The cross sections for tt and diboson production are normalized to the NLO QCD calculation from MCFM. The DY+jets
sample is normalized to the NNLO QCD calculation of FEWZ [25]. It is used to describe the background of nonprompt and misidentified photons. All events containing a prompt photon that passes the signal requirements are removed from this sample. The QCD simulation, which is used for the background determination, is produced usingPYTHIA. All samples are passed through a detailed simulation of the CMS detector based on GEANT4 [26] and reconstructed using the same algorithms as used for data.
4
Event selection
The measurements presented in this paper rely on the reconstruction and identification of iso-lated muons, electrons, and photons. The exclusive cross section measurement is also depen-dent on the reconstruction of jets. Details of the idepen-dentification and selection of muons (electrons) can be found in Ref. [27] (Ref. [28]).
Leptons from Z boson decays are typically isolated, i.e., separated in∆R from other particles. A requirement on the lepton isolation is used to reject leptons produced in decays of hadrons. The muon isolation is based on tracks from the main interaction vertex as this is always iden-tified as the source of the lepton pair. The isolation variable Itrk is defined as the pT sum of
all tracks except for the muon track originating from the main interaction vertex within a cone of ∆R(µ, track) < 0.3. The value of Itrk is required to be less than 10% of the muon pT. For
electrons the isolation variable is the pTsum of neutral hadrons, charged hadrons, and
photon-like PF objects in a cone of∆R < 0.3 around the electron. Contributions of the electron to the isolation variables are suppressed using a veto region. This isolation variable is required to be smaller than 10% (15%) of the electron pT for electrons in the EB (EE). An event-by-event
correction is applied, which keeps the selection efficiency constant as a function of pileup in-teractions [29].
Quality selection criteria are applied to the reconstructed photons to suppress the background from hadrons misidentified as photons. The ratio of the energy deposition in the HCAL tower behind the ECAL cluster to the energy deposition in the ECAL has to be below 5%. The back-ground is further suppressed by a requirement on the shower shape variable σηη [30], which
measures the shower width along the η direction in a 5×5 matrix of crystals centered on the crystal of highest energy in the cluster. The electromagnetic shower produced by a photon is expected to have a small value of σηη. Therefore, a selection of σηη < 0.011 (0.033) in the EB
(EE) region is applied. To suppress electrons misidentified as photons, photon candidates are rejected if measurements in the silicon pixel detector are found and these measurements are consistent with an electron, which is incident on the ECAL at the location of the photon cluster. The isolation variables based on PF charged hadrons Ic, neutral hadrons In, and photon objects
4 5 Background estimation
photon itself are suppressed using a veto region. Again, the isolation values are corrected for the average energy deposition due to pileup. The isolation requirements used in the EB region are In < 1.0+0.04pγT, Iγ < 0.7+0.005p
γ
T, and Ic < 1.5. In the EE region In < 1.5+0.04p
γ
T,
Iγ <1.0+0.005p γ
T, and Ic <1.2 are required.
Events are selected online using a dimuon or dielectron trigger with thresholds of pT>17 GeV
for the leading and pT > 8 GeV for the subleading lepton. Candidate events are required to
have two same-flavor opposite-charge selected leptons and a selected photon. Muons with
|η| < 2.4 relative to the main interaction vertex are selected, while electrons need to satisfy
|ηSC| <1.44 or 1.57< |ηSC| <2.5, where ηSCis determined by the cluster position in the ECAL
with respect to the center of the CMS detector. This excludes the transition region between EB and EE. The pT of each lepton has to be greater than 20 GeV, and the dilepton mass M`` is
required to be greater than 50 GeV. At least one photon candidate with pγT >15 GeV is required. The η range for photons is determined by the coverage of the ECAL and the silicon tracker and is the same as for electrons. The minimum distance between the photon and the leptons must be∆R(`, γ) > 0.7. In the very rare cases when a second photon is reconstructed, the photon with the higher pγ
Tis used for the differential cross section measurement.
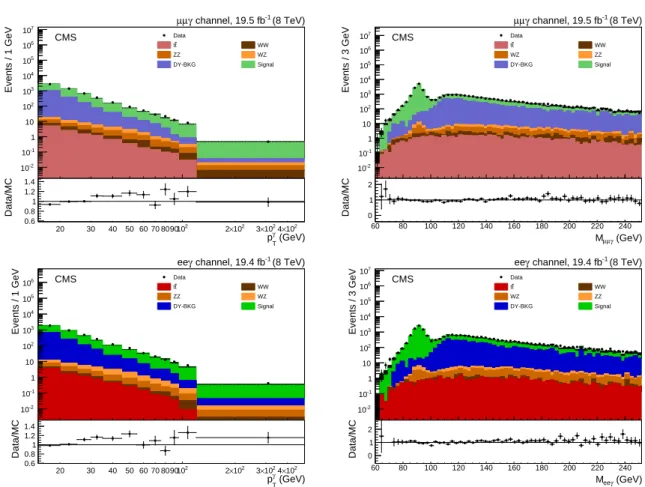
A tag-and-probe method, similar to that presented in Ref. [31], is used to measure the lepton reconstruction efficiencies. The photon reconstruction efficiency is determined with a modi-fied tag-and-probe method that makes use of the Z boson mass peak in the Mµµγ distribution
for FSR photons. Scale factors are obtained from the measured efficiencies to correct the sim-ulation. In Fig. 2 the observed pγT distribution and the invariant mass of the two leptons and the photon candidate M``γ are compared to the SM expectation. The level of agreement is
discussed in Section 5.
5
Background estimation
The dominant background for this measurement is DY+jets containing nonprompt photons, e.g., through π0 or η decays, or hadrons misidentified as photons. A template method is used to estimate this background from data. This method relies on the power of an observable to discriminate between signal photons and background. The signal yield is obtained from a maximum-likelihood fit to the observed distribution of such an observable using the known distributions (“templates”) for signal photons and background.
The cross sections are measured with two different template observables. One template method uses the shower shape variable σηη. The separation between the two photons from the decay of
light particles such as π0, albeit small, leads to a larger σηη value than for single photons. The
shower width of strongly interacting particles that mimic a photon signature also tends to be larger.
The other template observable is Iγ,nfp, which is the pT sum of all PF photon objects in a cone
of ∆R < 0.4 around the photon. The abbreviation “nfp” stands for “no footprint of the pho-ton” and indicates the removal of energy associated with the photon from the isolation vari-able. This energy is removed by excluding all particles whose ECAL clusters overlap with the photon cluster from the isolation variable. This makes Iγ,nfp, and hence the signal template,
independent of pγT. Since the background particles are often produced in cascade decays, Iγ,nfp
5.1 Extraction of signal and background templates 5 (GeV) γ t p 2 10 Events / 1 GeV -2 10 -1 10 1 10 2 10 3 10 4 10 5 10 6 10 7 10 Data t t WW ZZ WZ DY-BKG Signal (8 TeV) -1 channel, 19.5 fb γ µ µ CMS (GeV) γ T p 20 30 40 50 60 70 8090102 2×10² 3×1024×102 Data/MC 0.6 0.8 1 1.2 1.4 (GeV) µ µ γ M 60 80 100 120 140 160 180 200 220 240 Events / 3 GeV -2 10 -1 10 1 10 2 10 3 10 4 10 5 10 6 10 7 10 Data t t WW WZ ZZ DY-BKG Signal (8 TeV) -1 channel, 19.5 fb γ µ µ CMS (GeV) γ µ µ M 60 80 100 120 140 160 180 200 220 240 Data/MC 0 1 2 (GeV) γ t p 2 10 Events / 1 GeV -2 10 -1 10 1 10 2 10 3 10 4 10 5 10 6 10 Data t t WW ZZ WZ DY-BKG Signal (8 TeV) -1 channel, 19.4 fb γ ee CMS (GeV) γ T p 20 30 40 50 60 70 8090102 2×10² 3×1024×102 Data/MC 0.6 0.8 1 1.2 1.4 (GeV) ee γ M 60 80 100 120 140 160 180 200 220 240 Events / 3 GeV -2 10 -1 10 1 10 2 10 3 10 4 10 5 10 6 10 7 10 Data t t WW WZ ZZ DY-BKG Signal (8 TeV) -1 channel, 19.4 fb γ ee CMS (GeV) γ ee M 60 80 100 120 140 160 180 200 220 240 Data/MC 0 1 2 Figure 2: Left: pγ
T distribution after the full event selection compared to the SM prediction.
Right: the distribution of the invariant mass M``γ. The mass distribution has a peak at the
Z boson mass, which arises from FSR photons. Events with ISR photons appear in the large tail above the Z boson mass where a large fraction of background is expected. The displayed uncertainties include only the statistical uncertainties in data and simulated samples.
5.1 Extraction of signal and background templates
The signal templates for both template variables are taken from data. A sample of photons with a background contamination of less than 1% is obtained from FSR Zγ events. About 23 thou-sand photon candidates close to one of the leptons, with 0.3<∆R(`, γ) <0.8, are selected. The minimum separation is chosen to reduce the influence of the lepton on the template variables. The invariant dilepton mass is selected to be between 40 and 80 GeV. One lepton is required to have a pT >30 GeV while for the other lepton only pT >10 GeV is required. All photon quality
requirements are applied except for σηη, which cannot be used in the photon selection for the
σηηtemplate method. For the Iγ,nfptemplate method the selection on Iγis not applied since the
two variables are strongly correlated.
Different templates are chosen for the EB and EE regions, as well as for the lower pγ
Tbins of the
cross section measurement. Due to the limited number of photons a common template is used for pγ
T >35 GeV. The uncertainties in the signal templates are discussed in Section 5.2.
For the background templates it is almost impossible to find a sample of nonprompt or misiden-tified photons that is free of signal-like prompt photons. Therefore, we choose a jet data sam-ple where such background objects are enhanced. From this samsam-ple events with two leading hadronic jets with pT > 30 GeV and no isolated muon or electron are selected. Additionally,
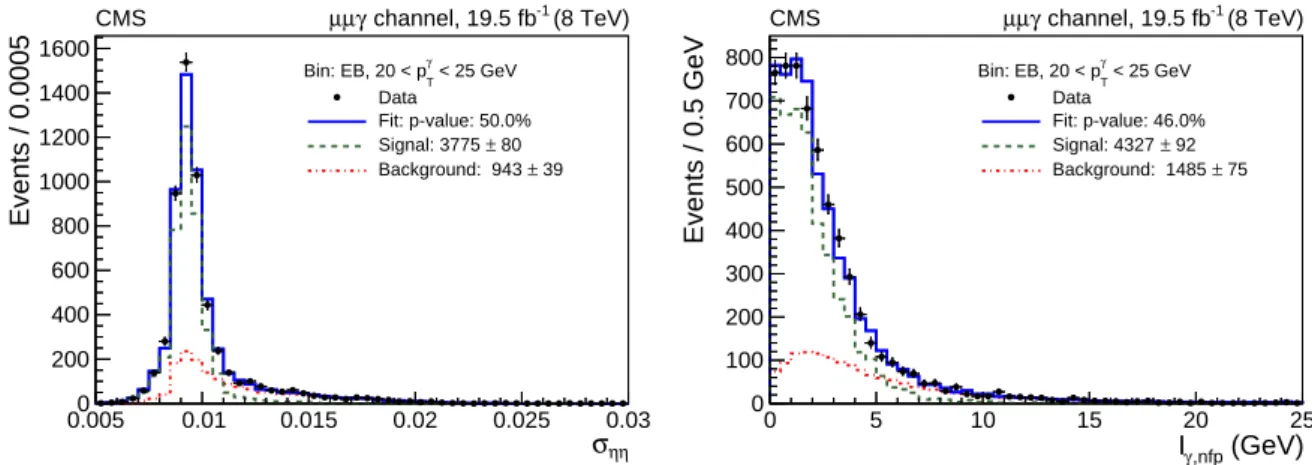
6 5 Background estimation η η σ 0.005 0.01 0.015 0.02 0.025 0.03 Events / 0.0005 0 200 400 600 800 1000 1200 1400 1600 < 25 GeV γ T Bin: EB, 20 < p Data Fit: p-value: 50.0% 80 ± Signal: 3775 39 ± Background: 943 (8 TeV) -1 channel, 19.5 fb γ µ µ CMS (GeV) ,nfp γ I 0 5 10 15 20 25 Events / 0.5 GeV 0 100 200 300 400 500 600 700 800 γ < 25 GeV T Bin: EB, 20 < p Data Fit: p-value: 46.0% 92 ± Signal: 4327 75 ± Background: 1485 (8 TeV) -1 channel, 19.5 fb γ µ µ CMS
Figure 3: Fits of the σηηtemplates (left) and the Iγ,nfptemplates (right) to the data for 20< p γ
T <
25 GeV in the EB region. The extracted signal contributions are indicated by the green curves and the background contributions by the red ones.
Kinematic distributions of the jets and the photon candidates as well as the distributions of the photon selection variables in the jet data sample are well described by the QCD simulation. This agreement allows us to establish a selection of photon candidates for the background tem-plate using the QCD simulation and to apply the same selection on the jet data sample. This se-lection is required to be dominated by nonprompt and misidentified photon candidates whose template shape is in agreement with the background template prediction from the DY+jets sim-ulation. When defining the selection for the σηη background template, the photon candidates
in the QCD simulation have to pass the full selection except for the requirements on σηηand Ic.
Starting from this preselection, the lower and upper boundaries on Ic are varied until a
selec-tion is found for which the template shape agrees with that in the DY+jets simulaselec-tion. Once the selection is defined, it is applied to the jet data sample to obtain the σηη background template
that is used for the signal extraction.
The same method is used to find an Iγ,nfpbackground template. In this case, the photon
prese-lection in the QCD simulation does not include the requirements on σηη and Iγ. Here the lower
and upper boundaries on σηηare varied to find an appropriate selection for a Iγ,nfpbackground
template.
We use these methods to obtain background templates from the data for the various pγ
T bins
in the EB and EE regions. The two different, almost uncorrelated, template variables are used for the cross section measurement and their results are compared. The methods rely on the DY+jets simulation, which is used to find the optimal background template selections. Hence, the agreement of the two methods provides an important consistency check. The uncertainties in these methods are discussed in Section 5.2.
5.2 Signal extraction
Using the templates obtained from the procedure described above the number of signal events is extracted in twelve pγ
Tbins, separately for the EB and EE. Examples of these binned
maximum-likelihood fits are shown in Fig. 3. For the σηηtemplate method the σηηrequirement of the
pho-ton selection is applied after the fit. For the Iγ,nfp template method the selection on Iγ cannot
be applied on the binned data after the fit. Consequently, the photon selection efficiencies are different for the two methods. Therefore, we should not expect the same number of signal and background events before corrections for the efficiencies are applied.
7
The following sources of uncertainties are considered for the signal extraction:
• The statistical uncertainty in the signal templates due to the limited number of FSR photons available in data results in an uncertainty of 0.5–2% (EB) and 0.5–9% (EE) in the extracted signal yield that increases from low to high pγT.
• The systematic uncertainty in the signal templates due to contamination of the FSR sample and the usage of a common template for all bins with pγT > 35 GeV is esti-mated using the simulation. The uncertainties are 0.5–3% (EB) and 0.5–12% (EE) in the signal yield increasing from low to high pγ
T.
• The number of events available in the DY+jets simulation that are used to find the appropriate selection for the background templates is low, especially in bins at high pγ
T. The uncertainty in the extracted signal yield due to this limited sample size is
0.6–3% (EB) and 1.6–5% (EE) increasing from low to high pγT.
• The agreement of the QCD simulation and jet data sample is essential for the back-ground template determination. We evaluate the uncertainty due to this imperfect modeling by calculating the standard deviation of the difference between the sig-nal fraction obtained with template fits in data and simulation for a large number of different background template selections each defined by certain lower and up-per boundaries on the template selection variable, Ic for the σηη templates and σηη
for the Iγ,nfp templates. For data the background templates are taken from the jet
data sample and for simulation from the QCD simulation sample. The uncertainty is estimated to be 0.3–6% (EB) and 3–6% (EE) increasing from low to high pγT.
• The statistical uncertainty in the signal yield obtained from the template fit is very similar for the two methods and amounts to 2–9% (EB) and 3–14% (EE) increasing from low to high pγ
T.
Additionally, we have to consider the small fraction of irreducible background events from tt, ZZ, ZW, and WW production. These background yields are estimated from the SM simulation and subtracted from the pγT distribution of signal candidates. At low pγT this contribution is negligible compared to the background from nonprompt or misidentified photons. At higher pγ
T the fraction of irreducible background events is less than 4%, which is small compared
to the overall uncertainty of the measurement. Since these backgrounds are very small their uncertainties have a negligible effect on the measurement.
6
Cross section measurement
We measure the cross section for a phase space region that corresponds closely to that used for the event selection. This phase space is defined by several kinematic requirements on the final-state particles: the leptons from the Z boson decay need to satisfy pT > 20 GeV and|η| < 2.5, and the dilepton mass has to be greater than 50 GeV. The photon is required to have|η| <2.5 and needs to be separated from both leptons by ∆R(`, γ) > 0.7. Finally, a requirement is put on the photon isolation at the generator level Igen < 5 GeV to exclude photons from jet
fragmentation. The isolation variable uses a cone size of ∆R < 0.3 and sums the transverse momentum of partons in the case ofMCFMand of final-state particles in the case ofSHERPA. It has been verified withSHERPA that photons that do not pass the Igenselection also fail to pass
the photon selection at the detector level. The definition of the phase space for the cross section measurements is summarized in Table 1.
sig-8 6 Cross section measurement
nal events involves two steps. First, we extract the number of events produced in each pγ
T bin
within a phase space defined by the requirements in Table 1 and the additional experimental requirements on η and ηSC as described in Section 4. The number of observed signal events
needs to be corrected for detector effects. These include efficiencies as well as bin migrations due to resolution and energy calibration. Both effects are treated using unfolding techniques. For the unfolding the method of D’Agostini [32], as implemented in the ROOUNFOLD [33] software package, is used. The response matrices are obtained from the signal simulation. A different response matrix is required for the two template methods because of the different photon selections. After the unfolding, compatible signal yields are obtained with the two template methods. Bias and variance of the unfolding procedure are estimated using pseudo-experiments. The uncertainties in the unfolding are 1% at low pγ
T increasing up to 6% for the
high-pγ
T bins. To estimate the effect of the uncertainties in the photon energy scale and
resolu-tion, the unfolding of the data is repeated varying the photon energy scale and resolution in the response matrix within one standard deviation. The observed effect on the unfolded event yield is about 2.4% and is almost independent of pTγ.
The second step is to extrapolate the unfolded event yield in each pγ
T bin to the desired phase
space taking into account the detector acceptance, which is calculated usingMCFM(NLO) and verified withSHERPA. About 92% of the muon channel events and 87% of the electron channel
events are within the detector acceptance. These values are only slightly pγ
Tdependent.
Table 1: Phase space definition of the Zγ cross section measurements. Cross section phase space
M``>50 GeV
∆R(`, γ) >0.7
photon: |η| <2.5, Igen <5 GeV
leptons: |η| <2.5, pT >20 GeV
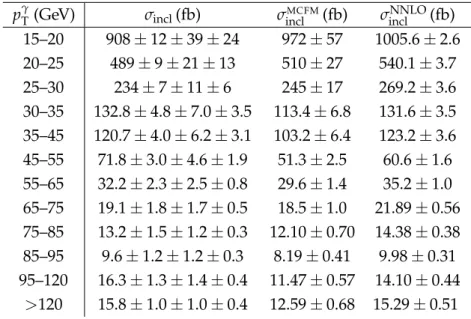
6.1 The inclusive cross section
The cross sections are calculated from the unfolded number of signal events Niand the detector
acceptance Ai in each pγT bin using the relation σi = Ni/(AiL)with an integrated luminosity
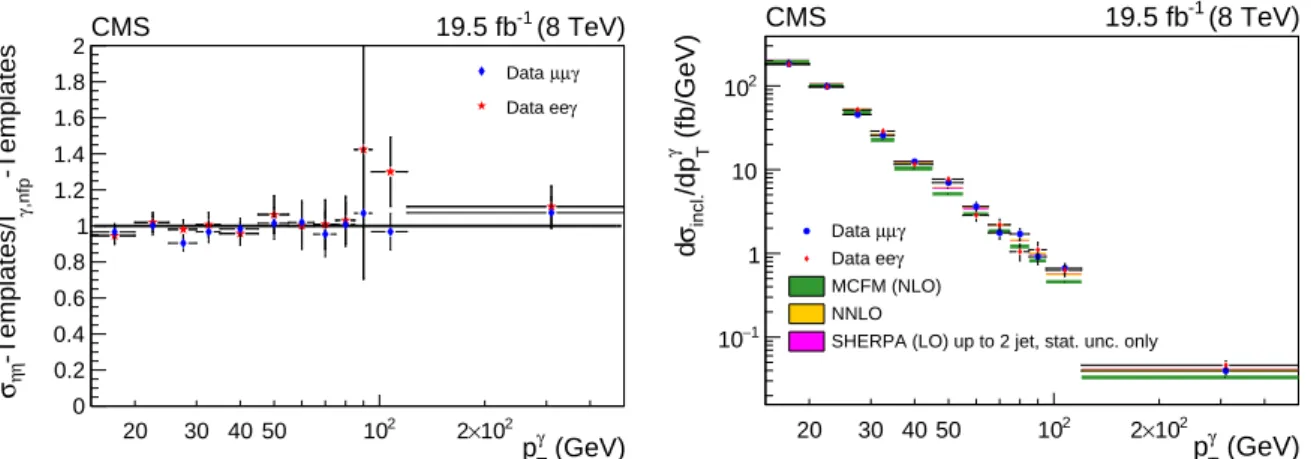
of L = 19.5±0.5 fb−1 for the muon channel and L = 19.4±0.5 fb−1 for the electron channel. The cross section values obtained with the two template methods are compatible within their uncertainties as shown in Fig. 4 (left). The correlation between the template variables σηη and
Iγ,nfpis less than 30%. The compatibility of the two results is a good indication that the
back-ground estimation is correct. The correlation of 30% is also assumed for the uncertainties in the background subtractions with the two template methods. All other uncertainties, i.e., in the dilepton (2%) and photon (2%) efficiencies, the photon energy scale and resolution (2.4%), unfolding (1–6%), luminosity (2.6%), and statistical uncertainties are assumed to be 100% cor-related between the two template methods. Since the two template methods show good agree-ment, the results are combined using the best linear unbiased estimator (BLUE) method [34], which takes into account the correlation of all uncertainties.
The combined results of the two template methods for the muon and the electron channels are, as expected from lepton universality, fully compatible as presented in Fig. 4 (right). For pTγ > 15 GeV inclusive cross sections of 2066±23 (stat)±97 (syst)±54 (lumi) fb and 2087±
6.2 The exclusive cross section 9 (GeV) γ T p 20 30 40 50 102 2×10² -Templates ,nfp γ -Templates/I ηη σ 0 0.2 0.4 0.6 0.8 1 1.2 1.4 1.6 1.8 2 γ µ µ Data γ Data ee (8 TeV) -1 19.5 fb CMS (GeV) γ T p 20 30 40 50 102 2×10² (fb/GeV) γ T /dp incl. σ d 1 − 10 1 10 2 10 γ µ µ Data γ Data ee MCFM (NLO) NNLO
SHERPA (LO) up to 2 jet, stat. unc. only
(8 TeV)
-1
19.5 fb CMS
Figure 4: Left: ratio of the inclusive cross sections as obtained with the two template methods. Right: measured differential cross sections for the muon and electron channels using a com-bination of the two template methods compared to the NNLO [21], theMCFM(NLO) and the
SHERPASM predictions. The last bin is computed for the interval 120–500 GeV.
30 (stat)±104 (syst)±54 (lumi) fb are measured for the muon and electron channels, respec-tively. The cross sections are combined using the BLUE method [34], assuming that the sys-tematic uncertainties between the two lepton channels are highly correlated, since the signal yields are extracted using the same template shapes. The combined cross sections for the two channels are given in Table 2 and shown as the differential cross section in Fig. 5. It is compared to the MCFM(NLO), the NNLO, and the SHERPA predictions. For pγT > 15 GeV the inclusive
cross section is measured to be
σincl =2063±19 (stat)±98 (syst)±54 (lumi) fb.
This is in good agreement with theMCFMprediction of σMCFM
incl = 2100±120 fb and the NNLO
calculation [21] of σNNLO
incl = 2241±22 (scale only) fb. However, the ratio plot in Fig. 5 shows
that at high pTγ the measurement is better described by the NNLO calculation and bySHERPA
than byMCFM. TheSHERPAcalculation includes up to two partons in the matrix element which leads to a significant enhancement at high pγT.
6.2 The exclusive cross section
To understand the effect of additional jets a measurement of the exclusive cross section is per-formed for Zγ production without any accompanying jet with pT >30 GeV and|η| <2.4. The high instantaneous luminosity in the 2012 run requires that special care must be taken to reduce the contribution from jets produced in pileup interactions. About 50% of these jets can be rejected by requiring a maximal pT fraction of charged particles in a jet originating
from a pileup vertex. Further corrections are needed to account for the remaining contribution from pileup jets and jet reconstruction inefficiencies. The jet reconstruction efficiencies and jet misidentification rates for each pγ
Tbin are taken from the simulation where the jet
misidentifica-tion rate considers all jets that cannot be matched to a jet from the main interacmisidentifica-tion at generator level. These are used to calculate the number of exclusive events from the measured number of inclusive events and the measured number of events with zero reconstructed jets. The latter are determined with the same methods used for the extraction of the inclusive signal yield. The uncertainties in the cross section due to pileup and jet energy scale are evaluated to be 1% and 2.5% respectively.
10 6 Cross section measurement
(GeV)
γ Tp
20 30 40 50 102 2×10²(fb/GeV)
γ T/dp
incl.σ
d
1 − 10 1 10 2 10 γ , ee γ µ µ Data combined: MCFM (NLO) NNLOSHERPA (LO) up to 2 partons, stat. unc. only
(8 TeV)
-119.5 fb
CMS
(GeV)
γ Tp
20 30 40 50 102 2×10²)
γ T/dp
NNLO incl.σ
) / (d
γ T/dp
incl.σ
(d
0.6 0.8 1 1.2 1.4 1.6 1.8 2 γ , ee γ µ µ Data combined: NNLO MCFM (NLO)SHERPA (LO) up to 2 partons, stat. unc. only
(8 TeV)
-1
19.5 fb
CMS
Figure 5: Top: combined inclusive differential cross section for the two lepton channels com-pared to the NNLO [21], theMCFM(NLO) and theSHERPA SM predictions. The latter is nor-malized to the NNLO cross section. The last bin is computed for the interval 120–500 GeV. Bottom: the ratios of the data and the other predictions to the NNLO calculation showing the effect of the additional partons on the inclusive cross section.
11
Table 2: The combined inclusive cross sections for the muon and electron channels with statisti-cal, systematic, and integrated luminosity uncertainties, respectively. Scale and PDF uncertain-ties are included in the systematics for theMCFM(NLO) cross section calculation. Only scale uncertainties are considered for the NNLO calculation.
pγ
T(GeV) σincl(fb) σinclMCFM(fb) σinclNNLO(fb) 15–20 908±12±39±24 972±57 1005.6±2.6 20–25 489±9±21±13 510±27 540.1±3.7 25–30 234±7±11±6 245±17 269.2±3.6 30–35 132.8±4.8±7.0±3.5 113.4±6.8 131.6±3.5 35–45 120.7±4.0±6.2±3.1 103.2±6.4 123.2±3.6 45–55 71.8±3.0±4.6±1.9 51.3±2.5 60.6±1.6 55–65 32.2±2.3±2.5±0.8 29.6±1.4 35.2±1.0 65–75 19.1±1.8±1.7±0.5 18.5±1.0 21.89±0.56 75–85 13.2±1.5±1.2±0.3 12.10±0.70 14.38±0.38 85–95 9.6±1.2±1.2±0.3 8.19±0.41 9.98±0.31 95–120 16.3±1.3±1.4±0.4 11.47±0.57 14.10±0.44 >120 15.8±1.0±1.0±0.4 12.59±0.68 15.29±0.51
The pγT distribution of exclusive events is unfolded and the cross sections are calculated. The acceptance is taken from MCFM (NLO). As shown in Fig. 6 (left) the results of the two tem-plate methods agree well and are combined using the BLUE method. With the requirement of pγ
T > 15 GeV for the muon and the electron channels exclusive cross sections of 1774±
23 (stat)±115 (syst)±46 (lumi) fb and 1791±29 (stat)±122 (syst)±47 (lumi) fb are measured, respectively. These and the differential cross sections presented in Fig. 6 (right) are compatible. The combined cross sections for the two channels are shown in Fig. 7.
The difference at high pγT between the MCFM (NLO) calculation and SHERPA with up to two partons is smaller for the exclusive calculation. The measured cross section values are in agree-ment with the two predictions. The combination of the two lepton channels compared toMCFM
(NLO) is presented in Table 3 and the differential cross section is shown in Fig. 7. The ratio of the exclusive and inclusive cross sections is shown in Fig. 8. The fraction of exclusive events decreases with increasing pγ
T and the fraction of events with additional jets changes from 10%
to 40%. Adding the exclusive cross sections in all bins we obtain for pγT >15 GeV σexcl=1770±18 (stat)±115 (syst)±46 (lumi) fb.
This is compatible with theMCFM(NLO) prediction of σMCFM
excl =1800±120 fb.
7
Limits on aTGCs
The ZZγ or Zγγ aTGCs are formulated in the framework of an effective field theory consider-ing dimension six and eight operators, that fulfill the requirements of Lorentz invariance and
12 7 Limits on aTGCs (GeV) γ T p 20 30 40 50 102 2×10² -Templates ,nfp γ -Templates/I ηη σ 0 0.2 0.4 0.6 0.8 1 1.2 1.4 1.6 1.8 2 γ µ µ Data γ Data ee (8 TeV) -1 19.5 fb CMS (GeV) γ T p 20 30 40 50 102 2×10² (fb/GeV) γ T /dp excl. σ d 2 − 10 1 − 10 1 10 2 10 γ µ µ Data γ Data ee MCFM (NLO)
SHERPA (LO) up to 2 partons, stat. unc. only
(8 TeV)
-1
19.5 fb CMS
Figure 6: Left: ratio of the exclusive cross sections as obtained with the two template methods. Right: measured cross sections for the muon and electron channels using a combination of the two template methods compared to theMCFM(NLO) and theSHERPASM predictions. The last
bin is computed for the interval 120–500 GeV.
Table 3: The combined exclusive cross sections for muon and electron channels with statistical, systematic, and luminosity uncertainties respectively. Scale and PDF uncertainties are included in the systematics for theMCFM(NLO) cross section calculation.
pγ
T(GeV) σexcl(fb) σexclMCFM(fb)
15–20 832±12±49±22 873±51 20–25 432±9±25±11 450±23 25–30 196±6±12±5 211±10 30–35 100.5±5.3±7.4±2.6 89.5±7.9 35–45 89.2±3.7±6.2±2.3 77.2±5.6 45–55 49.5±2.8±4.9±1.3 39.0±2.4 55–65 25.4±2.0±3.1±0.7 22.4±1.6 65–75 11.4±1.5±1.7±0.3 13.83±0.98 75–85 9.3±1.3±1.6±0.2 8.85±0.48 85–95 6.3±1.2±1.4±0.2 5.83±0.70 95–120 9.9±1.0±1.3±0.3 7.83±0.48 >120 8.6±0.8±1.1±0.2 7.81±0.58
13
(GeV)
γ Tp
20 30 40 50 102 2×10²(fb/GeV)
γ T/dp
excl.σ
d
2 − 10 1 − 10 1 10 2 10 γ , ee γ µ µ Data combined: MCFM (NLO)SHERPA (LO) up to 2 partons, stat. unc. only
(8 TeV)
-119.5 fb
CMS
(GeV)
γ Tp
20 30 40 50 102 2×10²)
γ T/dp
MCFM excl.σ
) / (d
γ T/dp
excl.σ
(d
0.6 0.8 1 1.2 1.4 1.6 1.8 2 γ , ee γ µ µ Data combined: MCFM (NLO)SHERPA (LO) up to 2 partons, stat. unc. only
(8 TeV)
-1
19.5 fb
CMS
Figure 7: Top: combined exclusive differential cross section for the two lepton channels com-pared to theMCFM(NLO) andSHERPASM predictions. The wholeSHERPAsample (inclusive) is normalized to the NNLO cross section. The last bin is computed for the interval 120–500 GeV. Bottom: for the exclusive measurement the ratios to theMCFM(NLO) prediction are shown.
14 7 Limits on aTGCs
(GeV)
γ Tp
20 30 40 50 102 2×10²)
γ T/dp
incl.σ
) / (d
γ T/dp
excl.σ
(d
0 0.2 0.4 0.6 0.8 1 γ , ee γ µ µ Data combined: MCFM (NLO)SHERPA (LO) up to 2 partons, stat. unc. only
(8 TeV)
-1
19.5 fb
CMS
Figure 8: Ratio of the exclusive to inclusive cross sections for Zγ production. local U(1) gauge symmetry. The resulting Lagrangian [35] has the form
LaTGC= LSM+ e m2Z h −[h1γ(∂σFσµ) +h1Z(∂σZσµ)]ZβF µβ − [hγ 3(∂σFσρ) +h3Z(∂σZσρ)]ZαF˜ρα − [h γ 2 m2 Z [∂α∂β∂ ρF ρµ] + h2Z m2 Z [∂α∂β(∂ν∂ν+m2Z)Zµ]]ZαFµβ +[ h γ 4 2m2 Z [∂ν∂ ν ∂σFρα] + h Z 4 2m2 Z [(∂ν∂ ν+m2 Z)∂σZρα]]ZσF˜ρα # (1)
with the electromagnetic tensor Fµν = ∂µFν−∂νFµ and ˜Fµν = 1/2 eµνρσFρσand similar
defini-tions for the Z boson field. There are eight coupling constants hVi , i = 1 . . . 4 and V = Z, γ for ZZγ (Zγγ) couplings. The parameters hV1 and hV2 are CP-violating while h3Vand hV4 are not. It was shown in Ref. [36, 37] that there is no dimension six operator respecting U(1)Y×SU(2)L
invariance, but two dimension eight operators, including the Higgs field, that could lead to an enhancement proportional to hV1 and hV3. In this measurement we follow the CMS convention of not using form factors [5].
For the Zγ process the existence of aTGCs would typically lead to an enhancement of photons with high transverse momentum [1–3]. The observed pTγdistribution is therefore used to extract limits on ZZγ and Zγγ aTGCs.
The difference in the pγ
T distributions between the SM and aTGCs models is parameterized
using the MCFM (NLO) prediction. The NNLO SM calculation is added to describe a
com-plete pγ
T distributions of an aTGC model. To obtain a p
γ
T distribution that can be compared to
the data, each simulated event is weighted by the lepton and photon efficiencies and the pho-ton momentum is smeared according to the detector resolution. The irreducible background from the simulation and the background of nonprompt and misidentified photons, as obtained from the σηη template method, are added. In order to obtain a smooth background
15 (GeV) γ T p 100 150 200 250 300 350 400 450 500 Events / 4 GeV -1 10 1 10 2 10 Data Standard Model = 0.001 Z 4 = 0, h Z 3 h = 0 Z 4 = 0.03, h Z 3 h = 0.0016 Z 4 = 0.06, h Z 3 h (8 TeV) -1 channel, 19.5 fb γ µ µ SM p-value: 0.37 CMS (GeV) γ T p 100 150 200 250 300 350 400 450 500 Events / 4 GeV -1 10 1 10 2 10 Data Standard Model = 0.001 Z 4 = 0, h Z 3 h = 0 Z 4 = 0.03, h Z 3 h = 0.0016 Z 4 = 0.06, h Z 3 h (8 TeV) -1 channel, 19.4 fb γ ee SM p-value: 0.52 CMS (GeV) γ T p 100 150 200 250 300 350 400 450 500 Events / 4 GeV 1 − 10 1 10 2 10 3 10 Data Standard Model = 0.001 Z 4 = 0, h Z 3 h = 0 Z 4 = 0.03, h Z 3 h = 0.0016 Z 4 = 0.06, h Z 3 h (8 TeV) -1 channel, 19.5 fb γ µ µ SM p-value: 0.37 CMS (GeV) γ T p 100 150 200 250 300 350 400 450 500 Events / 4 GeV 1 − 10 1 10 2 10 3 10 Data Standard Model = 0.001 Z 4 = 0, h Z 3 h = 0 Z 4 = 0.03, h Z 3 h = 0.0016 Z 4 = 0.06, h Z 3 h (8 TeV) -1 channel, 19.4 fb γ ee SM p-value: 0.52 CMS
Figure 9: Top: the pγTdistribution compared to predictions using various values for the aTGCs and the SM. The observed p-values show that data are fully compatible with the SM expectation (red). Bottom: corresponding cumulated distributions.
obtained from a fit to the observed background distribution. Figure 9 shows a direct compar-ison between the pγT distribution in data and the expectations for various aTGC strengths. A theoretical uncertainty of 6–12% is determined from PDF and scale variations. Experimental systematic uncertainties are 2% in the dilepton efficiency, 2% in the photon efficiency, 2.6% in the luminosity measurement, and depending on pγ
Tup to 8% uncertainty in the background of
nonprompt and misidentified photons obtained from the σηηtemplate method.
An unbinned profile likelihood ratio based on the pγ
T distribution is used to find the best
fit-ting aTGC model and its 95% confidence level (CL) region. With the precision of the current measurement it is not possible to distinguish between the CP-even and CP-odd contributions. Therefore, only the CP-even parameters hV3 and hV4 are considered. The two-dimensional limits on hV3 and hV4 are shown in Fig. 10. The combination of the muon and electron channels takes into account that most of the systematic uncertainties are correlated with the exception of those related to the lepton reconstruction efficiencies. The one-dimensional 95% CL regions, when only one of the aTGCs is nonzero, are
−3.8×10⁻³< hZ3 <3.7×10⁻³
−3.1×10⁻⁵< hZ4 <3.0×10⁻⁵
−4.6×10⁻³< hγ3 <4.6×10⁻³
16 7 Limits on aTGCs Z 3
h
0.01 − −0.005 0 0.005 0.01 Z 4h
0.1 − 0.08 − 0.06 − 0.04 − 0.02 − 0 0.02 0.04 0.06 0.08 0.1 3 − 10 ×Exclusion probability
0.1 0.2 0.3 0.4 0.5 0.6 0.7 0.8 0.9 1 (8 TeV) -1 channels, 19.5 fb γ and ee γ µ µ CMS γ ZZData best fit Data CL = 95% Expected CL = 68% Expected CL = 95% Expected CL = 99% γ 3
h
0.01 − −0.005 0 0.005 0.01 γ 4h
0.1 − 0.08 − 0.06 − 0.04 − 0.02 − 0 0.02 0.04 0.06 0.08 0.1 3 − 10 ×Exclusion probability
0.1 0.2 0.3 0.4 0.5 0.6 0.7 0.8 0.9 1 (8 TeV) -1 channels, 19.5 fb γ and ee γ µ µ CMS γ γ ZData best fit Data CL = 95% Expected CL = 68% Expected CL = 95% Expected CL = 99%
Figure 10: Best fit of the combined muon and electron channels for models of anomalous ZZγ (top) and Zγγ (bottom) couplings. No form factor is used. The light blue star indicates the point of highest probability. The level of gray represents the exclusion probability and the black line corresponds to the 95% CL limit. In addition, several expected contours from SM simulation are shown.
17
8
Summary
A study of Zγ production in pp collisions at 8 TeV using data collected with the CMS experi-ment in 2012, corresponding to an integrated luminosity of 19.5 fb−1was presented. Decays of the Z bosons into muons and electrons were used for the measurement of the differential Zγ cross section as a function of pγT for a phase space defined by the kinematic requirements on the final-state particles shown in Table 1. In addition, the exclusive differential Zγ cross section for events with no accompanying central jets was presented. The inclusive and exclusive cross sections for pγ
T >15 GeV are measured to be:
σincl=2063±19 (stat)±98 (syst)±54 (lumi) fb, σexcl=1770±18 (stat)±115 (syst)±46 (lumi) fb.
Both values are compatible with the SM expectations of σMCFM
incl = 2100±120 fb (σinclNNLO =
2241±22 fb) and σMCFM
excl = 1800±120 fb, respectively. At high p
γ
T the inclusive measurement
is well described by the NNLO calculation and also by theSHERPAprediction including up to two additional partons at matrix element level, while a clear excess is observed with respect to theMCFM(NLO) calculation. This emphasizes the importance of NNLO QCD corrections for this measurement. A similar excess is not observed for the exclusive measurement.
Limits on the strengths of anomalous ZZγ and Zγγ couplings have been extracted. The fol-lowing one-dimensional limits at 95% CL have been obtained
−3.8×10⁻³< hZ3 <3.7×10⁻³
−3.1×10⁻⁵< hZ4 <3.0×10⁻⁵
−4.6×10⁻³< hγ
3 <4.6×10⁻³ −3.6×10⁻⁵< hγ4 <3.5×10⁻⁵.
These limits are more stringent than previously published results on neutral aTGCs for the charged lepton decays of the Z boson from LEP [38–41], Tevatron [42, 43] and the LHC experi-ments [4, 5].
Acknowledgments
We thank Dirk Rathlev and Massimiliano Grazzini for providing us with the NNLO calculation of the cross section.
We congratulate our colleagues in the CERN accelerator departments for the excellent perfor-mance of the LHC and thank the technical and administrative staffs at CERN and at other CMS institutes for their contributions to the success of the CMS effort. In addition, we grate-fully acknowledge the computing centers and personnel of the Worldwide LHC Computing Grid for delivering so effectively the computing infrastructure essential to our analyses. Fi-nally, we acknowledge the enduring support for the construction and operation of the LHC and the CMS detector provided by the following funding agencies: the Austrian Federal Min-istry of Science, Research and Economy and the Austrian Science Fund; the Belgian Fonds de la Recherche Scientifique, and Fonds voor Wetenschappelijk Onderzoek; the Brazilian Fund-ing Agencies (CNPq, CAPES, FAPERJ, and FAPESP); the Bulgarian Ministry of Education and Science; CERN; the Chinese Academy of Sciences, Ministry of Science and Technology, and Na-tional Natural Science Foundation of China; the Colombian Funding Agency (COLCIENCIAS); the Croatian Ministry of Science, Education and Sport, and the Croatian Science Foundation;
18 References
the Research Promotion Foundation, Cyprus; the Ministry of Education and Research, Esto-nian Research Council via IUT23-4 and IUT23-6 and European Regional Development Fund, Estonia; the Academy of Finland, Finnish Ministry of Education and Culture, and Helsinki Institute of Physics; the Institut National de Physique Nucl´eaire et de Physique des Partic-ules / CNRS, and Commissariat `a l’ ´Energie Atomique et aux ´Energies Alternatives / CEA, France; the Bundesministerium f ¨ur Bildung und Forschung, Deutsche Forschungsgemeinschaft, and Helmholtz-Gemeinschaft Deutscher Forschungszentren, Germany; the General Secretariat for Research and Technology, Greece; the National Scientific Research Foundation, and Na-tional Innovation Office, Hungary; the Department of Atomic Energy and the Department of Science and Technology, India; the Institute for Studies in Theoretical Physics and Mathe-matics, Iran; the Science Foundation, Ireland; the Istituto Nazionale di Fisica Nucleare, Italy; the Ministry of Science, ICT and Future Planning, and National Research Foundation (NRF), Republic of Korea; the Lithuanian Academy of Sciences; the Ministry of Education, and Uni-versity of Malaya (Malaysia); the Mexican Funding Agencies (CINVESTAV, CONACYT, SEP, and UASLP-FAI); the Ministry of Business, Innovation and Employment, New Zealand; the Pakistan Atomic Energy Commission; the Ministry of Science and Higher Education and the National Science Centre, Poland; the Fundac¸˜ao para a Ciˆencia e a Tecnologia, Portugal; JINR, Dubna; the Ministry of Education and Science of the Russian Federation, the Federal Agency of Atomic Energy of the Russian Federation, Russian Academy of Sciences, and the Russian Foun-dation for Basic Research; the Ministry of Education, Science and Technological Development of Serbia; the Secretar´ıa de Estado de Investigaci ´on, Desarrollo e Innovaci ´on and Programa Consolider-Ingenio 2010, Spain; the Swiss Funding Agencies (ETH Board, ETH Zurich, PSI, SNF, UniZH, Canton Zurich, and SER); the Ministry of Science and Technology, Taipei; the Thailand Center of Excellence in Physics, the Institute for the Promotion of Teaching Science and Technology of Thailand, Special Task Force for Activating Research and the National Sci-ence and Technology Development Agency of Thailand; the Scientific and Technical Research Council of Turkey, and Turkish Atomic Energy Authority; the National Academy of Sciences of Ukraine, and State Fund for Fundamental Researches, Ukraine; the Science and Technology Facilities Council, UK; the US Department of Energy, and the US National Science Foundation. Individuals have received support from the Marie-Curie program and the European Research Council and EPLANET (European Union); the Leventis Foundation; the A. P. Sloan Founda-tion; the Alexander von Humboldt FoundaFounda-tion; the Belgian Federal Science Policy Office; the Fonds pour la Formation `a la Recherche dans l’Industrie et dans l’Agriculture (FRIA-Belgium); the Agentschap voor Innovatie door Wetenschap en Technologie (IWT-Belgium); the Ministry of Education, Youth and Sports (MEYS) of the Czech Republic; the Council of Science and Industrial Research, India; the HOMING PLUS program of Foundation for Polish Science, co-financed from European Union, Regional Development Fund; the Compagnia di San Paolo (Torino); the Consorzio per la Fisica (Trieste); MIUR project 20108T4XTM (Italy); the Thalis and Aristeia programs cofinanced by EU-ESF and the Greek NSRF; and the National Priorities Research Program by Qatar National Research Fund.
References
[1] V. Barger, H. Baer, and K. Hagiwara, “Testing models for anomalous radiative decays of the Z boson”, Phys. Rev. D 30 (1984) 1513, doi:10.1103/PhysRevD.30.1513. [2] U. Baur, T. Han, and J. Ohnemus, “QCD corrections and anomalous couplings in Zγ
production at hadron colliders”, Phys. Rev. D 57 (1998) 2823, doi:10.1103/PhysRevD.57.2823, arXiv:hep-ph/9710416.
References 19
[3] U. Baur and E. L. Berger, “Probing the weak-boson sector in Zγ production at hadron colliders”, Phys. Rev. D (1993) 4889, doi:10.1103/PhysRevD.47.4889.
[4] ATLAS Collaboration, “Measurements of Wγ and Zγ production in pp collisions at√ s =7 TeV with the ATLAS detector at the LHC”, Phys. Rev. D 87 (2013) 112003, doi:10.1103/PhysRevD.87.112003, arXiv:1302.1283.
[5] CMS Collaboration, “Measurement of the Wγ and Zγ inclusive cross sections in pp collisions at√s=7 TeV and limits on anomalous triple gauge boson couplings”, Phys. Rev. D 89 (2014) 092005, doi:10.1103/PhysRevD.89.092005.
[6] CMS Collaboration, “Particle–Flow Event Reconstruction in CMS and Performance for Jets, Taus, and Emiss
T ”, CMS Physics Analysis Summary CMS-PAS-PFT-09-001, 2009.
[7] CMS Collaboration, “Commissioning of the particle-flow event reconstruction with the first LHC collisions recorded in the CMS detector”, CMS Physics Analysis Summary CMS-PAS-PFT-10-001, 2010.
[8] CMS Collaboration, “Commissioning of the particle-flow event reconstruction with leptons from J/Ψ and W decays at 7 TeV”, CMS Physics Analysis Summary
CMS-PAS-PFT-10-003, 2010.
[9] W. Adam, R. Fr ¨uhwirth, A. Strandlie, and T. Todorov, “Reconstruction of electrons with the Gaussian-sum filter in the CMS tracker at the LHC”, J. Phys. G: Nucl. Part. Phys. 31 (2005) N9, doi:10.1088/0954-3899/31/9/N01.
[10] S. Baffioni et al., “Electron reconstruction in CMS”, Eur. Phys. J. C 49 (2007) 1099, doi:10.1140/epjc/s10052-006-0175-5.
[11] M. Cacciari, G. P. Salam, and G. Soyez, “The anti-ktjet clustering algorithm”, JHEP 04
(2008) 063, doi:10.1088/1126-6708/2008/04/063, arXiv:0802.1189.
[12] M. Cacciari, G. P. Salam, and G. Soyez, “FastJet user manual”, Eur. Phys. J. C 72 (2012) 1896, doi:10.1140/epjc/s10052-012-1896-2, arXiv:1111.6097.
[13] CMS Collaboration, “Determination of jet energy calibration and transverse momentum resolution in CMS”, J. Instrum. 6 (2011) P11002,
doi:10.1088/1748-0221/6/11/P11002.
[14] M. Cacciari, G. P. Salam, and G. Soyez, “The catchment area of jets”, JHEP 04 (2008) 005, doi:10.1088/1126-6708/2008/04/005, arXiv:0802.1188.
[15] CMS Collaboration, “The CMS experiment at the CERN LHC”, JINST 3 (2008) S08004, doi:10.1088/1748-0221/3/08/S08004.
[16] T. Gleisberg et al., “Event generation with SHERPA 1.1”, JHEP 02 (2009) 007, doi:10.1088/1126-6708/2009/02/007, arXiv:0811.4622.
[17] J. M. Campbell, H. B. Hartanto, and C. Williams, “Next-to-leading order predictions for Zγ+jet and Z γγ final states at the LHC”, JHEP 11 (2012) 162,
doi:10.1007/JHEP11(2012)162, arXiv:1208.0566.
[18] H.-L. Lai et al., “New parton distributions for collider physics”, Phys. Rev. D 82 (2010) 074024, doi:10.1103/PhysRevD.82.074024, arXiv:1007.2241.
20 References
[19] J. M. Campbell, W. Huston, J, and W. J. Stirling, “Hard interactions of quarks and gluons: a primer for LHC physics”, Rep. Prog. Phys. 70 (2007) 89,
doi:10.1088/0034-4885/70/1/R02, arXiv:hep-ph/0611148.
[20] I. W. Stewart and F. J. Tackmann, “Theory uncertainties for Higgs mass and other searches using jet bins”, Phys. Rev. D 85 (2012) 034011,
doi:10.1103/PhysRevD.85.034011, arXiv:1107.2117.
[21] M. Grazzini, S. Kallweit, D. Rathlev, and A. Torre, “Zγ production at hadron colliders in NNLO QCD”, Phys. Lett. B 731 (2014) 204,
doi:10.1016/j.physletb.2014.02.037, arXiv:1309.7000.
[22] J. Alwall et al., “MadGraph/MadEvent v4: the new web generation”, JHEP 09 (2007) 028, doi:10.1088/1126-6708/2007/09/028, arXiv:0706.2334.
[23] J. Pumplin et al., “New generation of parton distributions with uncertainties from global QCD analysis”, JHEP 07 (2002) 012, doi:10.1088/1126-6708/2002/07/012, arXiv:hep-ph/0201195.
[24] T. Sj ¨ostrand, S. Mrenna, and P. Skands, “PYTHIA 6.4 physics and manual”, JHEP 05 (2006) 026, doi:10.1088/1126-6708/2006/05/026, arXiv:hep-ph/0603175. [25] R. Gavin, Y. Li, F. Petriello, and S. Quackenbush, “FEWZ 2.0: A code for hadronic Z
production at next-to-next-to-leading order”, Comp. Phys. Comm. 182 (2011) 2388, doi:10.1016/j.cpc.2011.06.008.
[26] GEANT4 Collaboration, “GEANT4—a simulation toolkit”, Nucl. Instrum. Meth. A 506 (2003) 250, doi:10.1016/S0168-9002(03)01368-8.
[27] CMS Collaboration, “Performance of CMS muon reconstruction in pp collision events at√ s =7 TeV”, J. Instrum. 7 (2012) P10002, doi:10.1088/1748-0221/7/10/P10002. [28] CMS Collaboration, “Electron performance with 19.6 fb−1of data collected at√s =8 TeV
with the CMS detector.”, CMS Detector Performance Summary CMS-DP-2013-003, 2013. [29] M. Cacciari and G. P. Salam, “Pileup subtraction using jet areas”, Phys. Lett. B 659 (2008)
119, doi:10.1016/j.physletb.2007.09.077, arXiv:0707.1378.
[30] CMS Collaboration, “Measurement of the isolated prompt diphoton production cross section in pp collisions at√s=7 TeV”, J. High Energy Phys. 01 (2012) 133,
doi:10.1007/JHEP01(2012)133.
[31] CMS Collaboration, “Measurement of the inclusive W and Z production cross sections in pp collisions at√s =7 TeV with the CMS experiment”, J. High Energy Phys. 10 (2011) 132, doi:10.1007/JHEP10(2011)132.
[32] G. D’Agostini, “A multidimensional unfolding method based on Bayes’ theorem”, Nucl. Instrum. Meth. A 362 (1995) 487, doi:10.1016/0168-9002(95)00274-X.
[33] T. Adye, “Unfolding algorithms and tests using RooUnfold”, (2011). arXiv:1105.1160. [34] A. Valassi, “Combining correlated measurements of several different physical quantities”,
References 21
[35] G. J. Gounaris, J. Layssac, and F. M. Renard, “Signatures of the anomalous Zγ and ZZ production at lepton and hadron colliders”, Phys. Rev. D 61 (2000) 3013,
doi:10.1103/PhysRevD.61.073013, arXiv:hep-ph/9910395.
[36] G. J. Gounaris, J. Layssac, and F. M. Renard, “Off-shell structure of the anomalous Z and γself-couplings”, Phys. Rev. D 62 (2000) 073012,
doi:10.1103/PhysRevD.62.073012.
[37] C. Degrande, “A basis of dimension-eight operators for anomalous neutral triple gauge boson interactions”, JHEP 02 (2014) 101, doi:10.1007/JHEP02(2014)101,
arXiv:1308.6323.
[38] DELPHI Collaboration, “Study of triple-gauge-boson couplings ZZZ, ZZγ and Zγγ at LEP.”, Eur. Phys. J. C 51 (2007) 525, doi:10.1140/epjc/s10052-007-0345-0, arXiv:0706.2741.
[39] L3 Collaboration, “Study of the e+e− →Zγ process at LEP and limits on triple neutral-gauge-boson couplings”, Phys. Lett. B 597 (2004) 119,
doi:10.1016/j.physletb.2004.07.002.
[40] OPAL Collaboration, “Study of Z pair production and anomalous couplings in e+e− collisions at√s between 190 GeV and 209 GeV”, Eur. Phys. J. C 32 (2003) 303, doi:10.1140/epjc/s2003-01467-x, arXiv:hep-ex/0310013.
[41] ALEPH Collaboration, DELPHI Collaboration, L3 Collaboration, OPAL Collaboration and LEP Electroweak Working Group, “Electroweak measurements in electron-positron collisions at W-boson-pair energies at LEP”, Phys. Rept. 532 (2013) 119,
doi:10.1016/j.physrep.2013.07.004, arXiv:1302.3415.
[42] CDF Collaboration, “Limits on Anomalous Trilinear Gauge Couplings in Zγ Events from p ¯p Collisions at√s=1.96 TeV”, Phys. Rev. Lett. 107 (2011) 051802,
doi:10.1103/PhysRevLett.107.051802.
[43] D0 Collaboration, “Zγ production and limits on anomalous ZZγ and Zγγ couplings in p ¯p collisions at√s =1.96 TeV”, Phys. Rev. D 85 (2012) 052001,
23
A
The CMS Collaboration
Yerevan Physics Institute, Yerevan, Armenia V. Khachatryan, A.M. Sirunyan, A. Tumasyan
Institut f ¨ur Hochenergiephysik der OeAW, Wien, Austria
W. Adam, T. Bergauer, M. Dragicevic, J. Er ¨o, M. Friedl, R. Fr ¨uhwirth1, V.M. Ghete, C. Hartl, N. H ¨ormann, J. Hrubec, M. Jeitler1, W. Kiesenhofer, V. Kn ¨unz, M. Krammer1, I. Kr¨atschmer, D. Liko, I. Mikulec, D. Rabady2, B. Rahbaran, H. Rohringer, R. Sch ¨ofbeck, J. Strauss,
W. Treberer-Treberspurg, W. Waltenberger, C.-E. Wulz1
National Centre for Particle and High Energy Physics, Minsk, Belarus V. Mossolov, N. Shumeiko, J. Suarez Gonzalez
Universiteit Antwerpen, Antwerpen, Belgium
S. Alderweireldt, S. Bansal, T. Cornelis, E.A. De Wolf, X. Janssen, A. Knutsson, J. Lauwers, S. Luyckx, S. Ochesanu, R. Rougny, M. Van De Klundert, H. Van Haevermaet, P. Van Mechelen, N. Van Remortel, A. Van Spilbeeck
Vrije Universiteit Brussel, Brussel, Belgium
F. Blekman, S. Blyweert, J. D’Hondt, N. Daci, N. Heracleous, J. Keaveney, S. Lowette, M. Maes, A. Olbrechts, Q. Python, D. Strom, S. Tavernier, W. Van Doninck, P. Van Mulders, G.P. Van Onsem, I. Villella
Universit´e Libre de Bruxelles, Bruxelles, Belgium
C. Caillol, B. Clerbaux, G. De Lentdecker, D. Dobur, L. Favart, A.P.R. Gay, A. Grebenyuk, A. L´eonard, A. Mohammadi, L. Perni`e2, A. Randle-conde, T. Reis, T. Seva, L. Thomas, C. Vander Velde, P. Vanlaer, J. Wang, F. Zenoni
Ghent University, Ghent, Belgium
V. Adler, K. Beernaert, L. Benucci, A. Cimmino, S. Costantini, S. Crucy, S. Dildick, A. Fagot, G. Garcia, J. Mccartin, A.A. Ocampo Rios, D. Poyraz, D. Ryckbosch, S. Salva Diblen, M. Sigamani, N. Strobbe, F. Thyssen, M. Tytgat, E. Yazgan, N. Zaganidis
Universit´e Catholique de Louvain, Louvain-la-Neuve, Belgium
S. Basegmez, C. Beluffi3, G. Bruno, R. Castello, A. Caudron, L. Ceard, G.G. Da Silveira, C. Delaere, T. du Pree, D. Favart, L. Forthomme, A. Giammanco4, J. Hollar, A. Jafari, P. Jez, M. Komm, V. Lemaitre, C. Nuttens, L. Perrini, A. Pin, K. Piotrzkowski, A. Popov5, L. Quertenmont, M. Selvaggi, M. Vidal Marono, J.M. Vizan Garcia
Universit´e de Mons, Mons, Belgium
N. Beliy, T. Caebergs, E. Daubie, G.H. Hammad
Centro Brasileiro de Pesquisas Fisicas, Rio de Janeiro, Brazil
W.L. Ald´a J ´unior, G.A. Alves, L. Brito, M. Correa Martins Junior, T. Dos Reis Martins, J. Molina, C. Mora Herrera, M.E. Pol, P. Rebello Teles
Universidade do Estado do Rio de Janeiro, Rio de Janeiro, Brazil
W. Carvalho, J. Chinellato6, A. Cust ´odio, E.M. Da Costa, D. De Jesus Damiao, C. De Oliveira Martins, S. Fonseca De Souza, H. Malbouisson, D. Matos Figueiredo, L. Mundim, H. Nogima, W.L. Prado Da Silva, J. Santaolalla, A. Santoro, A. Sznajder, E.J. Tonelli Manganote6, A. Vilela Pereira
24 A The CMS Collaboration
Universidade Estadual Paulistaa, Universidade Federal do ABCb, S˜ao Paulo, Brazil
C.A. Bernardesb, S. Dograa, T.R. Fernandez Perez Tomeia, E.M. Gregoresb, P.G. Mercadanteb, S.F. Novaesa, Sandra S. Padulaa
Institute for Nuclear Research and Nuclear Energy, Sofia, Bulgaria
A. Aleksandrov, V. Genchev2, R. Hadjiiska, P. Iaydjiev, A. Marinov, S. Piperov, M. Rodozov, S. Stoykova, G. Sultanov, M. Vutova
University of Sofia, Sofia, Bulgaria
A. Dimitrov, I. Glushkov, L. Litov, B. Pavlov, P. Petkov Institute of High Energy Physics, Beijing, China
J.G. Bian, G.M. Chen, H.S. Chen, M. Chen, T. Cheng, R. Du, C.H. Jiang, R. Plestina7, F. Romeo, J. Tao, Z. Wang
State Key Laboratory of Nuclear Physics and Technology, Peking University, Beijing, China C. Asawatangtrakuldee, Y. Ban, Q. Li, S. Liu, Y. Mao, S.J. Qian, D. Wang, Z. Xu, W. Zou
Universidad de Los Andes, Bogota, Colombia
C. Avila, A. Cabrera, L.F. Chaparro Sierra, C. Florez, J.P. Gomez, B. Gomez Moreno, J.C. Sanabria
University of Split, Faculty of Electrical Engineering, Mechanical Engineering and Naval Architecture, Split, Croatia
N. Godinovic, D. Lelas, D. Polic, I. Puljak
University of Split, Faculty of Science, Split, Croatia Z. Antunovic, M. Kovac
Institute Rudjer Boskovic, Zagreb, Croatia
V. Brigljevic, K. Kadija, J. Luetic, D. Mekterovic, L. Sudic University of Cyprus, Nicosia, Cyprus
A. Attikis, G. Mavromanolakis, J. Mousa, C. Nicolaou, F. Ptochos, P.A. Razis Charles University, Prague, Czech Republic
M. Bodlak, M. Finger, M. Finger Jr.8
Academy of Scientific Research and Technology of the Arab Republic of Egypt, Egyptian Network of High Energy Physics, Cairo, Egypt
Y. Assran9, A. Ellithi Kamel10, M.A. Mahmoud11, A. Radi12,13
National Institute of Chemical Physics and Biophysics, Tallinn, Estonia M. Kadastik, M. Murumaa, M. Raidal, A. Tiko
Department of Physics, University of Helsinki, Helsinki, Finland P. Eerola, M. Voutilainen
Helsinki Institute of Physics, Helsinki, Finland
J. H¨ark ¨onen, V. Karim¨aki, R. Kinnunen, M.J. Kortelainen, T. Lamp´en, K. Lassila-Perini, S. Lehti, T. Lind´en, P. Luukka, T. M¨aenp¨a¨a, T. Peltola, E. Tuominen, J. Tuominiemi, E. Tuovinen, L. Wendland
Lappeenranta University of Technology, Lappeenranta, Finland J. Talvitie, T. Tuuva
25
DSM/IRFU, CEA/Saclay, Gif-sur-Yvette, France
M. Besancon, F. Couderc, M. Dejardin, D. Denegri, B. Fabbro, J.L. Faure, C. Favaro, F. Ferri, S. Ganjour, A. Givernaud, P. Gras, G. Hamel de Monchenault, P. Jarry, E. Locci, J. Malcles, J. Rander, A. Rosowsky, M. Titov
Laboratoire Leprince-Ringuet, Ecole Polytechnique, IN2P3-CNRS, Palaiseau, France
S. Baffioni, F. Beaudette, P. Busson, E. Chapon, C. Charlot, T. Dahms, M. Dalchenko, L. Dobrzynski, N. Filipovic, A. Florent, R. Granier de Cassagnac, L. Mastrolorenzo, P. Min´e, I.N. Naranjo, M. Nguyen, C. Ochando, G. Ortona, P. Paganini, S. Regnard, R. Salerno, J.B. Sauvan, Y. Sirois, C. Veelken, Y. Yilmaz, A. Zabi
Institut Pluridisciplinaire Hubert Curien, Universit´e de Strasbourg, Universit´e de Haute Alsace Mulhouse, CNRS/IN2P3, Strasbourg, France
J.-L. Agram14, J. Andrea, A. Aubin, D. Bloch, J.-M. Brom, E.C. Chabert, C. Collard, E. Conte14, J.-C. Fontaine14, D. Gel´e, U. Goerlach, C. Goetzmann, A.-C. Le Bihan, K. Skovpen, P. Van Hove Centre de Calcul de l’Institut National de Physique Nucleaire et de Physique des Particules, CNRS/IN2P3, Villeurbanne, France
S. Gadrat
Universit´e de Lyon, Universit´e Claude Bernard Lyon 1, CNRS-IN2P3, Institut de Physique Nucl´eaire de Lyon, Villeurbanne, France
S. Beauceron, N. Beaupere, C. Bernet7, G. Boudoul2, E. Bouvier, S. Brochet, C.A. Carrillo Montoya, J. Chasserat, R. Chierici, D. Contardo2, P. Depasse, H. El Mamouni, J. Fan, J. Fay, S. Gascon, M. Gouzevitch, B. Ille, T. Kurca, M. Lethuillier, L. Mirabito, S. Perries, J.D. Ruiz Alvarez, D. Sabes, L. Sgandurra, V. Sordini, M. Vander Donckt, P. Verdier, S. Viret, H. Xiao Institute of High Energy Physics and Informatization, Tbilisi State University, Tbilisi, Georgia
Z. Tsamalaidze8
RWTH Aachen University, I. Physikalisches Institut, Aachen, Germany
C. Autermann, S. Beranek, M. Bontenackels, M. Edelhoff, L. Feld, A. Heister, K. Klein, M. Lipinski, A. Ostapchuk, M. Preuten, F. Raupach, J. Sammet, S. Schael, J.F. Schulte, H. Weber, B. Wittmer, V. Zhukov5
RWTH Aachen University, III. Physikalisches Institut A, Aachen, Germany
M. Ata, M. Brodski, E. Dietz-Laursonn, D. Duchardt, M. Erdmann, R. Fischer, A. G ¨uth, T. Hebbeker, C. Heidemann, K. Hoepfner, D. Klingebiel, S. Knutzen, P. Kreuzer, M. Merschmeyer, A. Meyer, P. Millet, M. Olschewski, K. Padeken, P. Papacz, H. Reithler, S.A. Schmitz, L. Sonnenschein, D. Teyssier, S. Th ¨uer, M. Weber
RWTH Aachen University, III. Physikalisches Institut B, Aachen, Germany
V. Cherepanov, Y. Erdogan, G. Fl ¨ugge, H. Geenen, M. Geisler, W. Haj Ahmad, F. Hoehle, B. Kargoll, T. Kress, Y. Kuessel, A. K ¨unsken, J. Lingemann2, A. Nowack, I.M. Nugent, O. Pooth, A. Stahl
Deutsches Elektronen-Synchrotron, Hamburg, Germany
M. Aldaya Martin, I. Asin, N. Bartosik, J. Behr, U. Behrens, A.J. Bell, A. Bethani, K. Borras, A. Burgmeier, A. Cakir, L. Calligaris, A. Campbell, S. Choudhury, F. Costanza, C. Diez Pardos, G. Dolinska, S. Dooling, T. Dorland, G. Eckerlin, D. Eckstein, T. Eichhorn, G. Flucke, J. Garay Garcia, A. Geiser, P. Gunnellini, J. Hauk, M. Hempel15, H. Jung, A. Kalogeropoulos, M. Kasemann, P. Katsas, J. Kieseler, C. Kleinwort, I. Korol, D. Kr ¨ucker, W. Lange, J. Leonard, K. Lipka, A. Lobanov, W. Lohmann15, B. Lutz, R. Mankel, I. Marfin15, I.-A. Melzer-Pellmann,

![Figure 5: Top: combined inclusive differential cross section for the two lepton channels com- com-pared to the NNLO [21], the MCFM (NLO) and the SHERPA SM predictions](https://thumb-eu.123doks.com/thumbv2/123dok_br/15739017.1072327/12.892.210.668.263.943/figure-combined-inclusive-differential-section-channels-sherpa-predictions.webp)