Development of an
Ecotoxicological Test
with a Soil Microalgae
Species
Vânia Gonçalves Carvalhido
Master’s degree in Biology and Water Management
Biology Department2018
Supervisor
Ruth Maria de Oliveira Pereira, Assistant Professor with Habilitation, Faculty of Sciences, University of Porto
Co-supervisor
Paula Maria Vieira de Melo Gomes, Assistant Professor, Faculty of Sciences, University of Porto
pelo júri, e só essas, foram efetuadas. O Presidente do Júri, Porto, ______/______/__ _______
Development of an
Ecotoxicological Test
with a Soil Microalgae
Species
Dissertação de Mestrado em Biologia e Gestão da Qualidade da Água apresentada à Faculdade de Ciências da Universidade do Porto
Departamento de Biologia
Faculdade de Ciências da Universidade do Porto 2018
I
Acknowledgements
First, I would like to express my enormous gratitude to my parents for always being there for me and for their immense and exhausting sacrifice through all of these years. For all the love, advice and for just being there for me in my moments of crisis. To both of you, thank you so much.
I would like to express my gratitude to both of my supervisors, Professor Ruth Pereira and Professor Paula Melo for everything I learn this year, for helping me with the execution of my experiments, for their patience, care, and support through this year. Both were an important support in moments of doubt, making me less stressed, for all the advice and important guidance. I would like to also thank Professor Paula Tamagnini and Ângela Brito for all the help and knowledge with the molecular techniques.
I also want to express my gratitude to Diogo Coelho for all the help in the identification of my species, for helping me in the laboratory and for all the conversations throughout the year.
I would like to thank everyone involved in my dissertation, with a special thank you to Ana Ribeiro for helping me with planning and the execution of my experiments, to Inês Nogueira for helping me with the statistical program and to everyone else for being helpful every time I asked for a favor.
To my parents and my grandmother, I dedicate this dissertation, for their presence in my life and for making me a better human being.
Last but not least, I would like to thank my brother and to my dog for keeping me company and listening to my frustrations and to Ana Rocha, for always being there for a kind word and support, even at distance.
II
Contents Index
Acknowledgements ... I Contents Index ... II Figures Index ... IV Tables Index ... VI Abstract ... VII Resumo ... IX 1. Introduction ... 1 1.1. Terrestrial microalgae ... 1 1.2. Terrestrial Ecotoxicology ... 42. Aim of the thesis... 12
3. Material and Methods... 13
3.1. Microalgae isolation and culture conditions ... 13
3.2. Genetic Identification of the BSC selected microalgae ... 14
3.2.1. DNA extraction ... 14
3.2.2. PCR amplification ... 14
3.2.3. DNA purification and sequencing ... 15
3.3. Ecotoxicological tests in aqueous medium following available standard protocol for microalgae ... 16
3.3.1. BSC microalga growth curves in a liquid medium ... 16
3.3.2. Reference substances test solutions ... 17
3.3.3. Ecotoxicological test in BG11 medium with the BSC microalga ... 17
3.4.1. Standard artificial soil ... 19
3.4.2. BSC microalga growth curves in soil... 20
3.4.3. Pigment content ... 21
3.4.4. Preparation of test solutions ... 22
3.4.5. Ecotoxicological test in the OECD soil and with the BSC microalga ... 22
III
4. Results ... 24
4.1. Identification of the BSC selected microalga ... 24
4.1.2. Genetic identification of the BSC selected microalga ... 24
4.2. Ecotoxicological test in liquid medium with the BSC microalga ... 26
4.2.1. Growth curves and ecotoxicological tests in aqueous medium following the available standard protocol for freshwater microalgae and cyanobacteria ... 26
4.2.2. Ecotoxicological test in BG11 medium with M. inermum ... 27
4.3. Ecotoxicological test in artificial soil with the BSC microalga ... 29
4.3.1. M. inermum growth curve in artificial OECD soil ... 29
4.3.2. Ecotoxicological test with M. inermum in OECD artificial soil ... 30
5. Discussion ... 33
5.1. Characterization and identification of a selected microalga from the BSC ... 33
5.2. Ecotoxicological Assays in Aqueous Medium Following Available Standard Protocol for Freshwater Microalgae and Cyanobacteria... 35
M. inermum ... 37
Chlorella vulgaris ... 37
M. inermum ... 39
Scenedesmus obliquuos ... 39
5.3. Ecotoxicological Test with Soil BSC Microalgae using Artificial OECD Soil as a Test Substance... 40
6. Conclusions ... 43
References ... 44
Annex A ... 69
IV
Figures Index
Figure 1 - Inoculum of the green microalgae from the BSC, day 1 (a) and after 15-days of growth (b). ... 14 Figure 2 - Representative scheme of the 18S rDNA, the hybridization sites of the primer pairs used for PCR amplification and the expected size of the amplified fragments. ... 15 Figure 3 - Microplates incubated in the orbital shaker at 130 rpm (a) and example of a 24-well after a 5-days of incubation period (b). Each line of 24-wells has the four replicates for the CTL and for two of the tested concentrations. The wells of the last column and of the last line were filled with water to reduce evaporation. ... 19 Figure 4 - Petri plate with an OECD soil layer. Top view (a) and side view (b). Soil inoculation with the BSC microalgae (c). ... 20 Figure 5 – Petri plate plates with OECD soil incubated for obtaining BSC microalgae growth curves. ... 21 Figure 6 – General aspect of the morphology of the cells of the soil microalgae, at the end of the isolation process with a 100X amplification under optical microscopy... 24 Figure 7 - Electrophoretic separation of the DNA fragments, amplified by PCR using the pair of primers (1) NS7m/LR1850 and (2) NS1/18L. ... 25 Figure 8 - BLAST results for the sequences with the primers (a) NS7 LR1850+LR1850, (b) NS7 LR1850+NS7m, (c) NS1+18L and (d) NS1 18L+NS1 obtained showing a homology of 98% with Micractinium inermum. ... 25 Figure 9- Growth curve of M. inermum cultured in two different media, BG11 (left) and MBL (right). Bars account for average values and error bars for standard deviation. The r-squared value of the sigmoidal model adjusted to data is displayed. ... 26 Figure 10 - Percentage of growth rate Inhibition (%) towards the control for M. inermum, measured by the, exposed to copper in three independent tests (A), (B) and (C). Bars account for average values and error bars for standard deviation. * above each bar indicate statistically differences between the treatment and the control. ... 28 Figure 11 - Percentage of growth rate Inhibition (%) towards the control for M. inermum exposed to glyphosate in three independent tests (A), (B) and (C). Bars account for average values and error bars for standard deviation. * above each bar indicate statistically differences between the treatment and the control. ... 29 Figure 12 - Growth curve of M. inermum cultivated in artificial OECD soil, determined by quantification of chlorophyll ɑ. Bars account for average values and error bars for standard deviation. The r-squared value of the power model adjusted to data is displayed. ... 30 Figure 13 - Percentage of growth rate Inhibition (%) towards the control for M. inermum exposed to copper on soil for the three independent tests (A), (B) and (C). Bars account for
V
average values and error bars for standard deviation. * above each bar indicate statistically differences between the treatment and the control. ... 31 Figure 14 - Percentage of growth rate Inhibition (%) towards the control for M. inermum exposed to glyphosate on soil for three independent tests (A), (B) and (C). Bars account for average values and error bars for standard deviation. * above each bar indicate statistically differences between the treatment and the control. ... 32
VI
Tables Index
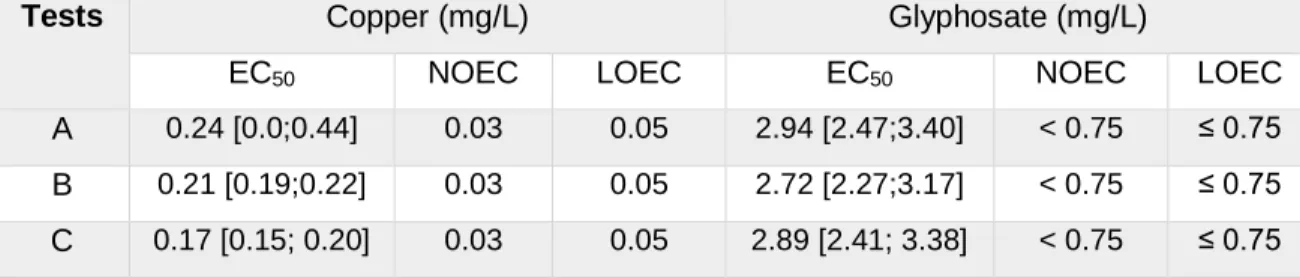
Table 1 – Sequences of the specific primers for the amplification of the 18S rRNA gene and the corresponding size of the amplified fragments. ... 15 Table 2 – EC50, LOEC and NOEC values and respectively 95% confidence intervals after 5-day Cu and GLY exposure to M. inermum on BG11 medium. ... 27 Table 3 – EC50, LOEC, and NOEC values and respective 95% confidence intervals after 13-day Cu and GLY exposure to M. inermum on artificial soil. ... 31
VII
Abstract
Microalgae form an important component of soil microflora, accounting for up to 27% of the total soil microbial community. This group of soil organisms has important soil functions as for example: i) to contribute for soil formation, being one of the first colonizers of bedrock and, for improving soil structure; ii) to promote organic carbon sequestration in soils and, iii) to maintain soils fertility. Despite, the recognized importance of microalgae to soil functions and soil quality, this group of organisms is not considered in the battery of species used to assess the risks of new or existing contaminants to soil biota. Taking this into account, a microalga species was isolated from biological soil crusts, collected in a Portuguese soil in the Center region of the country, and was genetically identified as Micractinium inermum, a Chlorophyta species with a worldwide distribution. This species was then used to pursue the main objective of this work, the development of an ecotoxicological test procedure with a
soil microalga, using soil as a test substrate.
To meet this main objective, the following specific tasks were accomplished: 1) considering that soil is a semi-aquatic habitat, the adequacy of the standard protocol for growth inhibition tests with freshwater microalgae and cyanobacteria (OECD 201) was tested for M. inermum. Copper (II), used as Copper (II) Sulfate Anhydrous (CuSO4) and an herbicide, a soluble concentrate formulation containing 28.85% of glyphosate (GLY), the Roundup Max® were selected as reference substances, given the availability of toxicity data for these two compounds. With this task it was also intended to compare the sensitivity of the soil species with that of freshwater species commonly used in ecotoxicological tests. 2) a more ecologically relevant test methodology, using the artificial OECD soil, was developed.
Three independent tests were performed for each reference substances both following the existing standard protocol and the one developed in this study, after obtaining growth curves for the species, both in aqueous BG11 culture medium and in OECD artificial soil. Growth curves were useful for establishing the exposure durations (5 and 13 days, in aqueous and soil media, respectively) and the validity criteria of the tests (an increase of 14 and 100 times, in cell’s density and in chlorophyll content of the soils, in the CTLs, respectively).
VIII
The EC50 values recorded and the corresponding 95% confidence intervals obtained for both contaminants on the aqueous tests and on soil tests proved the repeatability of the test procedures as they fit in the same range of values. The results recorded, following the OECD 201 standard protocol, showed that M. inermum was more sensitive than freshwater green microalgae, reinforcing the importance of including tests with species from the soil, to prevent an underestimation of the risks to the overall soil biota. Additionally, M. inermum displayed a similar or a lower sensitivity to the reference substances tested when exposed to them in the artificial soil. These results, highlight the role of soil components in the bioavailability of contaminants, and subsequently the importance of this test procedure, for assessing the risks of contaminants, in more realistic exposure scenarios, to prevent overestimation of risks.
KeyWords: soil microalga, Micractinium inermum, reference substances, new ecotoxicological test procedure
IX
Resumo
As microalgas formam uma componente importante da microflora do solo, representando até 27% da comunidade microbiana total do solo. Este grupo de organismos do solo possui funções importantes no solo, como por exemplo: (i) contribuir para a formação do solo, sendo um dos primeiros colonizadores do leito de rocha, melhorando a sua estrutura; ii) promover o sequestro de carbono orgânico nos solos e iii) manter a fertilidade do solo. Apesar da importância do papel das microalgas nas funções do solo e na qualidade do solo, este grupo de organismos não é considerado no conjunto de espécies usadas para avaliar os riscos de contaminantes novos ou existentes para a biota do solo. Levando isso em consideração, espécies de microalgas foram isoladas de crostas biológicas do solo, recolhidas num solo português na região Centro do país, e foram geneticamente identificadas como Micractinium inermum, uma espécie Chlorophyta com distribuição mundial. Esta espécie foi então utilizada para acalçar o objetivo principal deste trabalho, ou seja, o desenvolvimento de um procedimento de teste ecotoxicológico com uma microalga
de solo, usando solo como substrato de teste.
Para atender a este objetivo principal, foram realizadas as seguintes tarefas específicas: 1) considerando que o solo é um habitat semi-aquático, a adaptação do protocolo padrão para testes de inibição de crescimento com microalgas de água doce e cianobactérias (OECD 201) foi testada para M. inermum. Cobre (II), utilizado como sulfato de cobre (II) anidro (CuSO4) e um herbicida, formulação concentrada solúvel contendo 28,85% de glifosato (GLY), o Roundup Max®, foram selecionados como substâncias de referência, dada a disponibilidade de dados de toxicidade para estes dois compostos. Com esta tarefa também se pretendeu comparar a sensibilidade das espécies do solo com as espécies de água doce comumente usadas em testes ecotoxicológicos. 2) Como segunda tarefa, foi desenvolvida uma metodologia de teste ecologicamente mais relevante, usando o solo artificial da OCDE.
Três testes independentes foram realizados para cada substância de referência, tanto seguindo o protocolo padrão existente como o desenvolvido neste estudo, após obtenção de curvas de crescimento para a espécie, tanto em meio aquoso BG11 como em solo artificial da OCDE. Curvas de crescimento foram úteis para estabelecer as durações de exposição (5 e 13 dias, em meio aquoso e solo, respetivamente) e os critérios de validação
X
dos testes (aumento de 14 e 100 vezes, na densidade celular e no teor de clorofila dos solos, nos CTLs, respetivamente).
Os valores de EC50 registados e os correspondentes intervalos de confiança a 95% obtidos para ambos os contaminantes nos testes aquosos e nos testes de solo, provaram a reprodutibilidade dos procedimentos de teste, uma vez que se encaixam na mesma gama de valores. Os resultados registados, seguindo o protocolo padrão da OECD 201, mostraram que M. inermum foi mais sensível que as microalgas verdes de água doce, reforçando a importância da inclusão de testes com espécies do solo, para evitar uma subestimação dos riscos à biota total do solo. Além disso, M. inermum apresentou uma sensibilidade semelhante ou menor para as substâncias de referência testadas quando expostas a elas no solo artificial. Isto demonstrou o papel dos componentes do solo na biodisponibilidade de contaminantes e, subsequentemente, a importância deste procedimento de teste, para avaliar os riscos de contaminantes, em cenários de exposição mais realistas, para evitar a sobrestimação dos riscos.
Palavras-chave: microalga de solo, Micractinium inermum, substâncias de referência, novo procedimento de teste ecotoxicológico
1
1. Introduction
1.1. Terrestrial microalgae
Algae are a polyphyletic group of organisms found in a wide variety of habitats, usually in damp places or in aquatic environments (Hoffmann, 1989; Shimmel et al. 1985) and play an important role in the equilibrium of aquatic ecosystems, being key players in primary productivity and biogeochemical cycles (Fayez et al. 2007, Wang et al. 2018). Although most green algae typically occur in aquatic environments, many species also live in terrestrial habitats (also considered as semi-aquatic habitats), representing a major component of the microbial flora, occurring on exposed aero-terrestrial interface zones (Holzinger et al. 2013, Rindi, 2011), where their ecological importance is remarkable. Mostly microscopic, the green algae benefit from their small size which gives them the ability to grow in diversified habitats (Lewis et al. 2004a), playing an important role in environmental carbon sequestration and being responsible for 50% of the total photosynthesis on the Earth (Renuka et al. 2018). Light is the major factor affecting algal growth, supplying the energy to support its metabolism (Nam et al. 2015a) and consequently its productivity (Simionato et al. 2013).
The term algae include all photosynthetic eukaryotes included in several Phylum of the Plantae kingdom, as for example Chlorophyta and Charophyta Phyla to which belong the green algae (Ruggiero et al. 2015)12. The colonization of terrestrial habitats by descendants of Streptophyta algae started about 470-450 million years ago and was one of the most important occurrences in the evolution of life on Earth (Becker et al. 2009).
The first compilation of a species list, including soil algae, was presented by Graebner (1895), describing communities of Northern Germany (Metting, 1981). Green algae compared to other algal groups have proven to be particularly prepared for colonizing terrestrial habitats (Gaysina et al. 2013) and based on molecular and morphological evidence, terrestrial algae derived from many independent terrestrial colonization events by different lineages of aquatic algae, both marine, and freshwater, evolving actively even in environments considered too hostile to support their existence (Lam et al. 2010). Therefore,
1http://algaevision.myspecies.info/node/3510, Last accessed on: 07/12/18
2
there is a wide variety of algae taxa recognized as terrestrial algae (Hoffmann, 1989; Lund, 1962; Shields, 1962) such as, Chlamydomonas (Pröschold et al. 2007; Pentecost 2002),
Chlorococcum infusion (Bold, 1930; Chae et al. 2016), Chlorella (Luo et al. 2010; Bock et
al. 2011), Scenedesmus sp. (Lewis et al. 2004b; Bahar et al. 2013), Klebsormidium sp. (Škaloud, 2014; Ryšánek et al. 2016), Desmococcus sp. (Paul, 2006; Broady, 1993)
Geminella terricola renamed as Interfilum sp. (Petersen, 1932; Graham et al. 2000;
Mikhailyuk et al. 2008) and recently found in soil, the species of the genera Micractinium (Luo et al. 2010).
Green algae occur in almost every habitat, including the most extreme ones (Starks et al. 1981) such as: i) extreme arid hot deserts (Kitzing et al. 2015; Fletcher et al. 2008; Lewis et al. 2004b); ii) polar regions (Ryšánek et al. 2016; Davydov, 2016; Holm-Hansen, 1964; Broady, 1996; Broady, 1993), where often are the only primary producers (Hoffmann, 1989); iii) mountain areas and rocks (Johansen et al. 2007; Bischoff, 1963); iv) tropical regions (Lam, 2010) and v) airborne (Sharma et al. 2007). In extreme habitats the occurrence of desiccation conditions, low nutrients availability, extreme temperatures, and UV radiation are common features, therefore prevent the loss of water and keep cellular homeostasis under stress is vital (Lin et al. 2014; Holzinger et al. 2016). In these conditions of great abiotic stress, terrestrial algae developed morphological and physiological adaptations and occupied sheltered microhabitats in which conditions are less severe (Hoffmann, 1989). Terrestrial algae also have the capacity to disperse in the air, resulting in different dispersion patterns and indicating that algae are likely to have a global distribution (Sharma et al. 2007).
Microalgae are an important component of the soil environment and perform several important functions. In nature, most microalgae are found in association with other aerobic or anaerobic microorganisms. In this symbiosis, the molecular oxygen from algal photosynthesis is used as an electron acceptor by bacteria to degrade organic matter (Subashchandrabose et al. 2011). These organisms contribute to soil formation as primary colonizers (Davey et al. 1993) and generate energy and matter fluxes, having a significant impact in soil carbon pool by contributing to the organic content of soils (Subashchandrabose et al. 2013). The existing information about the mechanisms used by terrestrial algae to prevent cellular damage is still scarce but it is known that terrestrial algae are able to survive in a wide temperature range and have developed several mechanisms to prevent and/or counteract the damage caused by UV radiation which is known to cause
3
inhibition and several types of damage in their photosynthetic apparatus, with the production of mycosporine-like amino acids (MAAs) and reactive oxygen species (ROS) (Rindi, 2011; Lin et al 2014). The production of mucilage and accumulation of osmotic active compounds, the maintenance of homeostasis during dehydration and regulation of water status are the most common anti-desiccation strategies (Holzinger, 2013; Holzinger, 2016). Proline, SOD (superoxide dismutase) and carotenoids may be some of the molecular components involved in the tolerance to desiccation in green algae (Lin et al., 2014) and also in ROS elimination. Other strategies to avoid stress are the ability to aggregate cells to form biofilms of several layers and the decrease of dispersion by aggregation with secondary colonizers (lichens, mosses) and soil particles. The outer layers are fully exposed to the environment and susceptible to damage and at the same time they effectively protect the cells underneath by their water-holding and by their filtering capacity of the excess radiation on the surface. Without the radiation “umbrella” offered by the pigmented species in the outer layer, the species in the inner layer would experiment high mortality (Sharma et al. 2007; Holzinger et al. 2016; Belnap, 2003).
Due to their high capacity for morphological and physiological adaptations to different environments, as previously mentioned, algae often act as pioneer microorganisms in terrestrial habitats (Lin et al. 2013), playing an important role for the establishment of other trophic levels (Nam et al. 2015b). Soil algae excrete growth-promoting substances and biologically active compounds such as enzymes and ions that can affect other components of soil communities, including plants (Hastings et al. 2014). These photosynthetic active microorganisms form an intimate association with the soil particles that exist within or just above the upper millimeters of the soil (Bérard et al. 2004) and with the existing communities, contributing to the formation and integrity of soils (Renuka et al. 2018). In natural conditions, filamentous soil algae and cyanobacteria like Klebsormidium sp., Lynbya sp., Nostoc sp., form multiple layer structures, because of their sticky mucilaginous sheaths, that glue soil particles together forming biological soil crusts (BSC) (Schulz et al. 2016).
Biological soil crusts are a great help in resisting desertification, boosting desert soil formation and changing nutrient circulation (Wu et al. 2013). Algae and cyanobacteria, two main components of BSC, play a critical role in the soil succession and contribute with organic matter towards soil formation, favoring conditions for further colonization by plants, lichens, mosses and vascular plants (Zhao et al. 2009). Generally, cyanobacteria colonize the soil surface during the early stages and green algae, lichen and moss crusts establish
4
over time (Zhang et al. 2017a). Thus, the degree of algae distribution in the soil profile varies and their role at particular stages of soil development and in different soils can be different (Rahmonov et al. 2007). Knowledge on the diversity and distribution of terrestrial microalgae in BSC still falls behind of that for marine and freshwater environments. The terrestrial environment is still one of the less studied biological resources (Arguelles et al. 2017).
The study of terrestrial algae is still a challenge since ecological parameters such as population density, biomass, and productivity are often difficult to evaluate (Hoffman, 1989; Kabirov et al. 2009). The current classification of green microalgae is characterized by the compromise between the concept of conventional and modern phylogenetic species (Gustavs et al. 2011). Modern classification systems are polyphasic incorporating not only morphological and ultrastructural features but also molecular genetics in species identification (Wojciechowski et al. 2013). As a result, the molecular phylogeny of green algae expanded rapidly as molecular approaches were applied in their taxonomic identification (Lewis et al. 2004a). Even though the majority of the recently described terrestrial green algae have been isolated from various extreme habitats, since are more attractive for current biodiversity research, terrestrial microalgae from temperate regions in Europe have been described using the polyphasic approach (Barcytė et al. 2017).
1.2. Terrestrial Ecotoxicology
Terrestrial ecosystems are known to provide a complex range of essential ecosystem services regulated by soils (Chagnon et al. 2015). The soil is one of the fundamental components for supporting life on Earth and the processes that occur within soil drives the ecosystem and global functions (Jeffery et al. 2010). Over the years soil has had multiple definitions, according to the Soil Science Society of America, from a soil scientist’s perspective, soil is the layer of generally loose mineral and organic material that is affected by physical, chemical and/or biological processes at or near the planetary surface and usually holds liquids, gases, and biota. The soil ecosystem also performs numerous functions and services, ranging from providing food to filtering the water being also used as a platform for human activities, a potential source of vital products, such as antibiotics and the habitat of a great biodiversity of species (Es van, H., 2017; Jeffery et al. 2010). Thus, the contamination of this resource has become a global environmental, economic and
5
societal problem (Nam et al. 2015b). The degradation of soils due to various anthropogenic stress factors is alarming (Filser et al. 2008). Depending on the habitat and mobility, terrestrial organisms may be more or less exposed to chemicals present in the topsoil layer (van Gestel, 2012).
The study of the toxic effects that chemical substances have on soil populations and communities, as well as the analysis of their multiple interactions in ecosystems, are the focus of the multidisciplinary field of ecotoxicology and has gained a fundamental role in the regulation of existing and new chemical substances and in the assessment and management of environmental risks (Expósito et al. 2017). The degree of contamination is frequently evaluated by comparing the measured concentrations in the bulk soil with specific threshold values. Toxicity assays appeared as a complementary and a valuable tool for evaluating the hazard of chemical substances on the viability, growth, and reproduction of cells and organisms (Arouja et al 2011), as only organisms reflect the available fraction of contaminants in soils. In this context the development of more rapid and sensitive assays, become particularly important for evaluating the potential impact of contaminants on soil biota, aiming to establish threshold levels of toxicants to protect natural communities (Sabatini et al. 2009). With this purpose several standard protocols were developed for testing chemicals with different soil species, assessing both acute and chronic effects, namely with: i) soil invertebrates, using oligochaetes guidelines OECD 207, OECD 222, ISO 11268 (OECD, 1984; OECD, 2016; ISO, 2012), collembolans guidelines OECD 232, and ISO, 11267 (OECD, 2016; ISO, 2014) and enchytraeids OECD 220 and ISO 16387 (OECD, 2016; ISO 2014); ii) terrestrial plants OECD 227, OECD 208, ISO 22030, ISO 11269 (OECD, 2006; ISO 2005; ISO 2012) and, iii) microorganisms and microbial processes [ guidelines OECD 216; OECD 217; ISO 16072, ISO 17155; ISO 14238 (OECD, 2000; OECD, 2000; ISO, 2002; ISO 2012; ISO 2012)]. Despite all the available protocols, Van Gestel (2012), concluded that risk assessment processes would benefit from an extension of the available battery of toxicity tests for soils and by paying more attention to exposure, bioavailability, and toxicokinetics of contaminants, to better understand the long-term consequences of chemical exposure at an individual, population and community level. Further, it has been reinforced that apart from measuring the relevant parameters and meeting the environmental requirements, effective toxicity tests should be quick, simple and reproducible.
6
Algal toxicity tests are extensively applied to assess the effects of hazardous substances, especially of those intentionally applied in the environment, like pesticides, which may attain aquatic compartments, because of their sensitivity and ecological relevance in the food webs. The endpoint currently assessed in these tests is the inhibition of growth of an algal population, exposed to aqueous solutions of contaminants or to aqueous environmental matrices, under continuous light conditions for 72h, following the standard protocols OECD 201 or ISO 8692 (OECD, 2011; ISO 2012). Algae growth inhibition tests are also used to test soil elutriates or soil lixiviates, to assess the ability of this environmental matrix to retain contaminants preventing their mobility to the water resources (Antunes et al. 2010). However, until now, soil algae species, have never been proposed as possible test species on available guidelines to increase the representativeness of soil biota, in evaluations targeting the risks to this compartment. Further, more ecological relevant test methodologies, for soil algae have never been proposed and are needed given the importance of this group of soil organisms.
Soil algae are distributed in nearly all terrestrial environments, both on and beneath the soil surface (Nam et al. 2015b; Metting, 1981). Since it is impossible to cover species of all relevant groups of organisms for each environmental compartment, at least appropriate indicator species have to be identified for risk assessment purposes (Filser et al. 2008) as well as multiple relevant endpoints (Nam et al. 2016) to be measured on these bioindicators, that could reflect the mechanisms of toxicity of contaminants, as well as the vulnerability of the test species. Terrestrial habitats are poorly represented in toxicity testing and therefore, microalgae species isolated from soil would be another important representative group of the terrestrial ecosystems and can be potentially used (Dominguez-Morueco et al. 2014).
The sensitivity of microalgae to toxic substances is species-dependent (Expósito et al. 2017) and may vary by orders of magnitude (Levy et al. 2007) so there is a great degree of uncertainty in extrapolations between species of algae species. Thus the best approach is to incorporate a high number of species, representative of all major taxonomic groups when the aim is to protect the overall ecosystem (Lewis, 1995).
The terrestrial algae are a relatively neglected group among soil microbiota and there is limited information regarding the assessment of the impacts of toxic substances on this biological group (Bérard et al. 2004; Nydahl et al. 2015; Chae et al. 2016; Subaschandrabose et al. 2015). An interesting study was conducted by Nam et al. (2016), who suggested the paper-disc soil method as an easy-to-use approach. In this method, a
7
flat-bottom 24-well microplate was filled in with LUFA 2.2 soil that was contaminated with different concentrations of copper. A paper disc was placed in each well and pressed to adhere to the soil surface. The green microalgae Chlorococcum infusionum in the exponential phase was inoculated on each paper disc and incubated for 6 days. The results revealed that the copper inhibited the growth zone of C. infusionum, compared to the control, showing an EC50 value of 148 mg/kg. However, it was argued that the paper disc might act as a boundary layer between the contaminated soil and the soil algae, decreasing the bioavailability of the toxic through the binding of particles to the filter paper. This means that in direct contact with contaminated soil, soil microalgae tend to become more exposed to the toxicants, so a new approach should be conducted applying the soil algae directly to the contaminated soil in a given exposure time period, assessing the effects on the growth rate of algae through the chlorophyll content analysis. In this context, reference contaminants are used to assess the repeatability and reliability of test organism responses and of test procedures over a specific period of time, and further, they are used in inter-laboratory testing to judge comparability of results. Reference contaminants should also be used when new organisms or protocols are introduced in order to establish an expected dose-response relationship for a range of concentrations (Blaise et al. 2005, Orr et al. 1990). Like copper, other reference contaminants can be used, such as 3,5-dichlorophenol and potassium dichromate suggested in the OECD 201 guideline for testing chemicals with freshwater algae and cyanobacteria (OECD, 2006). Reference contaminants should be selected within the most widely used and concerning contaminants, for which a large set of data is already available
Several metals are essential micronutrients for all living organisms and play essential roles in fundamental biochemical processes that sustain life on Earth. Metals are persistent elements that cannot be destroyed or degraded, as they exist as natural constituents of the Earth’s crust (Huertas et al. 2014; Chen et al. 2016). However, with the increase of metal emissions from anthropogenic activities, related with their extraction and with their intentional use (e.g. copper is a widely used fungicide in agriculture) a large proportion of these emissions are accumulated in soils and sediments due to their high sorptive capacity (Arouja et al. 2011; Machado et al. 2015), where they attain toxic levels to biota, in several areas. For this reason, metals are one of the groups of contaminants more deeply assessed in the literature (Debelius et al 2009).
8
Microalgae exhibit high metal binding capacities due to the presence of polysaccharides, proteins or lipids on the surface of their cell walls which contain functional groups that can act as binding sites for metals (Priya et al. 2014; Yu et al. 1999). In the last few years, some studies have been carried out with different species of microalgae isolated from soil and different contaminants. Bahar et al. (2012) and Subramaniyam et al. (2016), for example, evaluated the toxicity of arsenite and iron in microalgae isolated from
uncontaminated soils, determining the EC50 values for both contaminants.
Subashchandrabose et al. (2015), evaluated the toxicity of cadmium using the microalgae,
Chlorococcum sp., isolated from a contaminated soil concluding that this species was less
sensitive, with an EC50 of 2.85 mg/L, when compared with the same species isolated from an uncontaminated site, with an EC50 value of 0.41 mg/L (Krishnamurti et al. 2004), indicating the ability of this species in developing tolerance to toxicants. The unique properties of green microalgae, such as high sensitivity and repeatability along with the need to increase the available taxa for use in toxicity bioassays, especially in terrestrial habitats, make them a suitable choice for the development of standardized bioassays of toxicity (Dominguez-Morueco et al. 2014). Copper (mainly in the form of copper sulfate), is a widely used fungicide in agriculture, contaminating not only soils but also the aquatic environment, posing a direct risk of toxic effects on the ecosystems (Kungolos et al. 2008). It is an essential micronutrient as it acts as a cofactor for a number of enzymes (Chen et al. 2016), but it can also be toxic at concentrations as low as 1 µg/L (Levy et al. 2007). At high concentrations Cu becomes toxic, inhibiting the growth of algae due to adverse effects on the same cellular processes for which it has an essential role, as enzymes activity and photosynthetic electron transport (Leal et al. 2016). In plants, at the cellular level, copper plays an essential role in signaling transcription and protein trafficking machinery and for a healthy plant growth, it needs to be acquired from the soil and transported throughout the plant. In higher concentrations, copper becomes toxic to the plant affecting the photosynthetic machinery, being the photosynthetic reaction center II (PSII) more sensitive to copper toxicity than the PSI, by inhibiting the oxygen formation. The tolerance to toxic levels might be related to potential mechanisms at the cellular level involved in detoxification (Yruela et al. 2005). In green algae, the process is the same, copper inhibits photosynthesis including mainly light reactions thus damaging the photosynthetic organisms (Chen et al. 2016). A study by Afkar et al. (2010), indicated that copper toxicity at high concentrations may be due to the oxidative potential of copper that causes reduction of chlorophyll,
9
decreases oxygen evolution rates and causes depletion of ATP by inhibition of enzymes involved in the cellular metabolism. A similar study indicated that for several metals, such as copper, the induction of ROS was observed for two different microalgae, to neutralize the oxidative damage induced by copper stress (Hamed et al. 2017). Copper is also one of the most studied metals in what regards their phytotoxic effects. Wang et al. (2018), for example, evaluated the photosynthetic and biochemical responses of Closterium ehrenbergii to copper as CuSO4 and CuCL2, determining the EC50 values of 0.202 mg/L and 0.245 mg/L, respectively. The data obtained showed a considerable decrease in pigment levels and photosynthetic efficiency, while inducing the generation of ROS in cells with increased exposure time, indicating a decrease in algal growth rate and cells density. Taking this and many other studies into account, data is available for comparing the sensitivity between species, and between species from different compartments.
The common practice to use copper in multiple anthropogenic activities such as mining, agriculture, several industries is affecting its concentrations in soils, which are attaining concerning levels. At the European Union levels, there is no common agreement on the copper threshold for the definition of risk but some legislation and several studies propose that a copper threshold value of 100 mg/kg should be assumed (Ballabio et al. 2018). In Portugal, the same level depends on soil pH, but the same threshold was proposed, for soils with pH between 5.5-7.0, by the law by decree 276/2009 (MAOTDR, 2009). However, Canadian and USEPA guideline values are lower, and Caetano et al. (2015) by using a Portuguese natural soil, for the derivation of a soil screening value for copper, proposed a limit of 31.8 mg/kg. Thus, in a study conducted by Panagos et al. (2018), using the Land Use Cover Area survey (LUCAS Topsoil), containing soil samples from 27 countries of European Union, collected between 2009-2012, showed that Cyprus is estimated to have the highest mean copper concentration in topsoil (53.41 mg/kg) and, in other regions such, Malta, west Greece, east Bulgaria, Catalonia and Algarve, the mean copper concentration is between 30-50 mg/kg. The data also showed that in Portugal, there was one site with a copper concentration higher than 100 mg/kg, being France the country with more sites surpassing this threshold. Although the application rate is not known, the model used by Panagos et al. (2018), resulted in a prediction of an average consumption of copper of 8.1 kg/ha for permanent crops, which is higher than the permit value (a maximum of 6.4 kg of Cu/ha). While countries such as Australia and the United States still have no
10
restrictions, this has led to some European governments to set limits to copper usage. The Netherlands, for example, has banned copper use (Mackie et al. 2012).
Herbicides account for about 40% of the pesticide amounts used worldwide (Sihtme et al. 2013) and their widespread application led to its accumulation in soils affecting aquatic (Ermis et al. 2009) and terrestrial biota, from microorganisms to plants and animals (Hackenberger et al. 2018). The effects of pesticides in soils can range from acute and chronic toxicity in organisms to many sub-lethal and indirect effects on behavior, functional roles, predator-prey relationships, and food web dynamics (Chagnon et al. 2015).
Glyphosate (GLY) under the trade name Roundup® was introduced in the market by Monsanto Company during the 1970’s (Pérez et al. 2011) and is the major herbicide used worldwide, being also used increasingly because approximately 80% of commercially grown genetically modified plants are tolerant to GLY (Nicolas et al. 2016). It is a systemic and non-selective herbicide that inhibits the activity of ESPS (5-enolpyruvyl shikimate-3-phosphate) synthase enzyme belonging to the shikimic acid metabolic pathway in plants resulting in the inhibition of the synthesis of some aminoacids and with subsequent growth inhibition (Sáenz et al. 1997). Apart from plants, the shikimate pathway is also present in fungi and bacteria, however, this does not necessarily mean that GLY operates as in plants.
The toxic effects of GLY have been studied in different aquatic organisms, by studying endpoints as growth, the content of pigments in tissues and photosynthesis parameters (Romero et al. 2011). Since algae is a sensitive taxonomic group to herbicides (Eugenio et al. 2018), the exposure of several freshwater algae species to glyphosate, for either 72h or 96h, provided a wide range of species-specific EC50 values, ranging from 3.5 mg/L to 55.9 mg/L (Annett et al. 2014), representative of the great variability in species sensitivity. Soil algae may be also endangered by herbicides since they are found on the surface of the soil and have a high potential for sorption and contact with herbicides (Wegener et al. 1985). Algae are known to be comparatively sensitive to many chemicals and the inclusion of these organisms in the test batteries has been shown to improve the capacity to predict the most sensitive ecosystem responses (Vendrell et al. 2009, Ermis et al. 2009). Tsui et al. (2003), concluded that algae, which have metabolic pathway similar to higher plants were, therefore, more susceptible to the herbicidal effect of IPA (isopropylamine) salt of GLY than non-photosynthetic organisms.
A study conducted by Nicolas et al. (2016), evaluated the toxicity of a commercial formulation containing GLY as an active ingredient on a soil filamentous fungus, Aspergillus
11 nidulans. The data indicated that GLY was toxic to this species at low doses, far below the
recommended agricultural application rates. However, the authors also noted that the residues presently found in soils are much lower than the tested concentrations. (Nicolas et al. 2016). In another study, Zabaloy et al. (2012), evaluated the potential effects of GLY treatments on microbial community structure and function in soils from two sites in Argentina, with the application of two different doses of GLY (0.15 and 150 mg/kg) incubated for 7 days. The results indicated that a single exposure of soils to GLY caused only minor changes to microbial community structure and function. However, microbial respiration in uncontaminated soils increased in response to GLY applications, reflecting a possible stress response of most sensitive species. Chronically exposed soils did not show this response, most likely due to the gradual elimination of most GLY sensitive species.
Another issue related with the use of GLY is the toxicity of aminomethlphosphonic acid (AMPA), one of the glyphosate’s main metabolites, which has been classified as persistent in soils, raising concern regarding the widespread use of this herbicide in agriculture and forestry. A study conducted by Dominguéz et al. (2016), evaluated the effect of AMPA on mortality and reproduction of the earthworm species Eisenia andrei using the standard available protocol. The results showed that AMPA had no significant effects on mortality except at the highest concentration (2500 µg/kg) tested in the chronic assay. The data, however, concluded that juveniles from parents exposed to contaminated soils had a reduced growth, something that can also limit their beneficial roles in key ecosystem functions.
Since the use of this herbicide is increasing its accumulation on soils, it is important to address its impacts on sensible soil communities, such as of microalgae, which have important soil functions. Effect-related research, which has addressed pesticides and herbicides in a rather constant proportion of published papers for more than 20 years does not reflect the actual number of active ingredients applied in the United States and Europe (Köhler et al. 2013). In European soils the information on the effect of herbicides is fragmented and outdated and more studies with non-target species are urgently needed to support the authorization of these compounds based on ecologically relevant information, to better protect ecosystems.
12
2. Aim of the thesis
Currently, soil microalgae are not taken into account in the battery of standard ecotoxicological assays, for assessing the risks of new and existing contaminants to soil biota. Thus, it is of utmost importance to develop and validate a new test procedure that can potentially be standardized in the future by competent organizations, and this was the main goal of this thesis. To accomplish this main objective, the following specific objectives were pursued:
To perform the genetic identification of one terrestrial microalgae species isolated from soil biological crusts (SBC);
To perceive if the standard guideline OECD 201 (OECD, 2006) for testing the effects of chemical substances in freshwater algae and cyanobacteria can be used for testing terrestrial microalgae and cyanobacteria and to depict the adaptations required;
To perceive if the soil microalgae species is more sensitive than the freshwater species, thus supporting the relevance of performing ecotoxicological tests with soils species;
To develop a new test procedure for exposing the soil microalgae to chemical substances, copper (Cu) in the form of Copper (II) Sulfate Anhydrous (CuSO4) and the herbicide glyphosate (GLY), in particular of its commercial formulation RoundUp ULTRA Max®, which contains 360 g/L of GLY or 28.85% (p/p) in the artificial OECD soil, to improve the ecological relevance and thus increase the realism of these tests for predicting the risks to soil communities.
13
3. Material and Methods
3.1. Microalgae isolation and culture conditions
Biological soil crust samples were collected from the surface of the soil (geographical coordinates 40°26’37.15’’N/ 8°26’33.03’’W). The samples were placed in a 50.0 mL falcon tube and taken to the laboratory. In the laboratory, using the binocular magnifier (Motic), some of the greener areas of the collected BSC samples were selected and were grown in sterilized Erlenmeyer’s with 20.0 mL of a liquid medium, appropriate for the growth of photosynthetic microorganisms, the BG11 medium (Rippka et al. 1992), whose composition can be found in Annex A. The working cultures were placed in an orbital shaker at 100 rpm, at 24 ± 2 °C, photoperiod of 16hL:8hD hours and a light intensity of 65 µmol m-2s-1 provided by 30W cool-white fluorescent lamps. Isolation and purification were performed by serial dilutions of liquid cultures and by applying the streak plating method using agar BG11 medium (with 1.5% agar) (Temraleeva et al. 2016), previously autoclaved at 121 °C, 1 bar and for 30 min, to isolate different microalgae species. The plates were incubated at 24 ± 2 °C, for 2 to 3 weeks and the morphology of the colonies was inspected under optical microscopy. From the different isolates, one green microalgae species was selected for being used as test species in soil ecotoxicological tests. Thus, therein in this section, only the work performed with this species will be described.
Liquid cultures of the isolated microalgae were prepared in 50.0 mL sterile Erlenmeyer flasks containing BG11 medium with air-permeable stoppers covered with aluminum foil, by inoculating a single colony removed from the plates with a loop, and by dipping and shaking the loop in the medium. Cultures were incubated in an orbital shaker under the same conditions described above for 15 days (figure 1). All the procedures were carried out under aseptic conditions in a laminar flow chamber previously sterilized with ultraviolet light for 15 minutes.
14
Figure 1 - Inoculum of the green microalgae from the BSC, day 1 (a) and after 15-days of growth (b).
3.2. Genetic Identification of the BSC selected microalgae
3.2.1. DNA extraction
The Maxwell® 16 System (Promega Corporation, USA) was used to extract the genomic DNA, following the protocols provided by the manufacturer and the extracted DNA was stored at -20°C until PCR amplification.
3.2.2. PCR amplification
To identify the isolated species genomic DNA was subjected to PCR amplification using a set of primers designed for the partial amplification of the 18S and ITS regions (Internal Transcribed Spacer) of rDNA from algae as shown in figure 2. The two pairs of primers used for PCR amplification of the rRNA gene are described in table 1. All reactions were carried out using a Bio-Rad MJ Mini™ Thermal Cycler. For each PCR reaction, the final volume was 20 µL, containing 10 µg of DNA template, 0.4 µM of each forward and reverse primers and 10 µL of NZYTaq 2x Green Master Mix (NZYtech, Lisbon, Portugal). The volume was completed with ultrapure water. The PCR thermal cycling conditions were as follows: initialization at 95°C for 5 min, followed by 30 cycles of denaturation at 94°C for 30s, annealing at 52°C for 30s, elongation at 72°C for 2 min and a final extension at 72°C for 7
15
min, followed by hold step at 4°C. The PCR products were checked on 0.8% (p/v) agarose gel electrophoresis following the protocol described by Maniatis et al. (1982) using 1x TAE buffer [Tris-acetate (0.04M); EDTA (0.001M)] (Sambrook and Russell, 2001) with 0.75 µL of Green Safe (NZYtech, Lisbon, Portugal) to allow the visualization of DNA bands under UV light. NZYDNA Ladder VIII (NZYtech, Lisbon, Portugal) was used as molecular size markers.
Figure 2 - Representative scheme of the 18S rDNA, the hybridization sites of the primer pairs used for PCR amplification and the expected size of the amplified fragments.
Table 1 – Sequences of the specific primers for the amplification of the 18S rRNA gene and the corresponding size of the
amplified fragments.
Primers Sequence (5’ to 3’) Size (bp) Reference
NS7m (Forward) 5’-GGCAATAACAAGTCTGT-3’ 1300 Mikhailyouk et al. 2008 LR1850 (Reverse) 5’-CCTCACGGTACTTGTTC-3’ NS1 (Forward) 5’-GTAGTCATATGCTTGTCTC-3’ 1200 18L (Reverse) 5’-CACCTACGGAAACCTTGTTACGACTT-3’
3.2.3. DNA purification and sequencing
The DNA fragments amplified (please see section 2.2.2.) were separated in an electrophorese agarose gel (0.8%), observed using an UV-transilluminator (Molecular Imager® Gel Doc™ XR System, BioRad) and extracted from the gel by excision with a razor blade. The purification of the PCR products was carried out with NZYGelPure Kit (NZYtech, Lisbon, Portugal), following the manufacturer’s instructions. Then, samples were re-run in
16
an agarose gel to confirm the integrity. Finally, DNA concentration was quantified by measuring the absorbance at 260 nm, and DNA purity was calculated using the relation between the absorbance at 260 nm and 280 nm (OD260/OD280) using a microplate reader (Thermo Scientific™ Multiskan™ GO). The DNA concentration was calculated using the following Beer-Lambert law equation [1] (Swinehart et al. 1962).
𝐴𝑏𝑠 = ℰ ∗ 𝑙 ∗ 𝑐 [1] Where,
ℰ - absorptivity (50 ng.cm/µL)
l – path length of the beam of the light through the material sample c – concentration of DNA
The DNA fragments were sent to STAB Vida (Lisbon) for sequencing and the DNA
sequences obtained were aligned using CLUSTAL program
(https://www.ebi.ac.uk/Tools/msa/clustalo/), analyzed by using the Basic Local Alignment Search Tool (BLAST) (http://ww.ncbi.nlm.nih.gov/BLAST/), performing a comparative search against the database of existing sequences.
3.3. Ecotoxicological tests in aqueous medium following available
standard protocol for microalgae
3.3.1. BSC microalga growth curves in a liquid medium
For the purpose of determining the BSC microalga growth curves in liquid medium, two representative culture media were tested for comparison: the BG11 medium and the MBL medium whose detailed composition can be found in Annex A. An aliquot of 1 mL of the working culture was spread in a plate with agar BG11 medium (with 1.5% agar). The plate was incubated for 2 weeks at 24 ± 2 °C, photoperiod of 16hL:8hD hours and a light intensity of 65 µmol m-2s-1 provided by 30W cool-white fluorescent lamps. A colony from the plate was then inoculated in both 25 mL of MBL and 25 mL of BG11 media in an orbital shaker at 100
17
rpm, at 20 ± 2 °C, under continuous illumination with a light intensity of 65 µmol m-2s-1 provided by 30W cool-white fluorescent lamps for 5 days. The cultures in both media were incubated in the same conditions as described above, for more 15 days, and were performed in triplicate. In order to analyze if it was necessary to adjust the exposure duration previewed in the standard protocol available for freshwater microalgae testing (OECD, 2006) the growth curve of the microalga isolated from the BSC was determined. Aliquots of 1.5 mL were collected from each culture replicate, over 10-days, in sterile conditions using a laminar flow chamber. The aliquots were collected for microtubes, after a good homogenization of each Erlenmeyer and for each one, the optical density at 440 nm was measured and the number of cells per mL was counted using and Neubauer chamber and an optical microscope (MOTIC BA310). The procedure described was performed three times each one with three replicates to evaluate the repeatability of the growth curve. The growth parameter followed (cell’s density) is expressed as a mean ± standard deviation.
3.3.2. Reference substances test solutions
In order to assess the sensitivity of the isolated microalga from BSC, test solutions of both reference substances selected were prepared. The chosen reference substances were copper (Cu) in the form of Copper (II) Sulfate Anhydrous (CuSO4) and the herbicide glyphosate (GLY), in particular of its commercial formulation RoundUp ULTRA Max®, which contains 360 g/L of GLY or 28.85% (p/p). The copper concentrations used were [0.30; 0.24; 0.14; 0.08; 0.05; 0.03] mgCu/L diluted in BG11 medium and the GLY concentrations were [7.32; 5.86; 4.69; 3.75; 3.0; 0.75] mgGLY/L. The range of concentrations for both copper and GLY were obtained with range finding tests.
3.3.3. Ecotoxicological test in BG11 medium with the BSC microalga
The ecotoxicological tests with the reference substances followed the standard protocol OECD No. 201 for the freshwater algae and cyanobacteria, growth inhibition test (OECD, 2006).
18
For this purpose, 400 µL of the BSC microalga from the working culture was inoculated in a 250 mL Erlenmeyer with 150 mL of BG11 medium and incubated in a shaker at 100 rpm, 20 ± 2 °C and under continuous illumination with a light intensity of 65 µmol m-2s-1, provided from 30W cool-white fluorescent lamps for 4 days. The tests were conducted in 24-well microplates and each one was filled with 900 µL either of the test solution (at different concentrations) or of the BG11 medium in the controls (CTLs) and 100 µL of the BSC microalga inoculum (figure 3). The number of cells in this inoculum was previously counted, by using a Neubauer chamber, and it was diluted to obtain a cell’s density of 105 cells/mL. The initial cells density in each well of the microplates was 104 cells/mL. The tests were conducted under the same conditions above described for the working cultures and the inoculum preparation. Growth inhibition tests were conducted for 5 days and four replicates (in four different wells of the microplates) were prepared for each concentration of the reference substances tested. The 24-well microplates were placed on an orbital shaker during the test period, at 130 rpm, to minimize sedimentation, and its place in the orbital shaker was changed every day to ensure equal light conditions to all the plates. At the end of the test, the cell’s density in each well was counted as previously described and algae growth rate was calculated by using the following equation [2] (OECD, 2006). The procedure described was performed three times each one with four replicates to evaluate the repeatability of the ecotoxicological test. The growth parameter followed (cell’s density) is expressed as a mean ± standard deviation.
µ𝑖−𝑗 =
ln 𝑋𝑗− ln 𝑋𝑖
𝑡𝑗− 𝑡𝑖 (𝑑𝑎𝑦
−1) [2]
Where,
µi-j – average specific growth rate from time i to j; Xi – biomass at a specific time i;
19 Figure 3 - Microplates incubated in the orbital shaker at 130 rpm (a) and example of a 24-well after a 5-days of incubation period (b). Each line of wells has the four replicates for the CTL and for two of the tested concentrations. The wells of the last column and of the last line were filled with water to reduce evaporation.
3.4. Ecotoxicological tests in soil with the BSC microalga
3.4.1. Standard artificial soil
The standard artificial soil, called OECD soil was used as a test substrate for developing a more ecological relevant methodology for the ecotoxicological test with the BSC microalga. This soil is composed by a mixture of 70% fine quartz sand, 20% kaolin clay and 10% of finely ground sphagnum peat. The pH of the mixture was adjusted to 6.0 ± 0.5 by adding calcium carbonate (OECD, 1984). The soil pH was measured with a pH probe (Jenway 2510) in a 1:5 (w/v) soil: water suspension. The maximum water holding capacity (WHCmax) was calculated following an adaptation of the standard protocol (ISO, 2008) and was measured as follows: samples of the soil were placed in flasks (3 replicates), which bottom was replaced by a filter paper and then immersed for 3 h in water. Then, the flasks were placed over absorbent paper for free draining for 2 h and the saturated soil was weighed. The soil was dried for 24 h, at 105 °C and weighed again and the average WHCmax was calculated.
20
3.4.2. BSC microalga growth curves in soil
To determine the optimum exposure time for the soil ecotoxicological test with the BSC microalga, growth curves for the species were obtained. The inoculation of the microalga in the soil was performed on sterile, disposable plastic Petri plates of 90x15 mm. To each Petri plate was added 12g of OECD soil which was moistened with the volume of BG11 necessary to adjust the WHCmax to 100% (approx. 2.5 mL).
The BSC microalga inoculum was prepared as described in section 2.1, the number of cells was counted and adjusted by dilution to 107 cell/mL. To each plate 1.0 mL of inoculum was spiked on the soil with a micropipette, ensuring that the inoculum was homogeneously distributed on the soil surface. All the procedure was carried out in aseptic conditions (figure 4). The initial inoculum concentration of 107 cell/mL was chosen based on previous tests.
Figure 4 - Petri plate with an OECD soil layer. Top view (a) and side view (b). Soil inoculation with the BSC microalga (c).
The Petri plates were incubated at 24 ± 2 °C under photoperiod 16hL:8hD, light intensity of 125 µmol m-2s-1 provided from 30W cool-white fluorescent lamps for 13 days (figure 5). Three replicates (3 Petri plates) were prepared as described and left to rest for 2h and then for each one, the soils were thoroughly mixed and placed in a 50.0 mL falcon tube for
21
immediately chlorophyll a quantification, in order to determine the initial content provided by the inoculum added to the soil. The remaining replicates were collected after 4, 6, 8, 11 and 13 days and the same procedure was performed. Each Petri plate was daily rehydrated with 1.0 mL of the BG11 medium by using a sterilized Pasteur pipette, during the 9 days of growth. The procedure described was performed three times each one with three replicates to evaluate the repeatability of the growth curve. The growth parameter followed (chlorophyll a content) is expressed as a mean ± standard deviation.
Figure 5 – Petri plate plates with OECD soil incubated for obtaining BSC microalga growth curves.
3.4.3. Pigment content
The quantification of the chlorophyll a content of the OECD soil, inoculated with the BSC microalga, was based on Nam et al. (2015). Soil samples were thoroughly mixed and placed in a 50.0 mL falcon tubes. Afterward, 5.0 mL of methanol 100% (v/v) were added to each sample ensuring that the entire soil was drowned. The tubes were vortexed for 10 seconds. The chlorophyll a extraction was made in the dark to prevent its degradation. To simplify the process, the tubes were covered with aluminum foil and placed in an orbital shaker at ± 230 rpm for at least 2 h. After, the tubes were centrifuged (Centrifuge 5804R, Eppendorf) at 11,000 rpm for 10 min. The supernatant was transferred to a 1.5 mL microtubes and placed in a centrifuge for 5 minutes at 13,000 rpm. The supernatant was measured at 663 nm in a
22
spectrophotometer. If necessary, the extracts were diluted with 100% (v/v) methanol. A blank test was performed using BG11 medium instead of algal suspension.
The chlorophyll a content was calculated using the following equation [3] (Meeks and Castenholz, 1971): 𝐶 (𝜇𝑔 𝑚𝐿) = 𝑂𝐷663𝑛𝑚 ∗ 12,7 ∗ 𝐷𝐹 Where, C – concentration (µg/mL) OD – optical density at 663 nm DF – dilution factor
3.4.4. Preparation of test solutions
For the ecotoxicological test on the soil the two test solutions of both reference substances selected were prepared according to the section 2.3.1. However, different concentrations for both substances were used. The copper concentrations used were [0.51; 0.25; 0.13; 0.06; 0.03] mg Cu/gsoil diluted in BG11 medium and the GLY concentrations were [5.86; 4.69; 3.75; 3; 0.75] mg GLY/gsoil. The range of concentrations for both Cu and GLY were obtained with range finding tests.
3.4.5. Ecotoxicological test in the OECD soil and with the BSC microalga
The ecotoxicological test in the soil was performed on sterile, disposable plastic Petri plates of 90x15 mm. To each Petri plate was added 12g of OECD soil which was moistened with the amount in volume of BG11 necessary to adjust the WHC to 100% (approx. 2.5 mL). Then 1.0 mL of the test substance (for the different concentrations) were added homogenously through the soil in the proper concentrations and left to stabilize for 24 hours. The BSC
23
microalga inoculum was prepared as described in section 2.1, the number of cells was counted and adjusted by dilution to 107 cell/mL. To each plate 1.0 mL of inoculum was spiked on the soil with a micropipette, ensuring that the inoculum was homogeneously distributed on the soil surface. All the procedure was carried out in aseptic conditions, as shown in figure 4. The Petri plates (treatments and control) were incubated at 24 ± 2 °C under photoperiod 16hL:8hD, light intensity of 125 µmol m-2s-1 provided from 30W cool-white fluorescent lamps for 13 days. The initial sample was left to rest for 2h and then thoroughly mixed and placed in a 50.0 mL falcon tube for chlorophyll a quantification. After the 13-days of exposure (determined based on growth curves), the same process for chlorophyll a content (please see section 2.4.2.) was made for all the soil samples. The procedure described was performed three times each one with three replicates to evaluate the repeatability of the ecotoxicological test.
3.5. Statistical analysis
The average growth rate and the average percentage of inhibition towards the CTL for each concentration of the reference substances tested were calculated and are presented with the corresponding standard deviation. For each test, the data was analyzed for the homogeneity of variances and normality of data by using the Levene’s test and by the Shapiro-Wilk test, respectively. One-Way ANOVA was used to test for significant differences in microalga growth rate between the concentrations of each reference substance tested, followed by a Dunnet test to look for differences from the CTL. A significance level of 0.05 was used for all tests. When ANOVA assumptions were not met, the Kruskal-Wallis non-parametric test was used to support the One-Way ANOVA test. The EC50 was calculated using non-linear interpolation methods of regression analysis with the statistical program STATISTICA version 13.3. The growth curves of the microalga, both in liquid and soil medium were obtained by fitting a non-linear sigmoidal 4PL, X is log(concentration) model to data, using the software GraphPad Prism version 6.
24
4. Results
4.1. Identification of the BSC selected microalga
4.1.1. Morphological characterization of the microalga
The morphological characterization of the microalga species isolated from BSC collected in a Portuguese soil was performed under an optic microscopic observation as shown in figure 6. This unicellular green alga is characterized by spherical to ovoid cells, arranged in colonies when the concentration in the medium increases.
Figure 6 – General aspect of the morphology of the cells of the soil microalga, at the end of the isolation process with a 100X amplification under optical microscopy.
4.1.2. Genetic identification of the BSC selected microalga
Genomic DNA of the BSC selected microalga was amplified by PCR using primers for 18S rRNA and ITS1 (Internal Transcribed Spacer 1). The PCR products, with molecular sizes in agreement with the expected,1300 bp and 1700 bp, respectively (figure 7), were sequenced.
25 Figure 7 - Electrophoretic separation of the DNA fragments, amplified by PCR using the pair of primers (1) NS7m/LR1850 and (2) NS1/18L.
.
The BLASTn analyses of the sequences obtained showed a 98% identity with the genera Micractinium, in particular with the species Micractinium inermum. The corresponding BLAST (figure 8) and sequences are provided in Annex B.
Figure 8 - BLAST results for the sequences with the primers (a) NS7 LR1850+LR1850, (b) NS7 LR1850+NS7m, (c) NS1+18L and (d) NS1 18L+NS1 obtained showing a homology of 98% with Micractinium inermum.
1 2