www.biogeosciences.net/10/3963/2013/ doi:10.5194/bg-10-3963-2013
© Author(s) 2013. CC Attribution 3.0 License.
Biogeosciences
Geoscientiic
Geoscientiic
Geoscientiic
Geoscientiic
Responses of soil respiration and its temperature/moisture
sensitivity to precipitation in three subtropical forests in southern
China
H. Jiang1,2, Q. Deng1,3, G. Zhou1, D. Hui4, D. Zhang1, S. Liu1, G. Chu1, and J. Li1
1Key Laboratory of Vegetation Restoration and Management of Degraded Ecosystems, South China Botanical Garden, Chinese Academy of Sciences, Guangzhou, 510650, China
2Graduate University of Chinese Academy of Sciences, Beijing, 100049, China
3Key Laboratory of Aquatic Botany and Watershed Ecology, Wuhan Botanical Garden, the Chinese Academy of Sciences, Wuhan 430074, China
4Department of Biological Sciences, Tennessee State University, Nashville, TN 37209, USA
Correspondence to:Q. Deng (dengqi@scib.ac.cn)
Received: 26 October 2012 – Published in Biogeosciences Discuss.: 8 November 2012 Revised: 5 May 2013 – Accepted: 9 May 2013 – Published: 18 June 2013
Abstract.Both long-term observation data and model
sim-ulations suggest an increasing chance of serious drought in the dry season and extreme flood in the wet season in south-ern China, yet little is known about how changes in precip-itation pattern will affect soil respiration in the region. We conducted a field experiment to study the responses of soil respiration to precipitation manipulations – precipitation ex-clusion to mimic drought, double precipitation to simulate flood, and ambient precipitation as control (abbr. EP, DP and AP, respectively) – in three subtropical forests in southern China. The three forest sites include Masson pine forest (PF), coniferous and broad-leaved mixed forest (MF) and mon-soon evergreen broad-leaved forest (BF). Our observations showed that altered precipitation strongly influenced soil res-piration, not only through the well-known direct effects of soil moisture on plant and microbial activities, but also by modification of both moisture and temperature sensitivity of soil respiration. In the dry season, soil respiration and its tem-perature sensitivity, as well as fine root and soil microbial biomass, showed rising trends with precipitation increases in the three forest sites. Contrarily, the moisture sensitivity of soil respiration decreased with precipitation increases. In the wet season, different treatments showed different effects in three forest sites. The EP treatment decreased fine root biomass, soil microbial biomass, soil respiration and its tem-perature sensitivity, but enhanced soil moisture sensitivity
in all three forest sites. The DP treatment significantly in-creased soil respiration, fine root and soil microbial biomass in the PF only, and no significant change was found for the soil temperature sensitivity. However, the DP treatment in the MF and BF reduced soil temperature sensitivity significantly in the wet season. Our results indicated that soil respiration would decrease in the three subtropical forests if soil mois-ture continues to decrease in the fumois-ture. More rainfall in the wet season could have limited effect on the response of soil respiration to the rising of temperature in the BF and MF.
1 Introduction
generated a definite conclusion. Precipitation manipulation experiments showed variable effects on soil respiration in different ecosystems (Borken et al., 2006; Zhou et al,. 2006; Sotta et al., 2007; Davidson et al., 2008; van Straaten et al., 2010, 2011; Cleveland et al., 2010; Talmon et al., 2011), and hence extensive research is necessary to make an accurate assessment of its global impacts.
The release of CO2 in soils is almost entirely from root respiration and microbial decomposition of organic matter (Rustad et al., 2000; Hui and Luo, 2004; Davidson and Janssens, 2006). Root activity and microbial decomposition are often subject to both environmental factors and sub-strate changes related to phenological processes (Orchard and Cook, 1983; Davidson et al., 1998; Högberg et al., 2001; Luo et al., 2001; Campbell et al., 2004; Curiel Yuste et al., 2004, 2007; Gaumont-Guay et al., 2006). Global and re-gional earth system modeling studies have identified temper-ature and moisture as major factors regulating soil respira-tion in terrestrial ecosystems (Raich and Potter, 1995; David-son et al., 1998; Reichstein et al., 2003; Gaumont-Guay et al., 2006; Heimann and Reichstein, 2008; Medvigy et al., 2010; Falloon et al., 2011). When effects of soil tempera-ture and moistempera-ture on soil respiration are simultaneously de-scribed, it is often assumed that their individual effects are plus, minus, and multiplicative (i.e., the product of two func-tions, one for each of the two variables) with the expecta-tion that the temperature sensitivity is independent of soil moisture (e.g., Bunnell et al., 1977; Fang and Moncrieff, 2001; Reichstein et al., 2002; Luo and Zhou, 2006; Jassal et al., 2008; see Table 1). Altered precipitation may influ-ence soil respiration through the direct effects of soil temper-ature and moisture change on plant and microbial activities, and/or by the indirect modification of model function (de-fined as changes in model parameters of soil respiration with soil temperature and moisture, or both) associated tempera-ture and moistempera-ture sensitivity of soil respiration. Shift of soil temperature/moisture sensitivity could be also attributed to the changes in phenological process, substrate or microbial activity (Zogg et al., 1997; Luo et al., 2001; Zhang et al., 2005; Noormets et al., 2008; Deng et al., 2012).
Numerous studies have focused on the responses of soil respiration to soil temperature. While many empirical mod-els have been developed to relate field-measured soil respi-ration and temperature (e.g., Lloyd and Taylor, 1994; David-son et al., 2000; Luo and Zhou, 2006), theQ10 model (R= R0exp(bT ), whereRis soil respiration,T soil temperature, and parameterR0 basal soil respiration whenT =0, andb is related to soil temperature sensitivity (Q10=exp(10b)) still remains the most widely used one (e.g., Cox et al., 2000; Bond-Lamberty and Thompson, 2010; see section 1 in the Table 1). Both experimental and modeling studies have shown that temperature sensitivity of soil respiration varied seasonally (Lloyd and Taylor, 1994; Xu and Qi, 2001), and decreased under warming treatment (Luo et al., 2001; Co-nant et al., 2008). Moreover, Davidson and Janssens (2006)
reported the “intrinsic” temperature sensitivity acts this way from basic biokinetics. Thus, many ecosystems and global models tried to use variable Q10 values with temperature (Lloyd and Taylor, 1994). Several authors indicated that sea-sonal variation of temperature sensitivity was also associ-ated with soil moisture (Xu and Qi, 2001; Curiel Yuste et al., 2003; Almagro et al., 2009), but the results were mostly based on the observations of seasonal variation, which may often be confounded by other factors such as temperature and phenological processes (Luo et al., 2001; Curiel Yuste et al., 2004; Wang et al., 2010). Direct evidence of the precipita-tion impacts on temperature sensitivity under precipitaprecipita-tion manipulations is still lacking (Davidson et al., 2006; Jassal et al., 2008; Craine and Gelderman, 2011; Suseela et al., 2012). Unlike temperature, no convincible and agreeable conclu-sions have been drawn for the response of soil respiration to soil moisture. In general, soil respiration increases with the rising of soil moisture when soil water holding capac-ity is still in its lower stage, but will slow down or decrease when soil moisture increases to some degree (Ilstedt et al., 2000; Hui and Luo, 2004; Deng et al., 2011). In practice, however, probably due to the confoundedness by the seasonal correlation between soil moisture and temperature, or pheno-logical processes, the relationships between field-measured soil respiration and soil moisture can been derived using ei-ther linear, logarithmic, hyperbolic or quadratic equation in different ecosystems (Luo and Zhou, 2006; see section 2 in the Table 1). These empirical models were often thought to be capable of extrapolating soil respiration variations under the future climate change (Falloon et al., 2011). It is still unclear whether the soil moisture functional coefficients, or soil moisture sensitivity, could remain constant under climate change, particularly precipitation treatments (Hui and Luo 2004; Liu et al., 2009; Misson et al., 2010).
has decreased significantly (Zhou et al., 2011). Model simu-lations in this region suggested an increasing chance of seri-ous drought in the dry season and extreme flood in the wet season in the future (Zhou et al., 2011). The changing pre-cipitation pattern may have a significant impact on the soil carbon emission of subtropical forests in southern China, but it has not been well studied.
We conducted a precipitation manipulation experiment in subtropical forests in southern China to study the responses of soil respiration to altered precipitation. We selected three common forests along a moisture gradient at the Dinghushan Nature Reserve (DNR), established three precipitation treat-ments in each forest site, and measured soil respiration. Pre-cipitation was controlled automatically through interception– redistribution systems to establish precipitation exclusion (EP), double precipitation (DP) treatments in addition to the ambient precipitation (AP) as a control (Borken et al., 2006; Zhou et al., 2006). Previous work in these forest sites has shown significant exponential relationships of soil respira-tion with soil temperature, and significant positive linear re-lationships of soil respiration with soil moisture even though soil moisture was relatively high in the region (Tang et al., 2006). However, precipitation manipulation with increased precipitation had no effects on soil respiration in two of the three forest sites (Deng et al., 2012). We suspected that such equally strong effects were probably due to high seasonal correlation between soil moisture and temperature or phe-nological processes. In this study, we focused on the sea-sonal responses of soil respiration to altered precipitation in the three subtropical forest sites, and fitted respiration mea-surements to both soil temperature and moisture for each season. We hypothesized that precipitation treatments would alter soil respiration though the effects of moisture change on plant and microbial activities. Moreover, we would test whether the responses of soil respiration to precipitation al-teration varied seasonally and differed among the three for-est sites. Associated with shifts in plant and microbial activi-ties, we further hypothesized that altered precipitation would lead to functional change, and in turn modify soil mois-ture/temperature sensitivity in the three forest sites. More specifically, we expected that the responses of soil temper-ature/moisture sensitivity to precipitation treatments varied seasonally and differed among the three forest sites.
2 Materials and methods
2.1 Site description
This study was conducted at the Dinghushan Nature Re-serve (DNR), located in the center of Guangdong Province in southern China (112◦13′39′′–112◦33′41′′E, 23◦09′21′′–
23◦11′30′′N). Climate in the region is typical south
sub-tropical monsoon climate, with mean annual temperature of 21.4◦C, and total annual precipitation of 1956 mm, of which
nearly 80 % falls in the hot–humid wet/rainy season (April– September) and 20 % in the dry season (October–March) (Wu et al., 1982). The bedrock is sandstone and shale. Soils are classified as Oxisols with a pH of 4.0–4.9.
Three common subtropical forest sites (at elevations rang-ing from 150 to 300 m, less than 500 m from one another and facing the same slope direction) at the DNR were se-lected including a coniferous Masson pine forest (PF), a conifer and broadleaf mixed forest (MF), and a monsoon evergreen broadleaf forest (BF). The three forest sites also represented forests in early, mid-, and advanced successional stages in the region (Peng and Wang, 1995). The PF (ap-proximately 22 ha), originally planted by local people in the 1950s, was dominated byPinus massonianain the tree layer andBaeckea frutescens,Rhodomyrtus tomentosa, and Dicra-nopteris linearisin the shrub and herb layers. The MF (ap-proximately 557 ha) was developed from artificial pine for-est with a gradual invasion of some pioneer broadleaf species through natural succession. The upper canopy of the commu-nity is dominated bySchima superba,Castanopsis chinensis, andCraibiodendron scleranthumvar.kwangtungense. Arti-ficial disturbances have not occurred in the MF for about 100 yr. The BF (approximately 218 ha) located in the central area of the reserve was dominated byCastanopsis chinensis, Cryptocarya concinna,Schima superba, andMachilus chi-nensis without anyPinus massoniana. No disturbance was recorded for the past 400 yr in the BF (Wang and Ma, 1982; Shen et al., 2001). Stand characteristics of the three forest sites have been reported in Deng et al. (2012).
2.2 Experimental design
Table 1.Review of soil respiration models with soil temperature and moisture.
Functions References
Section 1: Temperature functions
R=R0ebT Van’t Hoff (1884);
Lloyd and Taylor (1994)
R=aeE/rT Arrhenius (1898)
R=R10e(E/283.15rT )(1−283.15/T ) Lloyd and Taylor (1994)
R=a+bT Rochette et al. (1991)
R=R0e(bT+cT2) O’Connell (1990)
R=a(T+10)b Kucera and Kirkham (1971) R=R10+a(T+10)2 Holthausen and Caldwell (1980) R=1/(a+b−((T−10)/10)) Jenkinson (1990)
Section 2: Moisture functions
R=a+cM Tang et al. (2006)
R=aM2+cM+d Doran et al. (1991) R=a(M−Mmin)(Mmax−M)c Mielnick and Dugas (2000) R= −aln(−ψ )+c Orchard and Cook (1983);
Davidson et al. (2000) R=exp(−ea−cM) Janssens et al. (2001) R=a(W−d)/(c+W−d) Liu et al. (2002)
Section 3: Combined functions including both temperature and moisture
R=acMebT Gulledge and Schimel (2000) R=aebT−(M−c)2 Gullege and Schimel (2000) R=aebTM/(M+c) Gullege and Schimel (2000) R=(aecM)eb(T−10) Lavigne et al. (2004)
R=a±bW T Wildung et al. (1975)
R=aebT(M−Mmin)(Mmax−M)c Mielnick and Dugas (2000)
R=aMcTb Qi et al. (2002)
R=(W/(a+W ))(b/(b+W ))cd(T+10)/10 Bunnel et al. (1977);
Schlentner and Van Cleve (1985) R=f (M)f (T ) Reichstein et al. (2002)
R=(aM+c)ebT Reichstein et al. (2002) R=(aM2+cM+d)ebT Reichstein et al. (2002)
Ris soil respiration (µmol CO2m−2s−1);R0andR10are basal soil respiration whenT=0and 10◦C, respectively;Tis soil temperature (◦C);Mis volumetric soil moisture (% vol.);Wis gravimetric soil moisture (g kg−1);ψis soil water potential;f (M)andf (T )are the functions of soil respiration with
temperature and moisture, respectively;Eis defined as the activation energy (kJ mol−1);ris universal gas
constant (8.314 J mol−1K−1); a, b, c and d are the functional coefficients.
2.3 Soil respiration, temperature and moisture
measurements
Five PVC soil collars (80 cm2 in area and 5 cm in height) were permanently installed 3 cm into the soil in each plot in November 2006. The distance between adjacent collars was more than 50 cm. Soil respiration was measured three times a month in 2007 using a Li-6400 infrared gas an-alyzer (Li-COR, Inc., Lincoln, Nebraska, USA) connected to a Li-6400-09 soil respiration chamber (9.55 cm diameter) (Li-COR, Inc., Lincoln, Nebraska, USA). The measurements were made between 9.00 a.m. and 12.00 a.m. local time. Pre-vious work at the DNR forests has demonstrated that soil
respiration chamber during the soil respiration measurement. Volumetric soil moisture of the top 5 cm soil layer was mea-sured on five random locations within a treatment plot us-ing a PMKit (ICT, Australia; see http://www.ictinternational. com.au/soils.htm), which consists of three amplitude domain reflectometry (ADR) moisture probes (MP406) and a data logger (MPM160 meter).
2.4 Modeling soil respiration with soil temperature and
moisture
Previous work at the DNR forests demonstrated that soil res-piration increases exponentially with soil temperature and linearly with soil moisture (Tang et al., 2006; Deng et al., 2010, 2012). In this study, we focused on the seasonal re-sponses of soil respiration to altered precipitation in the three subtropical forest sites, and fitted soil respiration (R) to both soil temperature (T) and moisture (M) for each season. To develop the best regression model of soil respiration with soil temperature and moisture in the three subtropical forest sites, we conducted a thorough review of soil respiration models and fitted these univariate and bivariate models (Table 1). We evaluated these models using the coefficient of determination (R2) and bias in the distribution of the residues. The results indicated that either
R=(a1+c1M)exp(b1T ) (1) or
R=(a2+c2M+d2M2)exp(b2T ) (2) was the best regression model (Table A4). Thus, we fitted all data using these two regression equations. Model parameter b1andb2are related to temperature sensitivity, and theQ10 value can be estimated asQ10=exp(10b1) or exp(10b2). For soil moisture sensitivity, the parameterc1can be considered as soil moisture sensitivity in Eq. (1), as it reflects a relative change in soil respiration due to one unit change of soil mois-ture. In Eq. (2), we first estimated optimum soil moisture as Mo= −b2/2a2. Similar to theQ10value, we defined two soil moisture sensitivities as M10,1=f (Mo+10, T )/f (M, T0) and/orM10,2=f (M, T0)/f (M−10, T0), whereT0is aver-age soil temperature.
We further usedt test to determine the difference of the functional coefficients, as well as soil temperature and mois-ture sensitivity between seasons and among forest sites and precipitation treatments.
2.5 Soil microbial biomass and fine root biomass
measurements
To determine soil microbial biomass carbon, soil samples (0–20 cm depth) were collected in February, May, August and November of 2007. Each time, two samples of six cores (2.5 cm diameter) were randomly collected from each plot in
the three forest sites. After removing roots and plant residues, the composite samples were immediately sieved through a 2 mm mesh sieve. The soil microbial biomass carbon was calculated using the fumigation–extraction method (Vance et al., 1987).
To measure fine root biomass (diameter≤3 mm), we also randomly collected soil corns (0–20 cm depth) in February 2007 using a 10 cm diameter stainless-steel corer, and three more times in April, August and October of 2007. Each time, two samples were randomly collected from each plot in the three forest sites. The fine roots were separated by washing and sieving, dried at 60◦C for 48 h and weighed.
2.6 Statistical analysis
Soil respiration and soil temperature in a plot were calculated as the means of five collar measurements. Soil moisture was calculated as the mean of five measurements at random loca-tions in a plot. We used the repeated measure analysis of vari-ance (ANOVA) to test the differences in soil respiration rate, soil temperature and soil moisture among forest sites, precip-itation treatments, and seasons. Tukey’s multiple comparison test (HSD, honestly significant difference) was conducted if significant effects of forest ecosystem types, precipitation treatments or seasons were found. Similar ANOVAs were also used to test the differences in fine root and soil micro-bial biomass among forest sites, precipitation treatments, and seasons. Tukey’s multiple comparison test (HSD) was con-ducted if significant effects of forest ecosystem types, pre-cipitation treatments or seasons were found. For soil respi-ration models, linear and nonlinear regression methods were applied. All data analyses were carried out using the SAS software version 9.1 (SAS Institute Inc., Cary, NC, USA).
3 Results
3.1 Soil temperature and soil moisture
Among the three forest sites, soil in the PF was significantly warmer than those in the other two forest sites (p <0.05). No significant difference in soil temperature was found be-tween MF and BF (p >0.05). In all the three forest sites, soil temperature in the dry season was significantly lower than those in the wet season (p <0.05) (Fig. 1). The mean val-ues of soil temperature in the wet season were 24.7, 23.2 and 23.2◦C for the PF, MF and BF, respectively. Mean soil
tem-peratures in the dry season were 18.7, 16.4 and 16.3◦C for
the PF, MF and BF, respectively. Precipitation treatments did not significantly change soil temperature in all three forest sites (Tables 2 and 3).
2
3
4
5
6
7
8
9
0
1
2
3
4
5
1 4 7 10
S
o
il
r
es
p
ir
at
io
n
(
µ
m
o
lC
O2
m
-2 s-1)
0 1 2 3 4
1 4 7 10 1 4 7 10 1
S
o
il
m
o
is
tu
re
(
%
V
o
l.
)
0 10 20 30 40 50
S
o
il
t
em
p
er
at
u
re
(
oC
)
0 5 10 15 20 25 30 35
DP AP EP
Month
BF MF
PF
BF MF PF
BF MF
PF
Month Month
Fig. 1.Seasonal dynamics of soil temperature at 5 cm depth, soil moisture of the top 5 cm soil layer, and soil respiration rate under different precipitation treatments at the DNR forests. The treatments are as follows: precipitation exclusion (EP), AP ambient precipita-tion (AP), and double precipitaprecipita-tion (DP). The forests are as follows: broadleaf forest (BF), mixed forest (MF), and pine forest (PF). Error bars are standard deviations.
in all three forest sites (p <0.05) (Fig. 1). The mean val-ues of soil moisture in the wet season were 22.0 % vol. for PF, 35.4 % vol. for MF and 36.0 % vol. for BF, respectively. The mean values of soil moisture in the dry season were 9.4 % vol. for PF, 19.0 % vol. for MF and 17.8% vol. for BF, respectively. Soil moisture was significantly influenced by precipitation treatments (Table 2). Compared to the controls, soil moisture decreased under the EP treatments by about 58.6 % for PF, 43.2 % for MF and 44.4 % for BF, respec-tively, in the wet season, and about 34.0 % for PF, 25.7 % for MF and 23.8 % for BF, respectively, in the dry season (Ta-ble 3). The soil moisture increased under the DP treatment by approximately 3 % vol. in all three forest sites, compared to the controls (Table 3).
3.2 Soil respiration
Among the three forest sites, soil respiration was signifi-cantly greater in the BF and MF than those in the PF (p < 0.05). There were no significant differences of soil respira-tion between the BF and the MF (p >0.05). In all three for-est sites, soil respiration in the wet season was significantly higher than those in the dry season (p <0.05) (Fig. 1). In the controls, mean soil respiration in the wet season was 2.79, 3.85 and 3.89 µmol CO2m−2s−1 in the PF, MF and
Table 2. Significance of the effects of forest type, precipitation treatment, season and their interactions on soil respiration rate, soil temperature, and soil moisture, respectively, at the Dinghushan Na-ture Reserve, China. Numbers areF values. Stars indicate the level of significance (∗=P <0.05,∗∗=P <0.01).
Source Soil Soil Soil
respiration temperature moisture
Forest 90.39∗∗ 45.99∗∗ 584.99∗∗
Treatment 204.28∗∗ 0.15 663.33∗∗
Forest×Treatment 6.39∗∗ 0.13 2.10
Season 972.46∗∗ 1173.16∗∗ 1907.69∗∗
Forest×Season 23.76∗∗ 3.64∗ 21.64∗∗ Treatment×Season 35.17∗∗ 0.76 168.19∗∗
Forest×Treatment 0.87 0.12 0.32 ×Season
BF, respectively, and in the dry season was 1.62, 1.82 and 1.83 µmol CO2m−2s−1in the PF, MF and BF, respectively.
Soil respiration was influenced significantly by precipita-tion treatments, and varied among the three forest sites and seasons (Table 2). In the BF and MF, annual mean soil respi-ration was not significantly different between the DP and AP plots (Table 3). Only in the PF, soil respiration increased by 18.0 % under the DP treatment (Table 3). The EP treatment decreased the soil respiration significantly in all three forest sites (Table 3). Annual mean soil respiration rates under the EP treatment decreased by 25.9 %, 27.2 %, and 50.9 % in the BF, MF, and PF, respectively (Table 3). Soil respiration in the dry season increased significantly with increasing precipita-tion treatments in all three forest sites (Fig. 2). In the wet season, soil respiration was decreased by the EP treatment in all three forest sites (Fig. 2). However, the DP treatment increased soil respiration by 19.2 % in the PF only (Fig. 2).
3.3 Relationships of soil respiration with soil
temperature and moisture
Similar to previous work at the DNR forest sites, soil respi-ration (R) was significantly related to soil temperature (T) with an exponential function, and to soil moisture (M) with a linear regression model (Tables A1 and A2; Figs. A1 and A2). However, some residuals in the linear function with soil moisture exhibited non-linear behavior, especially in the wet season (Fig. A4). Thus, we also developed non-linear re-gressions of soil respiration with soil moisture. Among all tested soil moisture models (Table 1), the moisture func-tion describing the quadratic distribufunc-tion was selected (Ta-ble A3). Compared to the linear function, the quadratic func-tion slightly improved model fitting and its residual distribu-tion (Fig. A5).
Table 3.Mean annual values of soil temperature at 5 cm depth, soil moisture of the top 5 cm soil layer, soil respiration rate, fine root biomass and soil microbial biomass under ambient precipitation (AP), precipitation exclusion (EP) and double precipitation (DP) treatments from the broadleaf forest (BF), the mixed forest (MF) and the pine forest (PF) (mean±standard error). Mean values in each forest site within a row with a different superscripted letter have significant treatment differences atα=0.05 level.
Variable Broadleaf forest (BF) Mixed forest (MF) Pine forest (PF)
EP AP DP EP AP DP EP AP DP
Soil temperature 19.92a 19.87a 19.77a 19.76a 19.82a 19.66a 22.02a 21.85a 21.69a
(◦C) ±0.77 ±0.78 ±0.82 ±0.82 ±0.83 ±0.85 ±0.65 ±0.67 ±0.69
Soil moisture 16.91a 27.05b 29.36c 17.21a 27.45b 30.24c 7.75a 16.02b 18.82c (% vol.) ±0.69 ±1.79 ±1.93 ±0.68 ±1.62 ±1.67 ±0.33 ±1.24 ±1.41 Soil respiration 2.14a 2.89b 2.95b 2.08a 2.86b 2.97b 1.10a 2.24b 2.64c (µmol CO2m−2s−1) ±0.12 ±0.20 ±0.17 ±0.12 ±0.20 ±0.17 ±0.05 ±0.13 ±0.16 Fine root biomass 99.52a 139.23b 138.31b 94.89a 131.83b 131.90b 66.42a 101.21b 124.90c (g m−2) ±8.69 ±4.92 ±4.82 ±9.27 ±5.73 ±4.41 ±5.22 ±5.00 ±4.47 Soil microbial biomass 448.32a 558.57b 594.78b 218.40a 371.37b 402.71b 194.40a 293.33b 355.41c (g kg−1soil) ±21.39 ±24.83 ±31.78 ±19.58 ±21.12 ±19.60 ±16.99 ±22.70 ±19.16
0 10 20 30 40
BF MF PF
M
ea
n
s
o
il
m
o
is
tu
re
(
%
V
o
l.
)
0 10 20 30 40
Dry season
Wet season a
b c
a b
c
a b c
a b
c
a b
c c
b
a
0 1 2 3 4 5 EP
AP DP
BF MF PF
M
ea
n
s
o
il
r
es
p
ir
at
io
n
r
at
e
(
µ
m
o
l
C
O2
m
-2 s-1)
0 1 2 3 4
a b c
a b c
a b c Dry season
Wet season
b b b b
c a
a
a b
Fig. 2.Mean values of soil moisture and soil respiration rate un-der different seasons and different precipitation treatments at the DNR forests. The treatments are as follows: precipitation exclusion (EP), ambient precipitation (AP), and double precipitation (DP). The forests are as follows: broadleaf forest (BF), mixed forest (MF), and pine forest (PF). Error bars are standard errors.
together. We tested different models in Table 1 and found that a combined exponential and linear function or a combined exponential and quadratic function was the best regression model (Reichstein et al., 2002; Deng et al., 2012; Table A4). Including soil temperature and moisture into the soil respi-ration model significantly improved model fittings including higher coefficient of determination (R2) and reduced bias in the distribution of the residue (Tables 4 and 5; Figs. A6 and A7).
In both Eqs. (1) and (2), there were no significant differ-ences of soil temperature sensitivity in the control among the three forest sites in the dry season (Tables 4 and 5). In the wet season, soil temperature sensitivity was significantly greater
in the BF and MF than those in the PF (Tables 4 and 5). Soil moisture sensitivity in both dry and wet season was signifi-cantly greater in the PF than those in the BF and MF (Table 4; Fig. 3). There was no significant difference of soil moisture sensitivity between the BF and the MF (Table 4; Fig. 3). Soil moisture sensitivities in the wet season were significantly lower than those in the dry season in all three forest sites (Ta-ble 4; Fig. 3), but the soil temperature sensitivities showed an opposite trend (Tables 4 and 5).
For precipitation treatments, the EP treatment significantly reduced temperature sensitivities of soil respiration, and in-creased soil moisture sensitivities in both the wet season and dry season in all three forest sites (Table 4; Fig. 3). The DP treatment in the wet season significantly decreased the tem-perature sensitivities in the BF and MF (Tables 4 and 5). In the dry season, there was no significant difference of temper-ature and moisture sensitivity of soil respiration between the DP and AP treatments in all three forest sites (Tables 4 and 5; Fig. 3).
3.4 Soil microbial biomass and fine root biomass
0 1 2 3 4
BF MF PF
S o il m o is tu re s en si ti v it y ( M1 0 ,1 )
BF MF PF
0 1 2 3 EP AP DP
BF MF PF
S o il m o is tu re s en si ti v it y ( M1 0 ,2 ) a b b a a b a a b b a b b a b b bb b b a b b b b b b b b b Dry season Dry season Wet season Wet season
Fig. 3.Moisture sensitivities of soil respiration (M10,1andM10,2) in Eq. (2) under different seasons and different precipitation treat-ments at the DNR forests. The treattreat-ments are as follows: precipita-tion exclusion (EP), ambient precipitaprecipita-tion (AP), and double precipi-tation (DP). The forests are as follows: broadleaf forest (BF), mixed forest (MF), and pine forest (PF). Error bars are standard errors. Eq. (2) and its coefficients are listed in Table 5. SeveralM10,2 val-ues were not calculated because some of soil moisture in the plots is less than 10 % vol.
Both soil microbial biomass and fine root biomass were significantly influenced by precipitation treatments, and var-ied among the three forest sites and seasons (Table 3). In the wet season, the DP treatment increased fine root biomass and soil microbial biomass by 16.5 % and 20.9 %, respectively, in the PF (Fig. 4). The EP treatment decreased fine root biomass and soil microbial biomass in all three forest sites (Fig. 4; Table 3). In the dry season, both fine root biomass and soil microbial biomass showed significant increasing trend with increasing precipitation treatments in the three forest sites (Fig. 4).
4 Discussion
4.1 Effects of precipitation treatments on soil
respiration
In the past three decades, seasonal precipitation pattern and intensity in the region have varied drastically, and soil mois-ture in forest sites has decreased significantly (Zhou et al., 2011). Many precipitation manipulation experiments have indicated that soil respiration often increased following wa-ter additions and decreased following precipitation exclusion (Harper et al., 2005; Borken et al., 2006; Zhou et al., 2006;
0 50 100 150 200
BF MF PF
F in e ro o t b io m as s (g m -2) 0 50 100 150 Dry season Wet season a b c a b c a b c a b c a b b b b a 0 200 400 600 800 EP AP DP
BF MF PF
S o il m ic ro b ia l b io m a ss ( g k g
-1 s
o il ) 0 200 400 600 a b c a b c a b c Dry season Wet season b b b b c a a a b
Fig. 4.Mean values of fine root biomass and soil microbial biomass under different seasons and different precipitation treatments at the DNR forests. The treatments are as follows: precipitation exclusion (EP), ambient precipitation (AP), and double precipitation (DP). The forests are as follows: broadleaf forest (BF), mixed forest (MF), and pine forest (PF). Error bars are standard errors.
Liu et al., 2009). Precipitation can influence soil respiration mainly by altering soil moisture, in turn influencing root res-piration and soil microbial decomposition (Davidson et al., 2000; Joffre et al., 20003; Williams, 2007). Our results also showed soil respiration was responsive to altered precipita-tion through the effect of soil moisture on plant and micro-bial activities. In this study, the EP treatment decreased soil respiration significantly throughout the year in all three for-est sites (Table 3; Fig. 2), accompanied by decreases in fine root and soil microbial biomass (Fig. 4). For the DP treat-ment, the responses of soil respiration varied between sea-sons and differed among the three forest sites. The DP treat-ment in the BF and MF increased soil respiration in the dry season only (Fig. 2). Even in the wet season, however, soil respiration in the PF showed a significant influence by the DP treatment (Fig. 2). Similar result was also reported in other studies (Talmon et al., 2011). In temperate grasslands, soil respiration responded to water addition at drier sites only (Risch and Frank, 2007). In Mediterranean-type ecosystems, responses of soil respiration to precipitation manipulations varied with seasons and years, depending on respective pre-cipitation amounts (Asencio et al., 2007; Chou et al., 2008). Results from a humid tropical forest indicated that soil respi-ration may be decreased under precipitation increase (Cleve-land et al., 2010).
Table 4.Relationships of soil respiration (R, µmol CO2m−2s−1)with soil temperature (T,◦C) and soil moisture (M, % vol.) using a
combined exponential and linear function (R=(a1+c1M)exp(b1T ), wherea1is parameter related to basal soil respiration when both T =0 andM=0; b1 andc1are parameters related to the temperature and moisture sensitivities of soil respiration, respectively) under different seasons and precipitation treatments at the DNR forests (parameter estimate±standard error). The treatments are as follows: precipitation exclusion (EP), ambient precipitation (AP), and double precipitation (DP). The forests are as follows: broadleaf forest (BF), mixed forest (MF), and pine forest (PF).R2is the coefficient of determination. Numbers in bold indicate the level of function fitting is significant (p <0.05). Different superscripted letters in each forest site within a column denote significant difference (p <0.05) among precipitation treatments.
Forests Treatments a1 b1 c1 R2
Wet season
BF EP 0.4723±0.1094 0.0421±0.0066a 0.0268±0.0106a 0.93
AP 0.6572±0.0842 0.0720±0.0056b 0.0017±0.0015b 0.95
DP 1.1751±0.1515 0.0535±0.0058a −0.0023±0.0021b 0.89
MF EP 0.4654±0.0952 0.0446±0.0067a 0.0234±0.0099a 0.95
AP 0.6164±0.0587 0.0735±0.0038b 0.0020±0.0011b 0.98
DP 1.0254±0.1427 0.0577±0.0054a −0.0008±0.0030b 0.92
PF EP 0.1366±0.0734 0.0039±0.0049a 0.1146±0.0181a 0.94
AP 0.3894±0.0957 0.0502±0.0109b 0.0184±0.0081b 0.89
DP 0.5085±0.1000 0.0583±0.0087b 0.0105±0.0044b 0.91
Dry season
BF EP −0.0262±0.1219 0.0217±0.0056a 0.0820±0.0106a 0.86
AP 0.5738±0.0602 0.0385±0.0038b 0.0219±0.0039b 0.93
DP 0.6766±0.0878 0.0393±0.0050b 0.0200±0.0055b 0.89
MF EP −0.0598±0.0460 0.0163±0.0025a 0.0837±0.0045a 0.98
AP 0.6102±0.1319 0.0338±0.0070b 0.0206±0.0084b 0.87
DP 0.9674±0.0498 0.0388±0.0028b 0.0051±0.0025b 0.95
PF EP −0.0075±0.0204 −0.0054±0.0115a 0.1435±0.0184a 0.56
AP 0.0682±0.1236 0.0315±0.0119b 0.0820±0.0204b 0.81
DP 0.2084±0.1628 0.0292±0.0129b 0.0772±0.0154b 0.75
seasonality (Figs. 1 and 2). In particular, soils moisture in the BF and MF was relatively high in the wet season, so that root respiration and microbial decomposition may not be subject to water limitation. In these two forest sites, indeed, we found that the fine root and soil microbial biomass under the DP treatment increased significantly in the dry season, but not in the wet season (Fig. 4). As a result, the DP treat-ment in the BF and MF did not increase soil respiration in the wet season. Soil in the PF contains more sand, less clay, and more gravel, and had lower ambient moisture content than those in the BF and MF. Trees in the PF were younger and smaller in biomass and leaf area index (LAI) (Zhang et al., 2006). Therefore, unlike the other two forest sites, fine root and soil microbial biomass in the PF were low, and even in the wet season were responsive to precipitation increase. Ac-cordingly, soil respiration under the DP treatment increased significantly throughout the year.
4.2 Effects of precipitation treatments on soil
temperature and moisture sensitivities
The magnitude of soil respiration feedback to climate change depends largely on model function, in particular soil tem-perature and moisture sensitivities related to carbon supply (Kirschbaum, 2010; Suseela et al., 2012). For example, in this study, the DP treatment increased soil respiration in the PF only (Table 3), which was attributed to its higher soil moisture sensitivity than those in the BF and MF (Table 4; Fig. 3). Similarly, the DP treatment increased soil respiration of the MF and BF in the dry season only, associated with their higher soil moisture sensitivity in the dry season (Ta-ble 4; Fig. 3).
Table 5.Relationships of soil respiration (µmol CO2m−2s−1)with soil temperature (◦C) and soil moisture (% vol.) using a combined
exponential and quadratic function (R=(a2M2+c2M+d2)exp(b2T ), whereRis soil respiration,T is soil temperature,Msoil moisture, anda2,b2,c2andd2the functional coefficients; especially theb2value can be directly considered as the parameter related to the temperature sensitivity of soil respiration) under different seasons and precipitation treatments at the DNR forests (parameter estimate±standard error). The treatments are as follows: precipitation exclusion (EP), ambient precipitation (AP), and double precipitation (DP). The forests are as follows: broadleaf forest (BF), mixed forest (MF), and pine forest (PF).R2is the coefficient of determination. Numbers in bold indicate the level of function fitting is significant (p <0.05). Different superscripted letters in each forest site within a column denote significant difference (p <0.05) among precipitation treatments.
Forests Treatments a2 b2 c2 d2 R2
Wet season
BF EP −0.0009±0.0034 0.0456±0.0081a 0.0778±0.1399 −0.0438±1.3076 0.93
AP −0.0002±0.0002 0.0744±0.0066b 0.0159±0.0176 0.3011±0.2817 0.96
DP −0.0007±0.0003 0.0504±0.0052a 0.0581±0.0249 0.2100±0.4241 0.92
MF EP −0.0023±0.0022 0.0431±0.0064a 0.1540±0.0903 −0.7866±0.8558 0.96
AP −0.0001±0.0002 0.0712±0.0051b 0.0063±0.0163 0.4512±0.2445 0.98
DP −0.0004±0.0006 0.0540±0.0055a 0.0303±0.0507 0.4403±0.8703 0.93
PF EP −0.0026±0.0062 0.0040±0.0051a 0.1617±0.1170 −0.0779±0.5269 0.94
AP −0.0004±0.0008 0.0484±0.0118b 0.0355±0.0387 0.2409±0.3594 0.90
DP −0.0005±0.0006 0.0553±0.0093b 0.0463±0.0345 0.1706±0.3663 0.91
Dry season
BF EP 0.0034±0.0053 0.0234±0.0062a −0.0625±0.1412 0.8828±0.8797 0.88
AP −0.0006±0.0009 0.0396±0.0044b 0.0451±0.0352 0.3498±0.3425 0.93
DP −0.0008±0.0012 0.0396±0.0053b 0.0588±0.0504 0.2750±0.5445 0.91
MF EP −0.0008±0.0018 0.0165±0.0046a 0.1067±0.0050 −0.2215±0.3259 0.98
AP −0.0006±0.0015 0.0379±0.0052b 0.0377±0.0628 0.4906±0.6512 0.87
DP −0.0007±0.0005 0.0387±0.0038b 0.0481±0.0242 0.6037±0.2676 0.96
PF EP −0.0108±0.0285 −0.0002±0.0110a 0.6881±0.4770 −1.6414±1.4094 0.67
AP −0.0009±0.0067 0.0364±0.0133b 0.1037±0.1368 0.0158±0.6583 0.82
DP 0.0099±0.0077 0.0335±0.0126b −0.1565±0.1753 1.6093±1.0399 0.75
treatment in all three forest sites (Tables 4 and 5). One of the reasons for the lower temperature sensitivity was that drought reduces contact among the substrate, the extracel-lular enzymes and the microbes involved in decomposition (Jassal et al., 2008). The EP treatment significantly reduced soil microbial biomass in all three forest sites (Fig. 4; Ta-ble 2). Another reason was that drought could reduce sub-strate supply (Davidson et al., 2006) by a decrease in pho-tosynthesis (Harper et al., 2005; Jassal et al., 2008), which decreases translocation of recent photosynthates to the rhi-zosphere (Högberg et al., 2001; Bhupinderpal-Singh et al., 2003). Significant decreases of fine root biomass were also revealed in our EP plots across all three forest sites (Fig. 4; Table 3).
We also found that the DP treatments in the BF and MF reduced temperature sensitivities in the wet season (Tables 4 and 5). This might be related to the decreases in soil aer-ation and soil oxygen concentraer-ation due to high soil mois-ture (Cleveland et al., 2010). Due to the subtropical mon-soon climate, forests at the DNR receive an abundance of heat, light, and water resources in the wet season (Ding et al., 2001). Soil respiration response to temperature in these
moist forests is often limited by soil oxygen concentration and substrate during the wet season (Schwendenmann and Veldkamp, 2005; Yan et al., 2009; Deng et al., 2011). In the PF where soil moisture was still low even in the wet season, enhanced soil moisture due to the DP treatment might have no effect on soil aeration and soil oxygen concentration, and hence did not change soil temperature sensitivity. Moreover, enhanced fine root biomass under the DP treatment may in-crease substrate supply (Högberg et al., 2001; Bhupinderpal-Singh et al., 2003), stimulate microbial activity (Fig. 4), and in turn offset the negative effect of the DP treatment on soil temperature sensitivity in the PF. It will be useful for fur-ther studies to evaluate effects of precipitation on plant pro-ductivity associated with soil respiration functional change. Similar to many previous studies (Boddy, 1983; Orchard and Cook, 1983; Davidson and Janssens, 2006), using a precipi-tation manipulation field experiment we found that tempera-ture sensitivity of soil respiration peaked at intermediate soil water content, and declined under both wetter and drier con-ditions.
rising trends with precipitation decrease in the three forest sites (Table 4; Fig. 3). Similarly, many studies have shown that, when soil moisture was within a site-specific threshold, soil temperature is typically a reliable predictor of soil respi-ration. In the presence of a drought, however, soil respiration is more sensitive to soil moisture (e.g., Moncrieff and Fang, 1999; Xu and Qi, 2001; Curiel Yuste et al., 2003; Davidson et al., 2006). The response mechanism of soil moisture sensi-tivity to precipitation change is still unclear. Two biological processes may help explain the shift in soil moisture sensitiv-ity in this study. First, fungi can tolerate greater water stress than can bacteria due to their filamentous nature (Holland and Coleman, 1987). Previous research has reported high fungal activity under drier and warmer soils, while high bac-teria activity under moister and colder soils (Zhang et al., 2005; Yuste et al., 2011). Shifts in soil microbial community structure could effect the water requirement for litter and soil organic matter decomposition, and alter moisture sensitivity of soil respiration. Second, root growth response to drought may compensate by enhancing water use efficiency and cap-turing water in deep soil under high water conditions (Es-peleta and Clark, 2007; Lima et al., 2010).
The findings of shifts in soil temperature and moisture sensitivities could have potential implications for climate-carbon modeling, as uncertainty remains regarding environ-mental controls over soil respiration. While much contro-versy surrounds the effect of warming on the temperature sensitivity of soil respiration (e.g., Luo et al., 2001; Conant et al., 2008; Reth et al., 2009), our results highlighted the relative importance of precipitation and seasonal variation in determining the responses of soil respiration to not only soil temperature, but also to soil moisture. Lower temperature sensitivity indicated that soil respiration would have limited response to climate warming. High moisture sensitivity un-der drought conditions indicated that soil respiration would decrease more strongly if soil moisture continues to reduce. Ecosystem modeling that does not include this change in soil temperature and moisture sensitivities with precipitation or seasonal variations may produce misleading conclusions (Heimann and Reichstein, 2008; Medvigy et al., 2010; Fal-loon et al., 2011).
4.3 Limitation of the study
In this study, we selected three typical forest ecosystems in the south of China and tested the effects of precipitation al-teration on soil respiration. One shortcoming of the exper-imental design was the plot size used. We decided the plot size based on the common practices in manipulation exper-iments, availability of adequate plots for building precipita-tion intercepprecipita-tion and redistribuprecipita-tion facility, and heterogene-ity of plots. While the 3 m×3 m plots were employed for drought treatments (EP), it is difficult to detect the whole ecosystem responses – mainly deep root respiration. Thus, the inferences regarding to the response of autotrophic respi-ration to drought should be read with caution. Further stud-ies are needed to draw rigorous conclusions regarding forest ecosystem responses using larger plots.
5 Conclusions
Table A1.Relationships of soil respiration rate (R, µmol CO2m−2s−1)and soil temperature at 5 cm depth (T,◦C) using an exponential
equation (R=R0exp(bT ), where parameterR0is basal soil respiration whenT=0, andb0is related to soil temperature sensitivity (Q10= exp(10b0)) (parameter estimate±standard error) under different seasons and precipitation treatments at the DNR forests. The treatments are as follows: precipitation exclusion (EP), ambient precipitation (AP), and double precipitation (DP). The forests are as follows: broadleaf forest (BF), mixed forest (MF), and pine forest (PF).R2is the coefficient of determination. Numbers in bold indicate the level of function fitting is significant (p <0.05). Different superscripted letters in each forest site within a column denote significant difference (p <0.05) among precipitation treatments.
Forests Treatments R0 b R2
Wet season
BF EP 0.6837±0.1056 0.0586±0.0064a 0.87
AP 0.6769±0.0858 0.0746±0.0053b 0.95
DP 1.1487±0.1505 0.0511±0.0054a 0.88
MF EP 0.6199±0.0831 0.0624±0.0056a 0.91
AP 0.6564±0.0612 0.0754±0.0039b 0.97
DP 1.0053±0.1214 0.0572±0.0050a 0.92
PF EP 0.8042±0.3401 0.0194±0.0169a 0.08
AP 0.4190±0.1448 0.0761±0.0136b 0.73
DP 0.5188±0.1358 0.0747±0.0103b 0.82
Dry season
BF EP 1.3226±0.3562 0.0099±0.0148a 0.02
AP 0.8427±0.1134 0.0466±0.0077b 0.70
DP 0.9193±0.1141 0.0487±0.0071b 0.75
MF EP 1.3687±0.4183 0.0044±0.0181a 0.01
AP 0.9274±0.1178 0.0407±0.0073b 0.67
DP 1.0236±0.0474 0.0420±0.0076b 0.74
PF EP 1.2596±0.4563 −0.0226±0.0193a 0.08
AP 0.6577±0.3624 0.0473±0.0284b 0.14
DP 0.7624±0.3799 0.0484±0.0260b 0.17
10 15 20 25 0
1 2 3 4 5
Soil temperature in the wet season (oC) 10 15 20 25 10 15 20 25 30
10 15 20 25
S
o
il
r
es
p
ir
at
io
n
r
at
e
in
t
h
e
w
et
s
ea
so
n
(
µ
m
o
l
C
O2
m
-2s -1)
0 1 2 3 4 5
Soil temperature in the wet season (oC) 10 15 20 25 10 15 20 25 30
10 15 20 25 0
1 2 3 4 5
Soil temperature in the wet season (oC) 10 15 20 25 10 15 20 25 30
BF BF BF
MF MF MF
PF PF PF
DP DP
10 15 20
0 1 2 3 4
DP Soil temperature in the dry season (oC)
10 15 20
DP
10 15 20 25
DP
10 15 20
S
o
il
r
es
p
ir
at
io
n
r
at
e
in
t
h
e
d
ry
s
ea
so
n
(
µ
m
o
l
C
O2
m
-2s -1)
0 1 2 3 4
Soil temperature in the dry season (oC)
10 15 20 10 15 20 25
10 15 20
0 1 2 3 4
Soil temperature in the dry season (oC)
10 15 20 10 15 20 25
BF BF BF
MF MF MF
PF PF PF
Fig. A1.Relationships of soil respiration rate (R, µmol CO2m−2s−1)and soil temperature at 5 cm depth (T,◦C) (exponential equation:R=
R0exp(bT )) under different seasons and different precipitation treatments at the DNR forests. The treatments are as follows: precipitation exclusion (EP), ambient precipitation (AP), and double precipitation (DP). The forests are as follows: broadleaf forest (BF), mixed forest (MF), and pine forest (PF). The equations are listed in Table A1.
Table A2.Relationships of soil respiration (R, µmol CO2m−2s−1)and soil moisture of the top 5 cm soil layer (M, % vol.) using a linear regression equation (R=a+cM, where parameterais intercept, basal soil respiration whenM=0; andcis slope of regression representing the soil moisture sensitivity of soil respiration) (parameter estimate±standard error) under different seasons and precipitation treatments at the DNR forests. The treatments are as follows: precipitation exclusion (EP), ambient precipitation (AP), and double precipitation (DP). The forests are as follows: broadleaf forest (BF), mixed forest (MF), and pine forest (PF).R2is the coefficient of determination. Numbers in bold indicate the level of function fitting is significant (p <0.05). Different superscripted letters in each forest site within a column denote significant difference (p <0.05) among precipitation treatments.
Forests Treatments a c R2
Wet season
BF EP −0.6482±0.2479 0.1682±0.0248a 0.74
AP 1.4607±0.8362 0.0675±0.0229b 0.30
DP 2.5073±0.6997 0.0335±0.0177b 0.18
MF EP −0.8731±0.4567 0.1758±0.0226a 0.79
AP 1.4781±0.9550 0.0669±0.0267b 0.28
DP 1.9409±1.0366 0.0498±0.0266b 0.18
PF EP 0.1316±0.0799 0.1284±0.0087a 0.93
AP 0.3426±0.3924 0.1110±0.0175a 0.72
DP 0.8289±0.5157 0.0977±0.0199a 0.60
Dry season
BF EP 0.1226±0.2360 0.1056±0.0171a 0.72
AP 0.8289±0.3192 0.0559±0.0176b 0.40
DP 0.8056±0.3928 0.0624±0.0195b 0.41
MF EP −0.0131±0.1226 0.1049±0.0085a 0.91
AP 0.6237±0.2462 0.0628±0.0127b 0.62
DP 1.1528±0.3307 0.0408±0.0151b 0.53
PF EP −0.0082±0.1827 0.1410±0.0292a 0.63
AP 0.3358±0.2893 0.1361±0.0298a 0.60
DP 0.4234±0.3040 0.1267±0.0258a 0.55
10 15 20 25 0
1 2 3 4
Soil moisture in the dry season (%Vol.)
10 15 20 25 5 10 15 20
EP 10 15 20 25
S
o
il
r
es
p
ir
at
io
n
r
at
e
in
t
h
e
d
ry
s
ea
so
n
(
µ
m
o
l
C
O2
m
-2s -1)
0 1 2 3 4
DP
Soil moisture in the dry season (%Vol.)
0 5 10 15 0 5 10 15
0 5 10 15
0 1 2 3
4 Soil moisture in the dry season (%Vol.)
10 15 20 25
AP
5 10 15 20
BF BF BF
MF MF MF
PF PF PF
20 30 40
0 1 2 3 4 5
Soil moisture in the wet season (%Vol.)
20 30 40 10 20 30
20 30 40
S
o
il
r
es
p
ir
at
io
n
r
at
e
in
t
h
e
w
et
s
ea
so
n
(
µ
m
o
l
C
O2
m
-2s -1)
0 1 2 3 4 5
Soil moisture in the wet season (%Vol.)
10 20 30
Linear equation
5 10 15
10 20 30
0 1 2 3 4 5
Quadratic equation Soil moisture in the wet season (%Vol.)
20 30 40 10 20 30
BF BF BF
MF MF MF
PF PF PF
Fig. A2.Relationships of soil respiration rate (R, µmol CO2m−2s−1)and soil moisture of the top 5 cm soil layer (M, % vol.) (linear regres-sion equation:R=a+cMand quadratic equation:R=a0M2+c0M+d0)under different seasons and different precipitation treatments at the DNR forests. The treatments are as follows: precipitation exclusion (EP), ambient precipitation (AP), and double precipitation (DP). The forests are as follows: broadleaf forest (BF), mixed forest (MF), and pine forest (PF). The equations are listed in Tables A2 and A3.
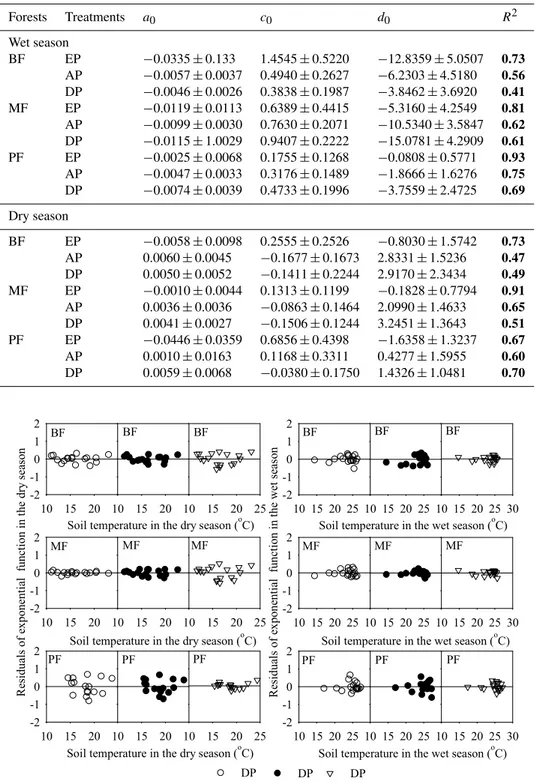
Table A3.Relationships of soil respiration (µmol CO2m−2s−1)and soil moisture of the top 5 cm soil layer (% vol.) using a quadratic function (R=a0M2+c0M+d0, whereRis soil respiration,Msoil moisture, anda0,c0andd0are constants) (parameter estimate±standard error) under different seasons and precipitation treatments at the DNR forests. The treatments are as follows: precipitation exclusion (EP), ambient precipitation (AP), and double precipitation (DP). The forests are as follows: broadleaf forest (BF), mixed forest (MF), and pine forest (PF).R2is the coefficient of determination. Numbers in bold indicate the level of function fitting is significant (p <0.05). Different superscripted letters in each forest site within a column denote significant difference (p <0.05) among precipitation treatments.
Forests Treatments a0 c0 d0 R2
Wet season
BF EP −0.0335±0.133 1.4545±0.5220 −12.8359±5.0507 0.73
AP −0.0057±0.0037 0.4940±0.2627 −6.2303±4.5180 0.56
DP −0.0046±0.0026 0.3838±0.1987 −3.8462±3.6920 0.41
MF EP −0.0119±0.0113 0.6389±0.4415 −5.3160±4.2549 0.81
AP −0.0099±0.0030 0.7630±0.2071 −10.5340±3.5847 0.62
DP −0.0115±1.0029 0.9407±0.2222 −15.0781±4.2909 0.61
PF EP −0.0025±0.0068 0.1755±0.1268 −0.0808±0.5771 0.93
AP −0.0047±0.0033 0.3176±0.1489 −1.8666±1.6276 0.75
DP −0.0074±0.0039 0.4733±0.1996 −3.7559±2.4725 0.69
Dry season
BF EP −0.0058±0.0098 0.2555±0.2526 −0.8030±1.5742 0.73
AP 0.0060±0.0045 −0.1677±0.1673 2.8331±1.5236 0.47
DP 0.0050±0.0052 −0.1411±0.2244 2.9170±2.3434 0.49
MF EP −0.0010±0.0044 0.1313±0.1199 −0.1828±0.7794 0.91
AP 0.0036±0.0036 −0.0863±0.1464 2.0990±1.4633 0.65
DP 0.0041±0.0027 −0.1506±0.1244 3.2451±1.3643 0.51
PF EP −0.0446±0.0359 0.6856±0.4398 −1.6358±1.3237 0.67
AP 0.0010±0.0163 0.1168±0.3311 0.4277±1.5955 0.60
DP 0.0059±0.0068 −0.0380±0.1750 1.4326±1.0481 0.70
DP DP
10 15 20 25 -2
-1 0 1 2
Soil temperature in the wet season (oC)
10 15 20 25 10 15 20 25 30
10 15 20 25
R
es
id
u
al
s
o
f
ex
p
o
n
en
ti
al
fu
n
ct
io
n
i
n
t
h
e
w
et
s
ea
so
n
-2 -1 0 1 2
Soil temperature in the wet season (oC)
10 15 20 25 10 15 20 25 30
10 15 20 25 -2
-1 0 1 2
Soil temperature in the wet season (oC)
10 15 20 25 10 15 20 25 30
BF BF BF
MF MF MF
PF PF PF
DP DP
10 15 20
-2 -1 0 1 2
DP
Soil temperature in the dry season (oC)
10 15 20
DP
10 15 20 25
DP
10 15 20
R
es
id
u
al
s
o
f
ex
p
o
n
en
ti
al
fu
n
ct
io
n
i
n
t
h
e
d
ry
s
ea
so
n
-2 -1 0 1 2
Soil temperature in the dry season (oC)
10 15 20 10 15 20 25
10 15 20
-2 -1 0 1 2
Soil temperature in the dry season (oC)
10 15 20 10 15 20 25
BF BF BF
MF MF MF
PF PF PF
Fig. A3.Residual plots for the models of soil respiration rate (R, µmol CO2m−2s−1)and soil temperature at 5 cm depth (T,◦C) (exponential
equation:R=R0exp(b0T )) under different seasons and different precipitation treatments at the DNR forests. The treatments are as follows: precipitation exclusion (EP), ambient precipitation (AP), and double precipitation (DP). The forests are as follows: broadleaf forest (BF), mixed forest (MF), and pine forest (PF).
20 30 40 -2 -1 0 1 2
Soil moisture in the wet season (%Vol.)
20 30 40 10 20 30
EP
20 30 40
R es id u al s o f li n ea r fu n ct io n i n t h e w et s ea so n -2 -1 0 1 2 DP
Soil moisture in the wet season (%Vol.)
10 20 30 5 10 15
10 20 30
-2 -1 0 1
2 Soil moisture in the wet season (%Vol.)
20 30 40
AP
10 20 30
BF BF BF
MF MF MF
PF PF PF
10 15 20 25 -2
-1 0 1 2
Soil moisture in the dry season (%Vol.)
10 15 20 25 5 10 15 20
10 15 20 25
R es id u al s o f li n ea r fu n ct io n i n t h e d ry s ea so n -2 -1 0 1 2
Soil moisture in the dry season (%Vol.)
0 5 10 15 0 5 10 15
0 5 10 15
-2 -1 0 1
2 Soil moisture in the dry season (%Vol.)
10 15 20 25 5 10 15 20
BF BF BF
MF MF MF
PF PF PF
Fig. A4.Residual plots for the models of soil respiration rate (R, µmol CO2m−2s−1)and soil temperature at 5 cm depth (T,◦C) (linear
regression equation:R=a+cM) under different seasons and different precipitation treatments at the DNR forests. The treatments are as follows: precipitation exclusion (EP), ambient precipitation (AP), and double precipitation (DP). The forests are as follows: broadleaf forest (BF), mixed forest (MF), and pine forest (PF).
20 30 40
-2 -1 0 1 2
Soil moisture in the wet season (%Vol.)
20 30 40 10 20 30
EP
20 30 40
R es id u al s o f q u ad ra ti c fu n ct io n i n t h e w et s ea so n -2 -1 0 1 2 DP
Soil moisture in the wet season (%Vol.)
10 20 30 5 10 15
10 20 30
-2 -1 0 1
2 Soil moisture in the wet season (%Vol.)
20 30 40
AP
10 20 30
BF BF BF
MF MF MF
PF PF PF
10 15 20 25 -2
-1 0 1 2
Soil moisture in the dry season (%Vol.)
10 15 20 25 5 10 15 20
10 15 20 25
R es id u al s o f q u ad ra ti c fu n ct io n i n t h e d ry s ea so n -2 -1 0 1 2
Soil moisture in the dry season (%Vol.)
0 5 10 15 0 5 10 15
0 5 10 15
-2 -1 0 1
2 Soil moisture in the dry season (%Vol.)
10 15 20 25 5 10 15 20
BF BF BF
MF MF MF
PF PF PF
Fig. A5.Residual plots for the models of soil respiration rate (R, µmol CO2m−2s−1)and soil moisture of the top 5 cm soil layer (M, % vol.) (quadratic equation:R=a0M2+c0M+d0)under different seasons and different precipitation treatments at the DNR forests. The treatments are as follows: precipitation exclusion (EP), ambient precipitation (AP), and double precipitation (DP). The forests are as follows: broadleaf forest (BF), mixed forest (MF), and pine forest (PF).
Table A4.Coefficient (R2)of measured soil respiration (R)to soil temperature (T )and moisture (M)using different combined models at the DNR forests with control plots.
Functions R2
BF MF PF
Dry season
R=(a1M+c1)eb1T 0.93 0.87 0.81
R=(a2M2+c2M+d2)eb2T 0.93 0.87 0.82
R=a3c3Meb3T 0.83
R=a4eb4T−(M−c
4)2
R=a5eb5TM/(M+c5) 0.91 0.70 0.84
R=(a6ec6M)eb6(T−10) 0.91 0.87 0.83
R=a7±b7W T 0.79 0.71 0.85
R=a8eb8T(M−Mmin)(Mmax−M)c8
R=a9Mc9Tb9 0.91 0.88 0.82
R=(W/(a10+W ))(b10/(b10+W ))c10d10(T+10)/10 0.73 0.63 0.76
Wet season
R=(a1M+c1)eb1T 0.95 0.98 0.89
R=(a2M2+c2M+d2)eb2T 0.96 0.98 0.90
R=a3c3Meb3T 0.92 0.87 0.74
R=a4eb4T−(M−c
4)2
R=a5eb5TM/(M+c
5) 0.93 0.87 0.75
R=(a6ec6M)eb6(T−10) 0.92 0.86 0.74
R=a7±b7W T 0.90 0.87 0.75
R=a8eb8T(M−M
min)(Mmax−M)c8
R=a9Mc9Tb9 0.92 0.87 0.75
R=(W/(a10+W ))(b10/(b10+W ))c10d10(T+10)/10 0.50 0.54 0.72
Blank in the table indicated that we could not fit soil respiration to soil temperature and soil moisture using this combined model.
10 15 20 25 -1.0
-0.5 0.0 0.5 1.0
Soil moisture in the dry season (%Vol.)
10 15 20 25 5 10 15 20
EP 10 15 20 25 -1.0
-0.5 0.0 0.5 1.0
Soil moisture in the dry season (%Vol.)
10 15 20 25 5 10 15 20
10 15 20 25
R
es
id
u
al
s
o
f
th
e
E
q
.
1
i
n
t
h
e
d
ry
s
ea
so
n
-1.0 -0.5 0.0 0.5 1.0
DP Soil moisture in the dry season (%Vol.)
0 5 10 15 0 5 10 15
10 15 20 25
R
es
id
u
al
s
o
f
th
e
E
q
.
2
i
n
t
h
e
d
ry
s
ea
so
n
-1.0 -0.5 0.0 0.5 1.0
Soil moisture in the dry season (%Vol.)
10 15 20 25 5 10 15 20
0 5 10 15
-1.0 -0.5 0.0 0.5
1.0 Soil moisture in the dry season (%Vol.)
10 15 20 25
AP
5 10 15 20
0 5 10 15
-1.0 -0.5 0.0 0.5 1.0
Soil moisture in the dry season (%Vol.)
0 5 10 15 0 5 10 15
BF BF BF BF BF BF
MF MF MF MF MF MF
PF PF PF PF PF PF
Fig. A6.Residual plots in the dry season for Eq. (1) (R=(a1+c1M)exp(b1T )) and Eq. (2) (R=(a2M2+c2M+d2)exp(b2T )) under different precipitation treatments at the DNR forests. The treatments are as follows: precipitation exclusion (EP), ambient precipitation (AP), and double precipitation (DP). The forests are as follows: broadleaf forest (BF), mixed forest (MF), and pine forest (PF).
20 30 40 -1.0
-0.5 0.0 0.5 1.0
Soil moisture in the wet season (%Vol.)
20 30 40 10 20 30
EP
20 30 40
-1.0 -0.5 0.0 0.5 1.0
Soil moisture in the wet season (%Vol.)
20 30 40 10 20 30
20 30 40
R
es
id
u
al
s
o
f
th
e
E
q
.
1
i
n
t
h
e
w
et
s
ea
so
n
-1.0 -0.5 0.0 0.5 1.0
DP Soil moisture in the wet season (%Vol.)
10 20 30 5 10 15
20 30 40
R
es
id
u
al
s
o
f
th
e
E
q
.
2
i
n
t
h
e
w
et
s
ea
so
n
-1.0 -0.5 0.0 0.5 1.0
Soil moisture in the wet season (%Vol.)
20 30 40 10 20 30
10 20 30
-1.0 -0.5 0.0 0.5
1.0 Soil moisture in the wet season (%Vol.)
20 30 40
AP
10 20 30
10 20 30
-1.0 -0.5 0.0 0.5 1.0
Soil moisture in the wet season (%Vol.)
10 20 30 5 10 15
BF BF BF BF BF BF
MF MF MF MF MF MF
PF PF PF PF PF PF
Fig. A7.Residual plots in the wet season for Eq. (1) (R=(a1+c1M)exp(b1T )) and Eq. (2) (R=(a2M2+c2M+d2)exp(b2T )) under different precipitation treatments at the DNR forests. The treatments are as follows: precipitation exclusion (EP), ambient precipitation (AP), and double precipitation (DP). The forests are as follows: broadleaf forest (BF), mixed forest (MF), and pine forest (PF).
Acknowledgements. This work was financially supported by
National Basic Research Program of China (No. 2009CB42110x), Strategic Priority Research Program – Climate Change: Carbon Budget and Relevant Issues of CAS (XDA05050205), Dinghushan Forest Ecosystem Research Station, and the National Science Foundation (0933958).
Edited by: J. Xiao
References
Allan, R. P. and Soden, B. J.: Atmospheric Warming and the Am-plification of Precipitation Extremes, Science, 321, 1481–1484, 2008.
Almagro, M., Lopez, J., Querejeta, J. I., and Martinez-Mena, M.: Temperature dependence of soil CO2 efflux is strongly modu-lated by seasonal patterns of moisture availability in a Mediter-ranean ecosystem, Soil Biol. Biochem., 41, 594–605, 2009. Arrhenius, S.: The effect of constant influences upon physiological
relationships, Scand. Arch. Physiol., 8, 367-415, 1898.
Asencio, D., Penuelas, J. L., Liusià, J., Ogaya, R., and Filella, L.: Interannual and interseasonal soil CO2efflux and VOC exchange rates in a Mediterranean holm oak forest in response to experi-mental drought, Soil Biol. Biochem., 39, 2471–2484, 2007. Bhupinderpal-Singh, Nordgren, A., Ottosson-Löfvenius, M.,
Hög-berg, M. N., Mellander, P-E., and HögHög-berg, P.: Tree root and soil heterotrophic respiration as revealed by girdling of boreal Scots pine forest: extending observations beyond the first year, Plant Cell Environ., 26, 1287–1296, 2003.
Boddy, L: Carbon dioxide release from decomposing wood: Effect of water content and temperature, Soil Biol. Biochem., 5, 501–
510, 1983.
Bond-Lamberty, B. and Thompson, A.: Temperature-associated in-creases in the global soil respiration record, Nature, 464, 499– 500, 2010.
Borken, W., Savage, K., Davidson, E. A., and Trumbore, S.: Ef-fects of experimental drought on soil respiration and radiocarbon efflux from a temperate forest soil, Glob. Change Biol., 12, 177– 193, 2006.
Bunnell, F. L., Tait, D. E. N., Flanagan, P. W., and van Cleve, K.: Mi-crobial respiration and substrate weight loss. I. A general model of the influence of abiotic variables. Soil Biol. Biochem. 9, 33– 40, 1977.
Campbell, J. L., Sun, O. J., and Law, B. E.: Supply-side controls on soil respiration among Oregon forests, Glob. Change Biol., 10, 1429–1444, 2004.
Chou, W. W., Silver, W. L., Jackson, R. D., Thompson, A., and Alan-Diaz, B.: The sensitivity of annual grassland carbon cy-cling to the quantity and timing of rainfall, Glob. Change Biol., 14, 1382–1394, 2008.
Cleveland, C. C., Wieder, W. R., Reed, S. C., and Townsend, A. R.: Experimental drought in a tropical rain forest increases soil car-bon dioxide losses to the atmosphere, Ecology, 91, 2313–2323, 2010.
Conant, R. T., Steinweg, J. M., Haddix, M. L., Paul, E. A., Plante, A. F., and Six, J.: Experimental warming shows that decompo-sition temperature sensitivity increases with soil organic matter recalcitrance, Ecology, 89, 2384–2391, 2008.
Cox, P. M., Betts, R. A., Jones, C. D., Spall, S. A., and Totterdell, I. J.: Acceleration of global warming due to carbon-cycle feed-backs in a coupled climate model, Nature, 408, 184–187, 2000. Craine, J. M. and Gelderman, T. M.: Soil moisture controls on