19.ª Conferência da Associação Portuguesa de Sistemas de Informação (CAPSI’2019) 11 e 12 de outubro de 2019, Lisboa, Portugal
ISSN 2183-489X
1
Lisbon
Mafalda Ramos Bernardo, NOVA IMS Information Management School (Nova IMS), Universidade Nova de Lisboa, Portugal, [email protected]
Miguel de Castro Neto, NOVA IMS Information Management School (Nova IMS), Universidade Nova de Lisboa, Portugal, [email protected]
Manuela Aparicio, NOVA IMS Information Management School (Nova IMS), Universidade Nova de Lisboa, Portugal, [email protected]
Abstract
Citizens’ mobility brings great challenges to the cities and smart city's initiatives. This study main goal is to disclosure the current situation of the metropolitan area of Lisbon regarding smart mobility and multimodal mobility systems. The methodological approach of this study consist of collect data from citizens of the metropolitan area of Lisbon, through a survey. We report here empirical study results on citizen awareness of information systems solutions, and their level of usage in their daily lives. Our study results demonstrated the citizens of the metropolitan area of Lisbon are highly unhappy with the available mobility systems and use mainly the private car as transport mode and the importance of multimodal mobility systems were confirmed.
Palavras-chave: Smart City; Mobility; Citizen Awareness; Information Systems.
1 I
NTRODUCTIONToday we are living in a world where it is visible a significant movement of people from the rural areas to the main urban centers, this phenomenon is called urbanization and is a major contributor for carbon dioxide emissions into our atmosphere. The adoption of Smart City initiatives in the cities is considered to be a solution to help moderate the impact of the urbanization through the creation of solutions that allow and effective and efficient usage of city’s resources. The Smart City concept has several definitions and scope, we can relate smart initiatives to most core components of a city: transport and mobility, education, healthcare, public administration, security, infrastructure, among others (Šiurytė and Davidavičienė, 2016). Related to the smart mobility theme, Di Martino & Rossi (2016) consider the existence of a gap regarding efficient mobility door-to-door solutions, where the citizen can move from a starting point to their destination using more than one transport service. The authors presented an architecture for a multimodal recommender system, which incorporates several mobility services and even suitable parking options on the routing suggestions. This gap also exists
19.ª Conferência da Associação Portuguesa de Sistemas de Informação (CAPSI’2019) 2 in the metropolitan area of Lisbon since the existing transport systems are not highly flexible and do not yet offer efficient mobility solutions across the area.
Although there are several studies on the smart mobility concept, it is still relevant to understand how these solutions are understood and adopted in Lisbon. For this study, we assess the smart mobility strategy in Lisbon metropolitan area, with emphasis on how mobility services are moving towards a multimodal offer. This study perspective is focused on the metropolitan area of Lisbon citizens, and how can multimodal mobility services development positively impact citizens’ quality of live. To achieve this goal, we conducted an empirical study, which comprises a survey applied to the metropolitan area of Lisbon citizens.
The paper main contribution demonstrates that citizens are not aware of the existence of several mobility applications of Lisbon city, and also, the inquired people felt the need of a multimodal transportation application. The results demonstrated a high dependency on the use of personal car for the usual trips in the metropolitan area of Lisbon, not only this main of transport is the most common but also its use is higher than in the other European cities observed. Nevertheless, in comparison, the citizens of the Lisbon metropolitan are concerned with the environmental impact of the car use and demonstrate to have a positive attitude towards electric vehicles. The residents of the metropolitan area of Lisbon demonstrated not to know well the concepts of Smart City and Smart Mobility and when asked to choose the most important Smart City related initiative they selected “Transports and Mobility” which is line with the fact the majority don’t believe the available mobility systems cover the citizens’ needs It was also visible a huge lack of knowledge of the available smart mobility solutions in the metropolitan area of Lisbon, excluding the on demand car services. The results also show the importance of the multimodal mobility topic, more than half of the survey respondents agree their quality of life would improve with the adoption of these solutions and it was detected a great need of train and bus development in the metropolitan area of Lisbon. With this study, we intend to contribute for the research on multimodal mobility services in the metropolitan area of Lisbon and create awareness on the impact the evolution towards an integrated mobility system can have on citizens’ lives.
2 S
MART CITIES INP
ORTUGALIn line with the strategy established by the European Commission to adaptation to climate change, INTELI, a private non-profit association with activities related to sustainable, inclusive and smart development of territories, launched in Portugal the Smart Cities Portugal platform in 2014, which foments smart cities market players’ cooperation. The platform aggregates companies, clusters, universities, research and development centers, municipalities and other economic and social players
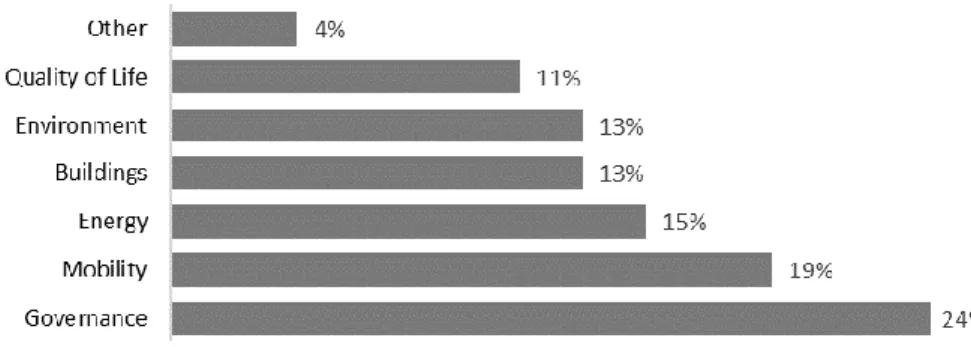
19.ª Conferência da Associação Portuguesa de Sistemas de Informação (CAPSI’2019) 3 and intends to create synergies that foment a creative urban problem solving and generates solutions that can be accessible to the municipalities (INTELI, 2014). One of the platforms intervention fields is Mobility, with focus on intelligent transport systems, alternative energy sources for mobility, intelligent parking solutions, location management, car-sharing and bike-sharing services and traffic management. The program also addresses the following cities’ fields: Governance - e-government, open data, data visualization and mapping, geographical information systems, among others.; Energy - distributed and renewable energies, urban energy production and storage, smart grids, efficient public lighting, and others; Environment - water management, waste management, urban green spaces, monitoring of environmental indicators, besides others; Buildings - green infrastructures management, green buildings, smart spaces, advanced materials, and others; Quality of Life - public security and emergency solutions, tourism applications, e-health, e-learning, among others.
To gather knowledge on the smart city topic in Portugal, INTELI (2014) studied the reality of the market through a survey on start-ups, companies, universities, Research & Development (R&D) centres, and technological infrastructures who act on the market or have the potential to. One of the topics addressed was the market barriers found in Portugal, the following issues were the most common responses:
• Lack of clarity, information and knowledge regarding smart city concept and market and absence of projects proving the smart city solutions benefits;
• Not enough support of local authorities who are resistant to change, who demonstrate lack of coherent policies and do not facilitate through legislation and regulation;
• Smart city market characteristics, with a high diversity of players but with no inter-firm and cooperation processes, and with a visible domination of global companies;
• Weak culture of urban planning and cities management; • Economic crisis.
19.ª Conferência da Associação Portuguesa de Sistemas de Informação (CAPSI’2019) 4 In Figure 1. are presented the survey results regarding areas of intervention of the Portuguese companies, which revealed that the major initiatives found are related to Governance, followed by Mobility and Energy. With less expression than on the Energy sector, are found initiatives associated to Buildings, Environment and Quality of Life.
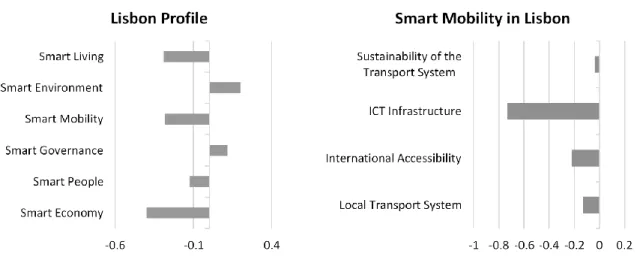
The European Smart Cities project (http://smart-cities.eu/) created an online platform which offers a “smart” profile on several medium-sized European cities and a benchmark tool for cities’ comparisons. The topics considered on this project to assess the level of smartness of a city are the key industry sectors (Zanella, Bui, Castellani, Vangelista, & Zorzi, 2014): Smart Economy, Smart People, Smart Governance, Smart Mobility, Smart Environment and Smart Living, each being given a value from -2 to 2 for a specific city, where –2 means the city is not smart at all in the topic and 2 means the city has accomplish the smartness level on the initiative.
Figure 2 – Lisbon Profile – Source: European Smart Cities Project, Vienna University of Technology
Regarding Lisbon ranking, the Smart Mobility component has a value of -0,281 (Figure 2) and results from an average of Local Transport System, International Accessibility, ICT- Infrastructure (the lowest value) and Sustainability of the Transport System indicators. This result is an indicator of Portuguese positioning on smart mobility matters. Several authors have considered the importance of the ICT infrastructure for a smart city and smart mobility systems and the data shows that this infrastructure is still not in shape in Lisbon case.
The Lisbon metropolitan area comprises eighteen municipalities (Alcochete, Almada, Amadora, Barreiro, Cascais, Lisboa, Loures, Mafra, Moita, Montijo, Odivelas, Oeiras, Palmela, Seixal, Sesimbra, Setúbal, Sintra and Vila Franca de Xira), home of about three million people, more than one quarter of the Portuguese population. The area is economically relevant since it contributes with more than 36% of the national GDP, concentrates around 25% of the Portuguese active population,
19.ª Conferência da Associação Portuguesa de Sistemas de Informação (CAPSI’2019) 5 33% of Portuguese jobs and 30% of the national companies (Área Metropolitana de Lisboa, 2017). The Área Metropolitana de Lisboa (AML) is, since 2015, the competent authority for public intermunicipal passenger transports’ services. Therefore, the organ is responsible for the mobility system’s strategic objectives definition, system planning, operation organization, supervision, financing and promotion of the services available.
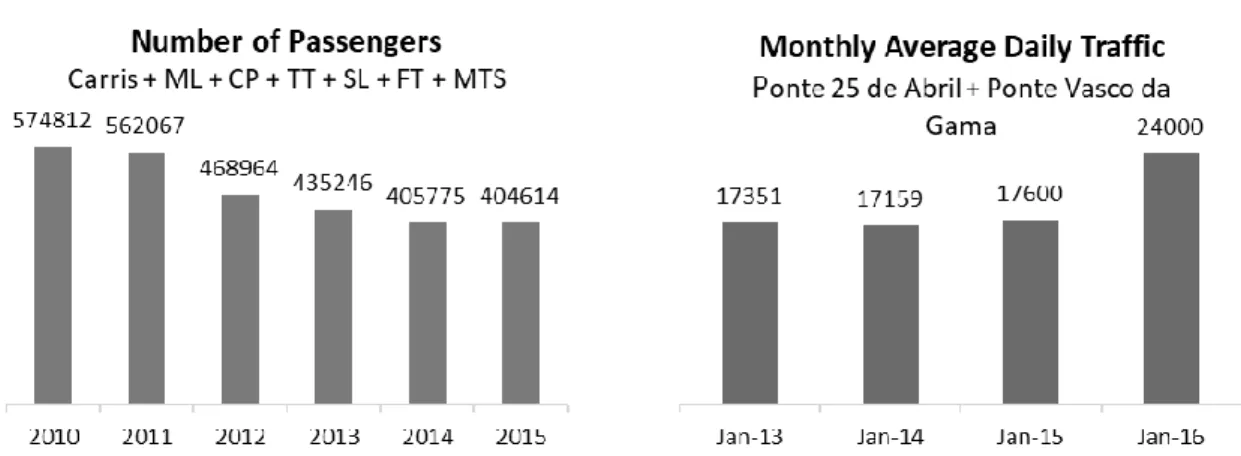
Figure 3 – Number of passengers 2010 – 2015 seven major metropolitan area of Lisbon operators (AML, 2013 and 2017) (left). Monthly Average Daily Traffic on the two bridges in the Lisbon municipality (AML,
2017) (right).
Data from 2010 to 2015 shows the declining of passengers in seven major transportation operators in Lisbon metropolitan area. On the other hand, while comparing the daily averages of the same month from 2013 to 2016 it is visible the increase of people who crossed one of the two bridges for the Lisbon municipality in 2016 as compared to the other years (Figure 3).
19.ª Conferência da Associação Portuguesa de Sistemas de Informação (CAPSI’2019) 6 By comparing the passengers’ data with the metropolitan area of Lisbon population (Table 1) we concluded that the percentage of people using one of the major seven operators to move across the metropolitan area of Lisbon has been decreasing since 2010. While there has been this reduction in public transportation usage, the data related with the average number of people who crossed the two Lisbon municipality bridges, using private cars, per day in January of the past 4 years shows a relevant increase in 2016. We can assume that the main part of the people crossing the bridges are residents in the Lisbon metropolitan area, so it is viable to question if there has been a shift from the usage of public transportation to private one in the metropolitan area of Lisbon.
The statistical analysis of European cities urban characteristics to determine factors correlated to urban growth, conducted by Caragliu, del Bo, and Nijkamp (2011), demonstrated a low ranking of the Lisbon city, while the German cities achieved the best positioning in almost all indicators. Gomes, Rego and de Castro Neto (2018) consider that happiness and wellbeing can be used a measure to assess the smartness of a city and, therefore, studied these variables in Lisbon municipality through an open data portal and a survey to the citizens. The authors (Gomes et al., 2018) created an interactive dashboard that can be used both by the citizens to support their life-decisions and by the decision-makers of city related-themes and the results demonstrated a greater performance of the city center parishes..
3 S
MARTM
OBILITY:
P
ASSENGERM
ULTIMODALM
OBILITYS
YSTEMSSome smart city topic researchers, often appoint the mobility aspect as one of the components or key aspects of a smart city (Anthopoulos et al., 2016; Giffinger, 2007; Šiurytė & Davidavičienė, 2016). Smart Mobility concept relates to a urban transport system which exploits smart technologies in its operation (Debnath et al., 2014), similar to the smart city concept, the ICT role is in the center when defining the concept.
The authors Debnath et al. (2014) created a methodological framework to compare smart passenger transport cities through the benchmark of 26 cities (which have a good level of infrastructure, and therefore can exploit smart technologies, and with at least 2 million people) and have identified several smartness indicators. Among the five cities which ranked in the top regarding the implementation of technologies and the respective usage in smart transport systems, the authors identified common trends:
Tracking public and emergency vehicles – through this monitoring system several services
can be created that can improve availability of transport systems, reduce travel time and enhance the efficiency of transit;
Integrated smart card payment system – this technology use allows the track of the user
19.ª Conferência da Associação Portuguesa de Sistemas de Informação (CAPSI’2019) 7 empowering the multimodal usage of the network which will generate a better utilization of resources;
Provide information to travellers – some cities are providing real-time information to citizens regarding public transport arrival information, available parking spaces and automated parking facilities;
Coordinated traffic signal system, variable speed limit control and highways entry control – cities are collecting information on en-route vehicles and pedestrians to coordinate traffic signals and optimize the traffic flow by reducing travel time and fuel consumption.
Other aspect of urban mobility is related to the transport of goods, which plays a central role inside a modern city where the citizens expectations are now to be offered better and faster services. Sousa and Mendes-Moreira (2015) identified difficulties faced by the freight operators related to traffic, pollution, policy constraints, parking and customer demands and considered that exists a need for innovative solutions regarding logistic services in urban areas. The authors reviewed the state of the art on the subject and concluded there is a demand for passenger and freight transport to be managed as a unique logistics system, creating an opportunity for new business models and tools for modelling and structuring the logistics system into a “multi-stakeholder, multi-criteria and multimodal dynamic system, aiming to optimizing the design of the network, the diversification of services and the utilization of vehicles” (Sousa & Mendes-Moreira, 2015, p.89).
In Lisbon municipality center, the Gira - Bicicletas de Lisboa action, a bike-sharing system, started in September 2017 and it has now a significant grid of bike sharing services, with more than on hundred docks with bikes. Even though it is a legitimate and necessary initiative, this system is not integrated with other transportation modes and is only available in Lisbon municipality, meaning it has some, but not much, usefulness for a citizen who comes from another municipality to the Lisbon city to work every day, for example.
Literature shows distinct definitions for multimodality characteristic of transport of passengers, nevertheless the concept arises commonly when the topic in discussion is the private car usage and the sustainable environmental and social alternatives to this behavior (Di Martino & Rossi, 2016; Krajzewicz, Klötzke, & Wagner, 2016; Schuppan, Kettner, Delatte, & Schwedes, 2014; Willing, Brandt, & Neumann, 2017). The concept of multimodal mobility can be understood as the possibility to combine different transport nodes into one journey (Di Martino & Rossi, 2016; Krajzewicz et al., 2016). The authors Di Martino and Rossi (2016) defined multimodal as the possibility to leave the private car in an available parking spot and continue to the destination using another mode of transport and appoint as benefits of this system the decrease of stress regarding parking and the decrease of CO2 emissions. The authors, therefore, did not exclude the private car usage when designing an architecture for a mobility recommender system that integrates the existent transport
19.ª Conferência da Associação Portuguesa de Sistemas de Informação (CAPSI’2019) 8 systems with the available parking options, based on the premise that exists a lack of efficient door to door solutions. The authors Caragliu et al. (2011) defined cities’ multimodal accessibility as “the ease with which a city can be reached with a combined set of available transportation modes (i.e., rail, road, sea, or plane)” (Caragliu et al, 2011, p.73). The authors analyzed the factors that contribute to urban wealth and growth of European countries and found a positive correlation (the highest correlation among the evaluated indicators) between cities’ multimodal accessibility and GDP per capita. The authors concluded that the better the quality and extent of the transportation system the highest levels of wealth and growth of the city will be achieved. Willing et al. (2017) conducted and overview on existing solutions and analyzed the topic on information systems perspective concluding that “multi- and intermodal travel behavior is desirable as it enables more sustainable mobility behavior and can potentially relieve strained urban mobility systems” (Wiling et al, 2017, p.174). The authors distinguished intermodal and multimodal concepts, by defining a multimodal platform as those providing multiple and alternative transportation modes for the same trip and assumed that the intermodal solution relies in the user’s opportunity to have access, in a single trip, to a combination of distinct modes of transportation. The authors analyzed some examples of multimodal and intermodal mobility platforms available in Europe and worldwide, some are presented in the Table 2. For this study, in the research objects, namely the questions of the survey, there was considered no difference between multimodal and intermodal, therefore, both concepts were used as synonyms. Other concept similar and associated to multimodal mobility is Mobility as a Service (MaaS). Jittrapirom, Caiati, Feneri, Ebrahimigharehbaghi, & Alonso (2017) conducted a literature review on the subject and defined MaaS as a service that offers a tailored mobility pack, comparable to a monthly phone contract, with one single interface that can include extra services, such as trip planning, reservation and payments. The authors considered MaaS can be comprehended as mobility service that is “flexible, personalized and on-demand” (Jittrapirom et al., 2017, p.14) and “a user-centered service adopting the advances of technology and ICT to offer various mobility
solutions to customers” (Jittrapirom et al., 2017, p.19). The authors reviewed several MaaS schemes
available in the world and proposed a set of core attributes that constitute a MaaS: integration of transport nodes, tariff option, one platform, multiple actors, use of technologies, demand orientation, registration requirement, personalization and customization.
The Plano de Ação de Mobilidade Urbana Sustentável da Área Metropolitana de Lisboa (PAMUS), a plan developed to guide AML until 2020, established six strategic actuation vectors, among them, the adjustment of the transports’ offers to the citizen’s needs and the reinforcement of the transport system multimodality. This confirms the importance of the multimodal systems for the Lisbon metropolitan area quality of life growth and demonstrates that already exists a commitment from the competent authority.
19.ª Conferência da Associação Portuguesa de Sistemas de Informação (CAPSI’2019) 9 Table 2 – Examples of multimodal solution - Adapted from Willing et al. (2017)
Solution Multimodal vs Intermodal
Characteristics Available Cities in Europe
Weblink
Ally App Multimodal Trip comparison only: Timetables for several transportation modes Trip planning through the selection of departure or arrival time
Route search with time and length of trip comparison
32 German cities
www.allyapp.com
Citymapper Multimodal Trip comparison only: Real-time departures for several transportation modes available in the cities
Transit maps with real-time disruption alerts
Uber and bike-sharing services integration London, Manchester, Birmingham, Paris, Lyon, Berlin, Hamburg, Brussels, Amsterdam/ Randstad, Madrid, Barcelona, Milan, Rome, Lisbon, Copenhagen, Stockholm, Moscow, St Petersburg www.citymapper.com
GoEuro Multimodal Trip comparison only: Train, bus and plane possibilities for a journey in Europe, with information regarding time departures and arrivals and prices
All European cities
www.goeuro.com
Rome2rio Intermodal Trip comparison only: Trip planning with combination of several operators (flight, train, bus, ferry, rideshare and rental car)
Information on prices and journey duration
All European cities
www.rome2rio.com
fromAtoB Multimodal Trip comparison and booking: Trip planning with comparison of several operators (flight, train, bus, and rideshare) Information on prices and journey duration with booking possibility
All European cities
www.fromatob.com
Moovel Intermodal Trip comparison:
Trip planning inside the city with combination of several public transport operators (bus, train, tram, subway, ferry) Information regarding close stations and arrival times Car-sharing and bike-sharing services integration
Amsterdam, Barcelona, Helsinki, Lviv, Olso, Kiev, Madrid, Vienna,
www.moovel.com
Qixxit Intermodal Trip comparison and booking: Trip planning with combination of several operators (flight and train)
Information on prices and journey duration with booking possibility
All European cities
19.ª Conferência da Associação Portuguesa de Sistemas de Informação (CAPSI’2019) 10
4 E
MPIRICALS
TUDYWithin the social survey research scope and methods, it was developed a self-completion questionnaire, with only closed questions, created to ensure the same context to all citizens and minimize the error in the results handling. The questions selected to integrate the questionnaire resulted from the literature review conducted and from the EU Travel Survey questions (to ensure possible comparison) and contributed to achieve the second and third specific objectives of the present study: Firstly, to acknowledge the Portuguese citizens’ level of awareness, commitment and information on taking advantage and incorporate multimodal smart mobility services in their daily lives. Secondly to compare the metropolitan area of Lisbon to other European cities, regarding smart mobility initiatives. The survey was applied in a digital format through Google Forms platform and the target were citizens of metropolitan area of Lisbon. The survey was available online for 2 months (from mid-April to mid-July 2018). The survey collected demographic information of the inquired in a primary section and in the second section, addressed the citizen’s opinion and level of information on: scope of smart city and smart mobility concepts and related benefits; mobility and everyday transport habits, including private car usage, combining more than one transport mode into one journey, and existing needs regarding public transport services; examples of multimodal and intermodal mobility solutions and the associated benefits to the multimodal system.
Some statistical tests were done with the objective to assess the magnitude of the differences found among the responses. The chi-square test was used to analyze the relationship (Field, 2013) between gender, literacy and age (age groups) and whether they selected a particular option in each question of the questionnaire. The chi-square test was also used to: understand whether there is a relationship between the most important benefit arising from smart mobility solutions' implementation and the fact that the respondent uses more than one means of transport in he/his usual trip; understand if there is a relationship between using car in the usual trip and the choice of the main benefit resulting from the implementation of smart mobility solutions.
4.1 Results
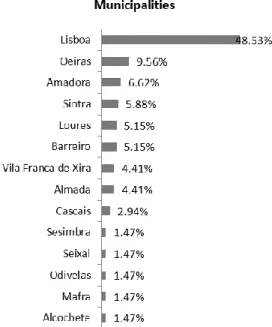
The questionnaire had 136 responses, around 50% of the responses were from residents of the Lisbon municipality and around 10% were from Oeiras, the municipalities of Moita, Montijo, Palmela and Setúbal did not registered any response and the remaining municipalities account from 1% to 7% of the responses (Figure 4).
19.ª Conferência da Associação Portuguesa de Sistemas de Informação (CAPSI’2019) 11 Figure 4 – Responses by municipality
Regarding the age distribution, the two extreme ranges did not receive much answers, it was only registered 1% of responses from citizens below 18 years old and 2% from citizens above 60 years old, 41% of the respondents had 25 to 39 years old, 26% had 19 to 24 years old and the remaining 29% had 40 to 59 years old (Figure 5).
Figure 5 – Responses by age and academic qualifications
The gender distribution is very similar, 49% of the respondents are male and 51% are female. The section on mobility habits and needs of the citizens revealed that the majority (77%) own a private car which is the most common transport mode used by the respondents (63%), followed by the underground (41%), for the usual trip from home to school/work. The smart mobility solutions, shared bicycle, car and motorcycle, are yet not well disseminated when compared to the traditional solutions (Figure 6).
19.ª Conferência da Associação Portuguesa de Sistemas de Informação (CAPSI’2019) 12 Figure 6 – Most common transport modes used in the usual trip home – school/work
Figure 7 – Average duration in minutes of the usual trip home – school/work by municipality of residence
In average, the respondents take 34.6 minutes in their usual trip from home to school/work. The residents of the Lisboa municipality are the ones with the lower duration (27 minutes), in average, of the usual trip from home to school or to work, while the residents in Seixal, Barreiro and Sesimbra take around one hour in this journey (Figure 7). Around 65% of the respondents only use one transport mode in their usual trip, 25% use two and only 10% uses three transport means in this trip. Lisbon is also the municipality for which most of the residents only use one transport mode in the most frequent trip at the same time it registered the lowest percentage of respondents that use three or more transport modes (Figure 8). The development of the public transport systems in the municipality of residence and the connection options to get to the other municipalities are probably the explanation for the differences found on the trip duration and for the number of transport modes used by the residents in the metropolitan area of Lisbon.
19.ª Conferência da Associação Portuguesa de Sistemas de Informação (CAPSI’2019) 13 Figure 8 – Number of transport modes used in the usual trip home – school/work by municipality of
residence
To assess the satisfaction level with the available mobility systems in the metropolitan area of Lisbon respondents were asked to indicate the extent of their agreement with the statement “the available mobility systems in the metropolitan area of Lisbon cover the citizen’s needs”, using a five-point rating scale in which 1 represents “I don’t agree” and 5 “I totally agree”. Figure 9 shows the distribution of answers to this question. As it can be seen, respondents are not satisfied: the average is only of 2.54 (below the center of the scale), and 50% are in the two first points of scale.
Figure 9 – Level of agreement to the sentence “the available mobility systems in the metropolitan area of Lisbon cover the citizen’s needs”.
19.ª Conferência da Associação Portuguesa de Sistemas de Informação (CAPSI’2019) 14 The one-way ANOVA result showed that the degree of agreement with the statement "The available mobility systems in the metropolitan area of Lisbon cover the citizen’s needs" is influenced by the number of mode of transport (one, two, three or more) used in their usual trip in the city [(F = 2.133) = 3.433, p = 0.035], and the a posteriori multiple comparison tests allowed to conclude that there is a significant difference (p = 0.017) between those using only one mean of transport (mean = 2.38) and who uses two (mean = 2.85). To assess if the satisfaction level with the available mobility systems in the metropolitan area of Lisbon is related to more variables, the Pearson’s correlation coefficient was applied to relate with the trip duration, the level of knowledge on the smart city concept and the level of knowledge on the smart mobility concept, however, the results were not significant ( Table 3).
Table 3 – Pearson’s correlation coefficient between the degree of agreement to the sentence "The available mobility systems in the metropolitan area of Lisbon cover the citizen’s needs" and the usual trip duration, the
knowledge level on the smart city concept and the knowledge level on the smart mobility concept.
Before the respondents finish the questionnaire, they were invited to suggest an improvement to the mobility in the metropolitan area of Lisbon, 70 respondents answer to this question, which accounts for 51% of the questionnaire respondents. The answers were analyzed and grouped by topics, revealing three main topics of concern to the respondents: the need for improvements in the quality and frequency (50%) of the public transport's service, the necessity to promote the coordination of the public transport by adapting schedules (17%), payment systems and creating integrated information and the need for parking options in the primary access to the city center (13%) (Figure 10). The comments given by the respondents show the discontent among the citizens of the metropolitan area of Lisbon with the underground service, from the 50% of comments related to the quality and frequency of the public transport’s service, 49% (seventeen answers) address the underground topic, and suggest improving the network and/or to increase the frequency and/or schedules.
DEGREE OF AGREEMENT "THE AVAILABLE MOBILITY SYSTEMS IN THE METROPOLITAN AREA OF LISBON COVER THE CITIZEN’S NEEDS"
Usual trip duration r=0.132 p=0.128 Knowledge level – smart city r=0.041 p=0.632 Knowledge level – smart mobility r=-0.012 p=0.893
19.ª Conferência da Associação Portuguesa de Sistemas de Informação (CAPSI’2019) 15 Figure 10 – Suggestion topics given by the respondents
The knowledge of the inquired citizens of the metropolitan area of Lisbon regarding Smart City was assessed in a scale from 1 to 5, where 1 represented “I don’t know” and 5 “I know well”, and the average result was 2.87 points, which reveals a lack of knowledge since it is below 3 (the midpoint of the scale). 20.6% of the respondents were not familiar with the Smart City concept, about 44% are in the first two points of the scale and only 16.2% consider knowing well the concept (Fig. 11).
Figure 11 - Knowledge level of the concept Smart City by municipality in a scale from1 to 5, where, 1 represents “I don’t know” and 5 “I know well”
1.43% 1.43% 1.43% 1.43% 2.86% 2.86% 4.29% 4.29% 12.86% 17.14% 50.00% 0% 10% 20% 30% 40% 50% 60% e-payment system for poublic transport
Integrate on demand ride systems with… Changes in the public transport governance… Decrease the public transport tickets price
Improve the monitoring of the public… Improvements in the bike sharing systems
Improvement on the availability of public… Non poluent public transports Parking options in the primary access to the…
Promote the coordination and integration… Improvements in the quality and frequency…
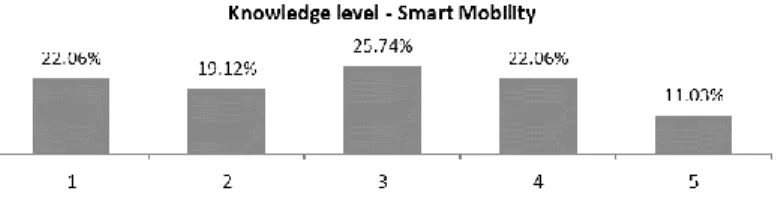
19.ª Conferência da Associação Portuguesa de Sistemas de Informação (CAPSI’2019) 16 Sesimbra and Alcochete are the municipalities for which the knowledge level assessed was higher (5.0 and 4.5, respectively), and Seixal and Barreiro the municipalities with the lower knowledge level (2.0 and 2.1, respectively). The knowledge of the Smart Mobility concept was also evaluated in a scale from 1 to 5 points, and the results follow the same distribution of the knowledge of the previous Smart City concept, with an average value of 2.81. Also, in line with the results by municipality of the knowledge level on the Smart City concept, Sesimbra and Alcochete (4.0 and 5.0, respectively) residents got the higher level assessed for the Smart Mobility knowledge and Seixal and Barreiro are accountable for the lowest knowledge level (2.0 and 2.1, respectively). The average by academic qualification is also similar for all the groups, the group with more deviation from the average is the Basic School, which registered the value 1 in this question, although, this group is composed by a single respondent.
Figure 12 – Knowledge level of the Smart Mobility concept in a scale from 1 to 5, where 1 represents “I don’t know” and 5 “I know well.
When inquired about the importance of each of the following Smart City related initiatives: Transports and Mobility, Energy, Buildings and Infrastructures, Environment, Health, Economic development and Government, the respondents graded higher the Transports and Mobility theme, which confirms the importance and relevance of the subject to the citizens of the metropolitan area of Lisbon. The respondents answered with a five-point rating scale where 1 is “not important” and 5 “very important” and the results of each initiative are presented in Figure 13.
Figure 13 - Importance of Smart City related initiatives in a scale from 1 to 5, where 1 means “not important” and 5 “very important
19.ª Conferência da Associação Portuguesa de Sistemas de Informação (CAPSI’2019) 17 Figure 14 – Most valuable Smart Mobility solutions
Statistically significant differences have been found between male and female respondents regarding the selection of car and bike sharing systems [χ 2(1)=6.965, p=0.008; Cramer’s V=0.226], the male respondents are the ones which select more this option (46%) while only 25% of the female respondents selected. Comparing age groups , the respondents with age between 25 to 39 differentiate from the others as the one that most select on demand ride services, although the magnitude of the difference was small [χ 2(1)=6.823, p=0.033; Cramer’s V=0.224], and also for the electrical public transportation network option (χ 2(1)=6.238, p=0.044 Cramer’s V=0.214). Regarding academic qualifications, respondents with PhD are the ones who more select the option “Electrical car’s charging spots” [χ 2(1)=10.648, p=0.014; Cramer’s V=0.229]. From the benefits associated to smart mobility solutions presented, the efficiency gains on city’s resources usage was considered the most important for 36% of the respondents, followed by congestion reduction, which was selected by 32% of the respondents. The reduction of problems regarding parking, which is a very common discussion topic, was only selected as the most important benefit by residents of Lisboa and Vila Franca de Xira municipalities, accounting 1% of the responses. The decrease of traffic accidents is only considered an important smart mobility benefit by 3% of Lisboa municipality residents. The chi-square test made it possible to conclude that the choice of the most important benefit resulting from the implementation of Smart Mobility initiatives is not related to the number of modes of transport used in the most frequent trip [X2(6)=4.891, p=0.558] and the Eta coefficient of association revealed that does not exist a relation between the average trip duration and the most important benefit selected [eta=0.343, p=0.728]. The respondents’ opinion regarding the promotion of some smart mobility systems was also collected in a scale from 1 to 5, where 1 represented “I don’t believe the promotion is adequate” and 5 “I believe the promotion is totally adequate” with an extra option of “unknown” to allow the respondents to mark the unfamiliar platforms.
19.ª Conferência da Associação Portuguesa de Sistemas de Informação (CAPSI’2019) 18 Figure 15 - Most important benefit achieved from the implementation of smart mobility solutions
The results demonstrate that, in average, 42% of the systems presented were unknown to the respondents. On demand ride platform Uber received the higher evaluation, with an average of 3.82 points, and the car sharing apps Citydrive and 24/7 City received the lower evaluations, with an average of 2.59 and 2.70 points respectively.
Table 4– Perception on promotion level of smart mobility platforms, the average promotion level refers to a scale from 1 to 5 where 1 represents “I don’t believe the promotion is adequate” and 5 “I believe the
promotion is totally adequate.
Platform Description # "unknown" % "unknown" Promotion level (average)
UBER On demand ride service 4 3% 3.82
E-PARK - EMEL E-parking platform 21 15% 3.38
CABIFY On demand ride servisse 22 16% 3.28
GIRA.BICICLETAS DE LISBOA
Bicycle sharing platform 24 18% 3.66
TAXIFY On demand ride servisse 30 22% 3.36
VIA VERDE
TRANSPORTES
App for public transports tickets payment
32 24% 3.55
MY TAXI On demand ride servisse 33 24% 3.02
DRIVE NOW Car sharing platform 59 43% 3.36
ECOOLTRA Motorbike sharing platform 65 48% 2.77
MOOVIT App with public transport schedules
and recommender system for multimodal trips
77 57% 2.98
LISBOA MOVE-ME App with public transport schedules
and recommender system for multimodal trips
83 61% 2.94
CITYDRIVE Car sharing platform 92 68% 2.59
CHECKMYBUS App with intercity bus schedules 99 73% 3.08
SAPO
TRANSPORTES
App with public transport schedules and recommender system for multimodal trips
101 74% 3.38
24/7 CITY Car sharing platform 106 78% 2.70
19.ª Conferência da Associação Portuguesa de Sistemas de Informação (CAPSI’2019) 19 The respondents’ opinion regarding the promotion of some smart mobility systems was also collected in a scale from 1 to 5, where 1 represented “I don’t believe the promotion is adequate” and 5 “I believe the promotion is totally adequate” with an extra option of “unknown” to allow the respondents to mark the unfamiliar platforms. The results demonstrate that, in average, 42% of the systems presented were unknown to the respondents. On demand ride platform Uber received the higher evaluation, with an average of 3.82 points, and the car sharing apps Citydrive and 24/7 City received the lower evaluations, with an average of 2.59 and 2.70 points respectively.
5 C
ONCLUSIONSWith the present study we intended to understand the current situation of the metropolitan area of Lisbon regarding smart mobility and multimodal mobility systems and assess how these solutions could positively impact the quality of life of the citizens. An empirical study was conducted trough survey to the people of the metropolitan area of Lisbon. Through the analysis of existing mobility applications was possible to gather examples of smart passenger transport and multimodal solutions, and to acknowledge the level to which the citizens of the metropolitan area are aware of these solutions and committed to incorporate it in their daily lives.
The citizens of the metropolitan area of Lisbon are huge users of the personal car, it is not only the main transport mode for usual trips in the city but also the use rate of this transport mean, the driving license availability and the ownership of vehicles is higher in Lisbon than in others European metropolitan areas analyzed. It was identified a dissatisfaction with the current mobility systems in the metropolitan area of Lisbon, 81% of the respondents don’t believe the available systems cover the citizens needs and appoint the need for improvements in the quality and frequency of the public transport services and for greater coordination among the operators. The knowledge level on the smart city and smart mobility is not high amongst the citizens of the metropolitan area of Lisbon and they also demonstrated not to be aware of available smart mobility solutions. The smart mobility solution more valued for the inquired citizens are systems with real-time information on public transport schedules and traffic and the least appreciated are the on-demand ride services. Regarding the multimodal solutions topic, the results show there is a huge necessity of bus and train connection development and for mobile apps which offer recommendations for combination of transport modes for a trip or which compare alternatives. 71% of the respondents believe their quality of life would improve from the implementation of smart multimodal mobility systems. It was also visible there is a huge lack of information among the citizens of the metropolitan area of Lisbon regarding solutions that exist today, in average 42% do not recognize the solutions presented in the survey and many offer the same functionalities which were appointed as necessities by the respondents.
19.ª Conferência da Associação Portuguesa de Sistemas de Informação (CAPSI’2019) 20
R
EFERENCESAnthopoulos, L., Janssen, M., & Weerakkody, V. (2016). A Unified Smart City Model (USCM) for Smart City Conceptualization and Benchmarking. International Journal of Electronic Government Research, 12(2), 77–93. https://doi.org/10.4018/IJEGR.2016040105
Caragliu, A., del Bo, C., & Nijkamp, P. (2011). Smart cities in Europe. Journal of Urban Technology, 18(2), 65–82. https://doi.org/10.1080/10630732.2011.601117
Debnath, A. K., Chin, H. C., Haque, M. M., & Yuen, B. (2014). A methodological framework for benchmarking smart transport cities. Cities, 37, 47–56. https://doi.org/10.1016/j.cities.2013.11.004 Di Martino, S., & Rossi, S. (2016). An Architecture for a Mobility Recommender System in Smart Cities.
Procedia Computer Science, 98, 425–430. https://doi.org/10.1016/j.procs.2016.09.066
Field, A. (2013). Discovering Statistics Using IBM SPSS Statistics (4th ed.). London: Sage Publications
Giffinger, R. (2007). Smart cities Ranking of European medium-sized cities. October, 16(October), 13–18. https://doi.org/10.1016/S0264-2751(98)00050-X
Gomes, J. B., Rego, J. S., & de Castro Neto, M. (2018). Measuring Happyiness and Wellbeing in Smart Cities - Lisbon Case Study. In SMARTGREENS - 7th International Conference on Smart Cities and Green ICTSystems (pp. 270–277).
INTELI. (2014). Smart Cities Portugal Roadmap, 1–62.
Jittrapirom, P., Caiati, V., Feneri, A., Ebrahimigharehbaghi, S., & Alonso-, M. J. (2017). Mobility as a Service : A Critical Review of Definitions , Assessments of Schemes , and Key Challenges. Urban Planning (ISSN: 2183-7635), 2(2), 13–25. https://doi.org/10.17645/up.v2i2.931
Krajzewicz, D., Klötzke, M., & Wagner, P. (2016). Intermodal Urban Mobility : Users , Uses , and Use Cases. Transportation Research Procedia, 14(December), 1183–1192.
https://doi.org/10.1016/j.trpro.2016.05.189
Schuppan, J., Kettner, S., Delatte, A., & Schwedes, O. (2014). Urban Multimodal Travel Behaviour : Towards Mobility without a Private Car ScienceDirect private car. Transportation Research Procedia, 4, 553–556. https://doi.org/10.1016/JTRPRO.2014.11042
Šiurytė, A., & Davidavičienė, V. (2016). An analysis of key factors in developing a smart city. In
Proceedings of the 19th Conference for Junior Researchers „Science – Future of Lithuania“ (Vol. 0). VGTU Technika. https://doi.org/10.3846/mla.2015.900
Sousa, J. F. De, & Mendes-Moreira, J. (2015). Urban Logistics Integrated in a Multimodal Mobility System. In IEEE18th International Conference on Intelligent Transportation Systems (pp. 89–94). https://doi.org/10.1109/ITSC.2015.23
Willing, C., Brandt, T., & Neumann, D. (2017). Intermodal Mobility. Business & Information Systems Engineering, 59(3), 173–179. https://doi.org/10.1007/s12599-017-0471-7
Zanella, A., Bui, N., Castellani, A., Vangelista, L., & Zorzi, M. (2014). Internet of Things for Smart Cities. IEEE Internet of Things Journal, 1(1), 22–32. https://doi.org/10.1109/JIOT.2014.2306328