Universidade do Minho
Escola de Engenharia
Pedro José Ribeiro Moreira
Knowledge Analytics
Universidade do Minho
Dissertação de Mestrado
Escola de Engenharia
Departamento de Informática
Pedro José Ribeiro Moreira
Knowledge Analytics
Mestrado em Engenharia Informática
Trabalho realizado sob orientação de
Professor Pedro Rangel Henriques!
Engenheiro Miguel Grade
A C K N O W L E D G E M E N T S
There are a number of people without whom this thesis might have not been written to whom I am deeply grateful.
First of all, I would like to thank the companies that provided the opportunity of developing this master work in a professional environment, Inova Ria and Maisis, without whom the internship would no be possible.
Next, I would like to thank my supervisors, Prof. Pedro Rangel Henriques and Eng. Miguel Grade, whose supervision, knowledge and guidance was fundamental the success of the project.
In addition, I would like to thank my friends, college and work colleagues for helping me when I needed.
I would specially like to thank my parents and my sister, for supporting me during this stage of my life.
A B S T R A C T
This document consists in a thesis report for a master work on the area of Knowledge Analyt-ics. This thesis is the main component of the second year of the masters degree in Informatics Engineering at University of Minho and it was developed in collaboration with Maisis - In-formation Systems, from Aveiro, Portugal.
The main goal of this thesis was to study the knowledge management plataform Oobian, property of Maisis and to develop and integrate software modules to extract, analyse, compute and disseminate information present in a knowledge database.
R E S U M O
Este documento consiste num relatório de tese na área de Análise de Conhecimento. A tese é o componente principal do segundo ano do Mestrado em Engenharia Informática da Universidade do Minho. O trabalho de tese foi desenvolvido em colaboração com a Maisis -Information Systems, sediada em Aveiro, Portugal.
O principal objetivo deste trabalho de tese foi fazer um estudo sobre a plataforma de gestão de conhecimento Oobian, propriedade da Maisis, desenvolver e integrar módulos de software de modo a permitir a extração, análise, processamento e disseminação de informação presente na base de conhecimento.
C O N T E N T S
Contents . . . iii
Acronyms . . . v
List of figures . . . vi
List of tables . . . viii
1 introduction . . . 1
1.1 Context and Problem . . . 1
1.2 Semantic Web, Ontology & Linked Data . . . 2
1.3 Data Analytics & Visualization . . . 7
1.4 Motivation . . . 8 1.5 Goals . . . 8 1.6 Contribution . . . 9 1.7 Methodology . . . 9 1.7.1 Development Methodology . . . 10 1.8 Work Plan. . . 10 1.9 Document Structure . . . 12
2 knowledge management and visualization. . . 13
2.1 Oobian platform . . . 13
2.1.1 Oobian architecture . . . 14
2.1.2 Oobian features. . . 14
2.2 Data Analysis and Visualization tools . . . 20
2.2.1 Sgvizler . . . 20
2.2.2 Google Charts . . . 21
2.2.3 IBM Many Eyes . . . 22
2.2.4 Microsof Silverlight PivotViewer . . . 23
3 proposed solution . . . 24 3.1 Requirement Specification . . . 24 3.1.1 Analysis Methodology . . . 24 3.1.2 Stakeholders . . . 25 3.1.3 Actors . . . 25 3.1.4 Requirements . . . 27 3.2 Proposed Architecture . . . 29 3.3 Query Format . . . 30 3.4 Output Format . . . 31
Contents
3.4.1 CSV Table . . . 33
3.5 Embed component . . . 33
4 development . . . 35
4.1 Client side . . . 35
4.1.1 Component Integration and Configuration . . . 41
4.2 Server side. . . 43
4.3 Visualization Embedding . . . 46
5 achieved results . . . 49
5.1 560.PT - Portugal Business Network . . . 49
5.2 Joobian . . . 56
6 conclusion. . . 62
6.1 Future Work . . . 63
a requirement specification . . . 67
a.1 Functional Requirements. . . 68
a.2 Non-Functional Requirements . . . 79
a.2.1 Usability . . . 79
a.2.2 Design . . . 79
a.2.3 Interface. . . 80
A C R O N Y M S
API Application Programming Interface CEO Chief Executive Officer
CMS Content Management System CSV Comma Separated Values
FURPS Functionality, Usability, Reliability, Performance, Supportability GTD Getting Things Done
HTML Time Division Multiple Access HTTP HyperText Markup Language JAX Java Specification Request JSF Java Server Faces
JSON JavaScript Object Notation OWL Web Ontology Language
OLW-DL Web Ontology Language Description Logic RDF Resource Description Framework
RDFS Resource
REST Resource Description Framework Schema SPARQL SPARQL Protocol and RDF Query Language URI Uniform Resource Identifier
URL Uniform Resource Locator W3C World Wide Web Consortium
XHTML eXtensible Hypertext Markup Language XML eXtensible Markup Language
L I S T O F F I G U R E S
Figure 1 Evolution of Web . . . 2
Figure 2 Ontology hierarchy . . . 4
Figure 3 Linking Open Data cloud - April 2014 . . . 6
Figure 4 Agile development process . . . 11
Figure 5 Oobian architecture . . . 14
Figure 6 Oobian Content Sources . . . 15
Figure 7 Content Processing Pipeline . . . 15
Figure 8 Oobian HTML client - Instances of a Class . . . 16
Figure 9 Oobian HTML client - Instance details . . . 17
Figure 10 Oobian HTML client - Relation details of an instance . . . 17
Figure 11 Oobian HTML client - Faceted filtering . . . 18
Figure 12 Oobian HTML client - Maps mode . . . 19
Figure 13 Sgvizler html element example . . . 20
Figure 14 Google Charts example . . . 21
Figure 15 IBM Many Eyes visualization example . . . 22
Figure 16 Silverlight PivotViewer example . . . 23
Figure 17 Use case diagram . . . 26
Figure 18 Architecture Block Diagram . . . 29
Figure 19 JSF architecture. . . 36
Figure 20 Knowledge Analytics composite component . . . 36
Figure 21 Analytics panel . . . 37
Figure 22 Extract from Knowledge bean: managed properties . . . 38
Figure 23 Extract from Knowledge bean . . . 39
Figure 24 JavaScript function to draw a visualization . . . 40
Figure 25 Extract from the configurations file . . . 41
Figure 26 REST web service interface . . . 44
Figure 27 Server side block diagram . . . 45
Figure 28 Popup with the embedding code . . . 46
Figure 29 getElements function . . . 47
Figure 30 Extract from the drawFromEmbed function . . . 48
Figure 31 560.pt class hierarchy . . . 50
Figure 32 Area chart: Nº of companies / Creation date. . . 51
List of Figures
Figure 34 Bar chart: Nº of companies / Ratio of companies with 500+
employ-ees . . . 53
Figure 35 Donut chart: Relations of instance Portugal . . . 54
Figure 36 Pie chart: family of Services related to Portugal . . . 55
Figure 37 Joobian class hierarchy . . . 56
Figure 38 Bar chart: 15 cities with more Job Offers . . . 57
Figure 39 Column chart: 15 cities with more Job Offers in Portugal . . . 58
Figure 40 Line chart: Evolution Job Offers matching Java in Porto . . . . 59
Figure 41 Table: 15 cities with more Job Offers in Portugal . . . 60
Figure 42 ”Dashboard” page with multiple charts . . . 61
Figure 43 Analytics button mockup. . . 68
Figure 44 Instance relations example . . . 69
Figure 45 Related instance cluster example . . . 70
Figure 46 Simple Data Table . . . 71
Figure 47 Bar Chart . . . 71
Figure 48 Column Chart . . . 71
Figure 49 Line Chart . . . 72
Figure 50 Area Chart . . . 72
Figure 51 Pie Chart . . . 72
Figure 52 Donut chart . . . 72
Figure 53 Proposed grammar . . . 75
L I S T O F TA B L E S
Table 1 Requirement Priority . . . 27
Table 2 Functional requirements . . . 28
Table 3 Non-Functional requirements. . . 28
1
I N T R O D U C T I O N
In this first chapter of the report is made an introduction to the master work. It is exposed to the reader the main problem and presented a contextualization of the work, as well as the goals intended to be accomplished with it. It is explained the motivation behind the project from the point of view of the company as well as the student and it is also presented a general work plan and the working methodology adopted.
1.1 context and problem
In the context of the Master degree in Informatics Engineering of University of Minho, this master work is the main component of the second and final year. The work is supported by the InovaRia’s Genius Trainee Program1, and was developed in partnership with Maisis
-Information Systems2 from Aveiro, Portugal.
Maisis is a software development company, founded in 1994, whose focus is to provide products and solutions for the telecommunications market. One of those products is the Oobian3 ecosystem.
Oobian is a knowledge management platform that extracts and indexes information from structured and unstructured data inside and outside organisations, transforming it into a real knowledge database. The users of the platform can search and drill through the information in a rich user interface that creates a unique navigation experience. With this work, Maisis intends to take the next step and add features to the platform aiming to allow companies using Oobian to perform deeper data and knowledge analytics and improve their business intelligence processes.
The main problem this work proposes to solve is the lack of a formal method to extract and process information for analysis and report features. The platform already has formal methods to structure and present data from ontologies, however it doesn’t have a formal solution to query the server and obtain a structured data set of results prepared for analysis. So, the general goals of this work are to specify a query format, to specify a format for
1 http://www.bolsasgenius.pt/
2 http://www.maisis.pt/
1.2. Semantic Web, Ontology & Linked Data
the resultant data set and to make an analysis by generating reports about the information present in those results.
1.2 semantic web, ontology & linked data
As said by Tim Berners-Lee, semantic web is ”a new form of web content that is meaningful to computers” [4].
On the last few years the web went through great changes, it has gone from being a company focused information portal (web 1.0) to a social platform (web 2.0). Before, the majority of the information on-line was created by companies; now, the focus is on contents created by social communities and networks. This change led to a massive growth of the amount of information present on the web.
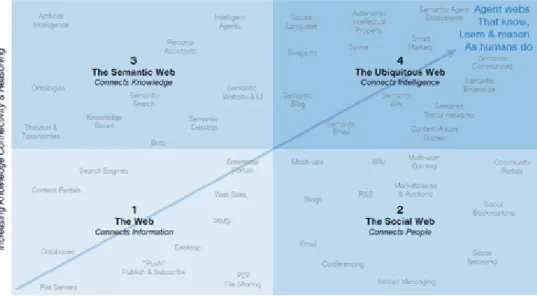
In spite of these major changes, the current web is still mostly based on old keyword search mechanisms, but it is changing, evolving once again. Semantic Web (web 3.0), the web of data is that evolution. From unstructured information to a real knowledge database. On figure 1 is represented the evolution of the web[7].
1.2. Semantic Web, Ontology & Linked Data
On the basis of Semantic Web is a shift of the computational pattern, from a information centred to a knowledge centred one, enabling people and machines to connect, share and use knowledge.
The main goal of Semantic Web is to give ”meaning” to the information present in the web [4], inserting machine-readable meta-data into web contents about them and how they are related to each other. By doing this it’s possible to create autonomous agents that can extract and process relevant information and perform tasks on behalf of the users.
But how do these agents recognize the objects and relationships between them? Is there any standard? How can they deal with the diversity of web contents? The answer to these questions is the use of ontologies.
In philosophy, an ontology is a theory about the nature of existence, about types of things that exist. Web researchers adopted this term and for them an ontology is ”formal explicit description of concepts in a domain of discourse”[13], a document or file that defines formally a set of types, properties and the relationship between types. In both computer science and philosophy, ontologies have in common the representation of entities, ideas or events, along with their properties and relations, according to a system of categories. One of the main advantages of ontologies is the fact that regardless of the language in which they are expressed, contemporary ontologies share a set of common components [12].
These components are:
• Individuals: the basic objects or instances.
• Classes: groups of individuals that belong together and share properties.
• Attributes: characteristics, properties or parameters that objects or classes can have. • Relations: ways in which classes and individuals can be related.
• Function terms: structures with a high degree of complexity that can replace an indi-vidual in a statement.
• Restrictions: formal descriptions of what must be true in order for some assertion to be accepted as input.
• Rules: if-then sentences that describe logic.
• Axioms: assertions in a logical form that contain the overall theory of the ontology. • Events: the changing of attributes or relations.
Typically, a web ontology has a taxonomy and a set of inference rules. The taxonomy is used to define classes of objects and the hierarchical relations between them. A car may be defined as a type of vehicle, and number plates may be defined as a type of identification, to
1.2. Semantic Web, Ontology & Linked Data
apply only to vehicles. This definition of classes, subclasses and relations is very useful as a large amount of knowledge can be expressed by assigning properties to classes and allowing subclasses to inherit those properties. Figure2depicts a simple representation of the hierarchy of a knowledge base.
Figure 2.: Ontology hierarchy
There are some specific languages to encode ontologies. In the web context, the main ontology language is OWL - Web Ontology Language.
The W3C Consortium describes OWL as being the choice of use when ”the information contained in documents needs to be processed by applications, as opposed to situations where the content only needs to be presented to humans”4. OWL explicitly represent the meaning of terms in vocabularies and the relations between them, and has a set of characteristics like cardinality, equality, symmetry (and other characteristics of properties), that turn it ideal to describe properties and classes.
There are three sub languages of OWL [15]:
• OWL Lite: it is the simplest, providing only the basics, for example, supports cardinality, but only permits cardinality values of 0 or 1. It is used for quick migration for thesauri and other taxonomies it’s directed for those needing a classification hierarchy with simple constrains.
• OWL DL: includes all OWL language constructs with certain restrictions, for example, a class may be a subclass of many classes, but it cannot be an instance of another class. It is directed for those who want maximum expressiveness while retaining computational completeness.
1.2. Semantic Web, Ontology & Linked Data
• OWL Full: it is complete kit, for those who want maximum expressiveness and syntactic freedom and don’t need computational guarantees.
Each of these sub languages is an extension of its simple predecessor.
When talking about Semantic Web or Web 3.0, the words ”Linked Data” appear very often. What is Linked Data after all?
Linked data is about using the web in the creation of typed links between data from different sources. To do so Berners-Lee [5] proposed a set of principals or best practices for publishing data on the web, to ensure that all data becomes part of the same data space. These principals are:
• Use URIs as names for things;
• Use HTTP URIs so that people can look up those names;
• When someone looks up a URI, use the standards (RDF, SPARQL) to provide useful information;
• Include links to other URIs, so they can discover more things.
On the base of Linked Data there are three main technologies[9], URIs (Uniform Re-source Identifiers), HTTP (HyperText Transfer Protocol) and HTML (HyperText Markup Language). Entities are identified by URIs that use the http:// scheme and can be looked up by dereferencing the URI over the HTTP protocol and represented in the widely used content format of HTML. These technologies are supplemented by RDF that provides a graph based data model to represent the world.
According to W3C recomendations [8], data encoded in the RDF model is the form of subject, predicate and object triples. Both the subject and the object elements are URIs that identify a resource and the predicate represents the relation between them, also in the form of a URI.
Together, RDF and OWL provide solid basis for creating vocabularies that can be used to describe real world entities and how they are related.
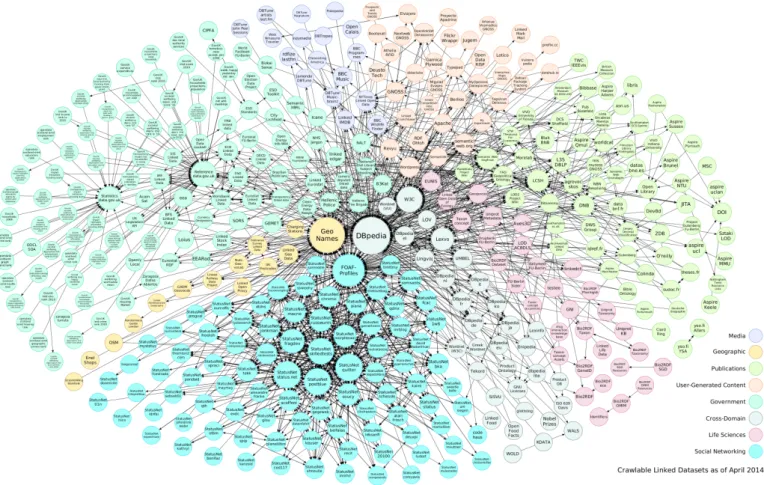
The most visible example of application is the Linking Open Data project5. Founded on 2007, the aim of the project was to bootstrap the Web of Data by identifying available exist-ing data sets, convert them accordexist-ing to the Linked Data principles and publish them on the web. From small research labs to large organizations the project has grown considerably and the scale of the Web of Data can be depicted as shown in Figure 3.
1.2. Semantic Web, Ontology & Linked Data
Figure 3.: Linking Open Data cloud - April 2014
Each node in the graph represents a distinct data set and each arc represents a link between items from the two connected data sets. Heavier arcs correspond to a greater number of links and bidirectional arcs indicate the outward links to the other exist in the data set.
1.3. Data Analytics & Visualization
1.3 data analytics & visualization
On the past years, Business Intelligence has become an important area of study for companies. Leaders and CEOs started to wonder how to get the maximum value from the information and knowledge that they already have inside their archives and databases, in order to gain advantage on the ever more global and competitive market. This lead to the development of techniques and methods to analyse and comprehend information inside companies in order to gain perspective about the company performance and predict the future of business. A well selected set of metrics about statistical data, and the use of those metrics allows companies to make informed data-driven decisions. MIT Sloan reports that companies with top perfor-mance use until five times more analytics than lower perforperfor-mance ones [11]. The field of web analytics has emerged and became a major field of research within business intelligence[6]. Based on data mining and statistical analysis, web analytics offers many analytical chal-lenges and opportunities. The web based on HTTP/HTML hyper-links associated with web search engines and directory systems helped to develop technologies for web crawling, web site ranking or search log analysis. This naturally led to research about consumer behaviour, and search trends. With the growing of semantic web and the appearance of knowledge databases, it is expectable that the web analysis become even more important, as companies will be able to identify more specific needs of their clients and answer in conformity.
As important as a good business analytics process is the presentation of the conclusions of that analysis. Direct reports with charts or other visual representation of the data is half way to ensure the comprehension of the message. This leads to the visualization field.
Visualisation is the method of communicating a message using any kind of visual representa-tion like images, charts, diagrams. This is not a new field, visualisarepresenta-tion techniques have been used for over a thousand years, for instance in ancient cartography, however, the invention of computer graphics was a massive development on this subject.
Some areas of application:
• Data analytics: using charts or maps to create reports about sets of data. • Scientific visualisations: representing data about experiments
• Product development: using software to create 3d models and design prototypes of products.
• Education visualisations: using simulations to aid the understanding of specific topics or subjects.
Visualization, combined with data analytics, specially in the area of multimedia, is, accord-ing to IBM’s 2013 Global Technologies Outlook [10] one of the main technology trends that
1.4. Motivation
will lead to industry changing products over the next years. Due to the size and complexity of the data sets available there is a growing need of companies and particular users for visual analytics tools.
1.4 motivation
For Maisis, the main motivation behind this master work is to add value to the Oobian plat-form. In the economical context of today, with a very competitive market, companies have to innovate and answer with quality products to the client’s needs. There is a growing need on the field of business analytics for tools that provide features to create reports about big collections of data. The Oobian platform is a horizontal knowledge management platform that provides better search and navigation through knowledge. Oobian extracts and indexes information from non-structured and structured data scattered inside and outside the organ-isation, transforming it into real business knowledge. One of the gaps that were identified is the lack of business analytics features in the platform. This feature could potentially improve the business intelligence processes capabilities.
For the student, the motivation is to successfully complete his master course, working and researching on an interesting field, with the added benefit of working in a professional environment.
1.5 goals
This section presents a general description of the main goals this master work intended to accomplish. Once this master work was developed as an internship in Maisis, the main goal was to develop a work that could answer to the company’s problem described previously.
The work involved in this master thesis was divided in two main phases, a theoretical one, with the study of the problem and the state of the art, and a practical one with the specification and development of a software solution.
The goals for this master work were the following:
• to make a theoretical study and to understand some key concepts as: – Oobian platform;
– Ontologies, Semantic Web and Linked Data; – Data visualization tools and techniques;
• to formalize querying mechanisms to obtain data from the Oobian core engine (Knowl-edge Server - Kserver).
1.6. Contribution
• to propose mechanisms and techniques to analyse the data about the ontologies present on the Oobian knowledge management platform;
• to create a visual user interface to present the generated reports;
• to create a mechanism to embed those visualizations into external websites. All the software modules should be integrated on the existent Oobian infrastructure. The main goal of this work is to give an extra dimension of analysis of the data present in the platform, adding value to the global user experience.
1.6 contribution
The contributions of this master work fall within two main plans. At one side, in a theoretical plan, is a theoretical study, with reading, synthesis and analysis of bibliography related with the subjects in study. At the other side, in a practical plan, is the development of software modules to achieve the specified goals. Being so, the contributions made with this work are: • Theoretical study on the state of the art about data analysis and visualization tools, as
well as core concepts as ontologies, semantic web or linked data.
• Specification of a query mechanism to retrieve data from the Oobian knowledge server using an json table accepted by Google Visualization API as output format.
• Development and integration with Oobian HTML client, of a component to create visual representations of data present on the knowledge base.
• Specification of an HTML component structure in order to allow visualizations to be embedded into web pages.
• Development of a JavaScript library to support the embedding of visualizations created on the Oobian platform with real time data.
1.7 methodology
Aiming to satisfy all proposed goals the adopted methodology was ”Getting Things Done” (GTD)[2], to control the development of activities and documentation. This methodology consists in the idea of breaking projects into small tasks and work in one task at the time. This bottom-up way of time management leads to a stress free productivity.
This master work is composed of the following steps: • Bibliographic search;
1.8. Work Plan
• Reading and synthesis of the selected bibliography; • Analysis of requirements and specification of the solution; • Development of software prototypes;
• Evaluation of the prototypes and discussion about the achieved results.
Once the work was developed in a professional context, supervision and support from the company was constant. This support was a major contribution on the process of accomplishing the proposed goals.
The supervision process translated into short meetings where the work both in development of the solution and in documentation was presented to and evaluated by Miguel Grade. In addition, when necessary, there were meetings with Prof. Pedro Henriques, in order to update the status of the development process and to discuss the writing of the documentation.
1.7.1 Development Methodology
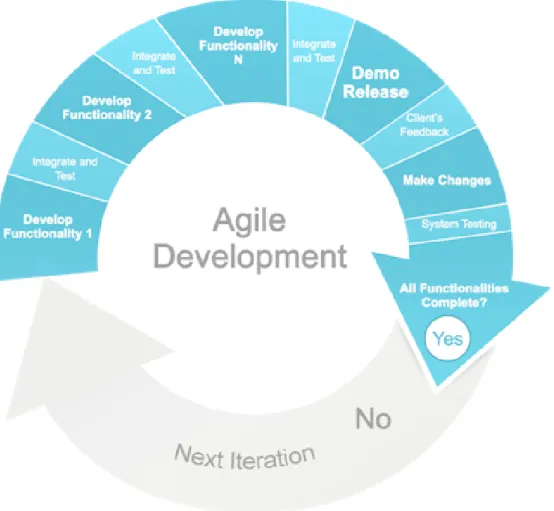
The selected methodology during the development process consisted in grouping functional requirements into small core groups. For each one of those groups, several steps were executed: implement, test, present to the supervisor, receive feedback, make necessary alterations and corrections and test again. This process translated into an agile process. Figure4depicts the process for each group of requirements.
After the requirement specification process, requirements were grouped according to the level of depth of the analysis, class, instance or cluster level. For each one of these groups figure4helps to understand the development process. As each requirement was implemented, tests were made to check if the obtained results were correct.
1.8 work plan
The duration of this master thesis was estimated in eight months. Although all main goals were well defined, initially wasn’t possible to know how many time was needed to accomplish each one. Despite that, the eight months were divided in five distinct phases. The thesis report was written in parallel with all the phases described below:
1st phase - theoretical study: This first phase was used to study the state of the art and to learn important concepts to the development and implementation of the system. 2nd phase - specification and requirement analysis: In the second phase the main
task was to specify the solution and the system requirements, which was validated by the development team and by the stakeholders.
1.8. Work Plan
Figure 4.: Agile development process
3rd phase - development: On this phase started the development of the software proto-type. This was to the longest phase.
4th phase - testing/bugfixing: After the prototype was developed the main task was to test and validate it by emulation of real world scenarios. The goal was to identify and correct possible errors or bugs to maximize the quality of the final software.
5th phase - evaluation and conclusion of the report: The last phase was used to evaluate the prototype and to draw conclusions relating the results of this evaluation and all the theoretical studies done during the master work.
1.9. Document Structure
1.9 document structure
The present thesis report is organized and structured so that the reader can understand the concepts in study, the existent problem and the achieved results that aim to answer and solve that problem. Being so, this thesis was divided into several chapters that describe theoretical concepts as well as practical results of the developed components.
• Chapter 1: Introduction - In the first chapter of the document it is presented to the user the contextualization of the problem, as well as the goals intended to be accomplished and the motivation behind the project. The working methodology followed and the work plan were also introduced.
• Chapter 2: Knowledge Management and Visualization - In the second chapter it is discussed the state of the Oobian platform, in particular, its HTML client. A study about some existent data analysis and visualization tools is also presented.
• Chapter 3: Proposed Solution - The third chapter presents to the user the proposed solution to the initial problem. First it is described the requirement specification process. Then it is explained the specification of the solution itself.
• Chapter 4: Development - Chapter four describes the development stage of the master work. Some of the used technologies are presented and the main methods and choices made during the development of the different components are explained.
• Chapter 5: Achieved Results - In chapter five, readers can see the achieved results. This chapter consists of two main usage scenarios and there are several figures depicting features and behaviours of the client and the developed components.
• Chapter 6: Conclusion - Chapter six, the final chapter, presents to the reader the main conclusions drawn from this master work, as well as possible evolutions and features that can be added in the future.
Chapter 1 was an introduction to the thesis report. In this chapter the reader found an initial overview of the context of the work and the main problem it proposes to solve. It were exposed some vital concepts to aid the understanding of the thesis, the motivation behind it and the goals Maisis intended to be accomplished.
After that it the main contributions of this work were briefly described and the work method-ology was presented.
2
K N O W L E D G E M A N A G E M E N T A N D V I S U A L I Z AT I O N
Studying the state of the art is the starting phase of a good master work. This study is important as it allows to gain a perspective of what are the works on the field and what is the state of available tools. As this master work is being developed in a specific context, part of the study of the state of the art was focused on the Oobian platform. In this chapter it is presented a study about Oobian, existing data analysis tools, and visualization tools or libraries.
2.1 oobian platform
Companies, government agencies and other organizations maintain huge amounts of informa-tion in electronic format, including spread sheets, policy manuals, web pages, to meninforma-tion just a few. Contemporary private data sets can now exceed the size of the entire Internet in the 1990s, although some organizations do not publicize their stores. The content may be stored in file shares, websites, content management systems (CMSs) or databases, but without the ability to find this corporate knowledge, managing even a small company would be hard.
Oobian1 is an horizontal knowledge management platform that provides better search and
navigation through knowledge. It extracts and indexes information from structured and non-structured data scattered in organizations and transforms it in organized business knowledge. Oobian provides a simple way of searching through all the knowledge fragments scattered all around the enterprise, offering many advantages to the common user that is trying to get his hands into specified content. Oobian connects people to the information they need to get their jobs done. General productivity suites, for example intranet search solutions, increase employee efficiency by connecting a broad set of people to a broad set of information. In comparison, search-driven applications drive measurable return on investment by helping a well-defined set of people accomplish specific business tasks more efficiently. Search-driven applications, such as research portals and 360º costumer insight solutions aggregate informa-tion from a defined set of content repositories, add structure to unstructured informainforma-tion and provide a contextual, interactive and actionable experience. Booth companies and clients
2.1. Oobian platform
efit of an increase of efficiency by a better management of the information inside a company and Oobian provides this management.
2.1.1 Oobian architecture
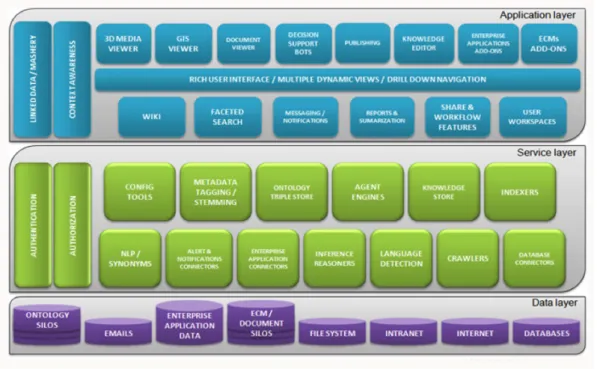
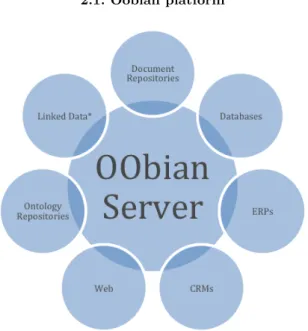
Oobian simply putting is a platform that manages to index scattered data along companies and provide it to the users. To accomplish this, it relies on a Client-Server architecture as depicted in figure5.
Figure 5.: Oobian architecture
The Oobian Server is the heart of the platform. It is responsible for all the crawling, content pipeline processing, indexing, searching and intelligent semantics. On the bottom layer of Oobian server there are several data connectors to feed content to the index. The top layer provides services that are consumed by the Oobian client. In figure 6are listed some of the supported content sources.
Once the content is picked up from its sources, it is feed to the content processing pipeline. Figure 7 shows the main stages of that process.
2.1.2 Oobian features
Here are some of the Oobian platform key features:
2.1. Oobian platform
Figure 6.: Oobian Content Sources
Figure 7.: Content Processing Pipeline
• Support for W3C Semantic Web recommendations like OWL or RDFS; • Ontology based;
• Geo-referencing support; • Highly scalable;
• SOAP and REST web service interfaces; • Documents, Knowledge and Maps integration;
Oobian Insight is the top layer of the platform. It has two modes of presentation, two clients. One in Silverlight and one in HTML5. On this master work the focus will be on the HTML client.
2.1. Oobian platform
Oobian HTML client has two main modes: • Navigation;
• Maps; Navigation
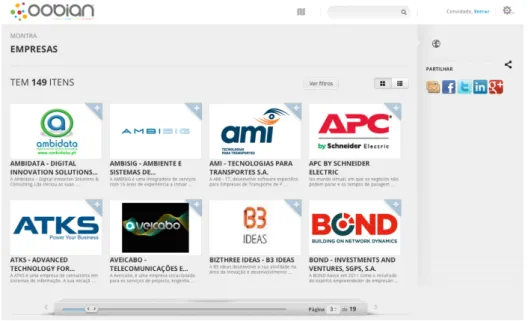
Navigation mode allows users to navigate in the knowledge base, drilling up and down classes, in a rich user interface. Figure 8 depicts a navigation scenario where an user is exploring instances of a class.
Each instance is represented as a ”box” with some details about it displayed below the instance icons. Users can navigate through pages of instances.
2.1. Oobian platform
Figure9shows some details of an instance and figure10depicts clusters of instances related to the current instance.
Figure 9.: Oobian HTML client - Instance details
2.1. Oobian platform
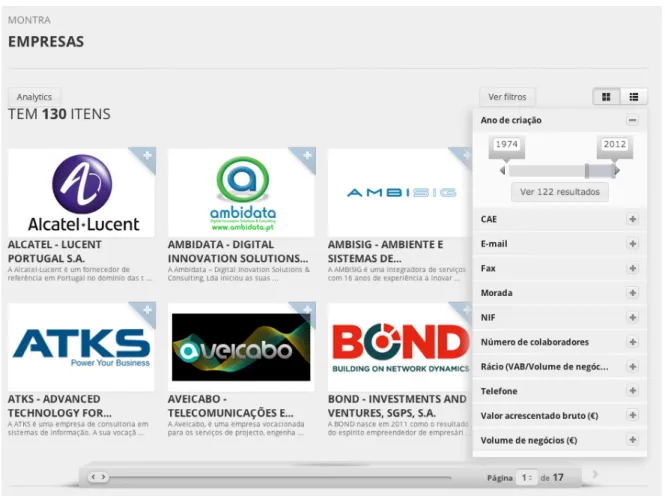
When exploring classes or clusters of instances, it is possible to filter the instances using a mechanism of faceted search.
Faceted search, or Faceted navigation is a technique for accessing information organized ac-cording to a faceted classification. Faceted classification is a form of organizing content, by assigning multiple attributes to an object, instead of a predetermined taxonomic order. These attributes, or facets are ”clearly defined, mutually exclusive, and collectively exhaustive as-pects, properties or characteristics of a class or specific subject” [3]. Lets consider an example, cars. A car has a certain brand, it is a certain colour, it is listed with a certain price and belongs to a certain vehicle class. Using facets it is possible to set up a handful of categories that will combine to fully describe a car: brand, colour, price, class. Each category is popu-lated with the right terms and organized. Then each car is classified by choosing the right terms for each category. This is a faceted classification, a set of mutually exclusive and jointly exhaustive categories, each made by isolating one perspective on the items that combine to describe all the objects in question.
Figure 11 illustrates the mechanism of faceted filtering present in Oobian client.
2.1. Oobian platform
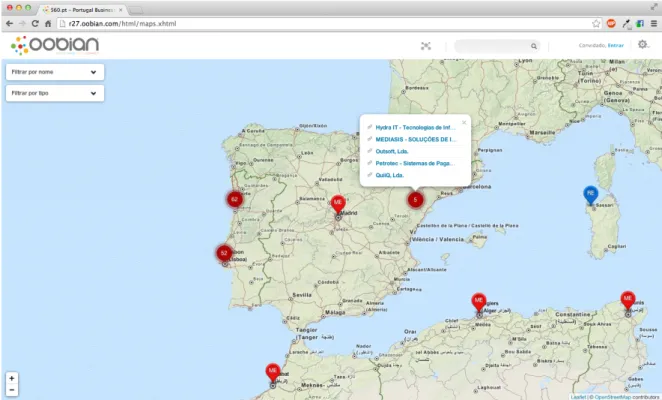
Maps
Maps mode allows users to explore geotagged instances in an interactive map, as shown in Figure 12.
2.2. Data Analysis and Visualization tools
2.2 data analysis and visualization tools
One of the main goals of this master work is to develop a component to analyse information with a visual interface. So, it is important to do a research about existing tools for that purpose. In this section are investigated and presented some of those tools.
2.2.1 Sgvizler
Sgvizler2 is a project for a ”small JavaScript wrapper” [14] which aims to create visualisations of data by rendering the result set of SPARQL queries into charts or HTML elements. This project supports a large number of visualization types. It works receiving a SPARQL query and a SPARQL endpoint from the user and translating the result set into a specific Json format. This Json is accepted by Google Charts, and the visualizations are generated using the Google Charts API. The generated visualizations can be integrated in HTML web pages by including the generated HTML elements. Figure 13 is an example of a generated HTML element.
Figure 13.: Sgvizler html element example
2.2. Data Analysis and Visualization tools
2.2.2 Google Charts
Google Charts3 is a visualization API from Google that allows users to visualize and present many different types of information by creating interactive charts. All chart types are popu-lated with data from a specific data table with a default format, making it easy to create dif-ferent charts and visualizations from the same data source. That data table can be populated directly from the web site, from a database or a Json file in a specific format. The charts are JavaScript classes with customization properties and are rendered using HTML5/SVG tech-nologies providing cross-browser compatibility. Figure14is an example of a chart created by this API.
Figure 14.: Google Charts example
2.2. Data Analysis and Visualization tools
2.2.3 IBM Many Eyes
Many Eyes4 is a web based project from IBM that provides visualizations for data upload by the users [16]. It is developed by an open web community that includes visualization experts, practitioners, academics and enthusiasts offering their expertise, aiming to provide the best format to present the data from the users. Users upload their public data, contained in spreadsheets or text files, and are presented with a variety of visualizations recommended by Many Eyes. Once the visualization is selected the users can share that visualization over the web. Figure 15 shows an example of a visualization created with Many Eyes.
Figure 15.: IBM Many Eyes visualization example
This is an interesting tool, but it is not fitted to be used by enterprises or companies, mainly because it requires for the uploaded data to be public.
2.2. Data Analysis and Visualization tools
2.2.4 Microsof Silverlight PivotViewer
PivotViewer5 is a Microsoft Siverlight control to visualize large collections of objects at once. It has a dynamic interface with several data filters, sorting and browsing features to help users to quickly find what they are searching. Figure 16 shows an example of PivotViewer.
Figure 16.: Silverlight PivotViewer example
Chapter2presented to the reader a study on the state of the art. The main subject of study was the Oobian ecosystem, in particular, its HTML client. After that, the study focused on data analysis and visualization tools and libraries.
3
P R O P O S E D S O L U T I O N
In this chapter is explained the proposed solution. In first place, it is presented the require-ment specification process as well as a general requirerequire-ments list. Then the solution itself is described, starting with its general architecture followed by more detailed explanations about the several components of the project.
3.1 requirement specification
A major part in the process of development of a software solution is the requirements spec-ification. In this section it is presented that specification, the methodology followed, the stakeholders of this work and actors that will interact with the system. Two lists with the requirements are also presented. The full requirement specification is presented in appendix A.
3.1.1 Analysis Methodology
As said before, one of the most important phases of the software development process is the process of requirement analysis. In order to maximize the quality of the analysis it is recom-mended to use a well defined methodology.
The selected methodology for the development of this work was FURPS/FURPS+ [1]. FURPS is an acronym for:
• Functionality: functional requirements describing features or capabilities that the client expects the software to have;
• Usability: describe the system from the user perspective and take into account factors like the user interface, the quality of documentation, the efficiency and the general quality of the system;
3.1. Requirement Specification
• Performance: describe the system’s performance, like response time, throughput or resource usage;
• Supportability: describe factors like the compatibility of the system, maintainability or configurability.
FURPS+ adds support for some possible needs:
• Design: restrictions that influence the design of the solution, as the use of relational databases;
• Implementation: use of specific tools or standards of development;
• Interface: factors about how the solution interacts with other systems, for instance format restrains;
• Physical: hardware needed to support the final solution.
3.1.2 Stakeholders
Once the analysis methodology is defined, it is important to identify the stakeholders of the project. A stakeholder is any person or organization that have interest in the development of the system.
There are three main stakeholders related with this master work. The first one is Maisis Information Systems, the company that provided the subject and the possibility of an in-ternship, represented by Eng. Miguel Grade. Other of the stakeholders is the trainee Pedro Moreira, that is developing this master work with the intent of finishing his masters degree. The final stakeholder is professor Pedro Rangel Henriques from University of Minho, who very kindly agreed to supervise and support this master work.
3.1.3 Actors
In this section are presented the actors that will interact with the platform. Identifying the actors is an important step on the requirement specification process, as it helps to identify particular needs of users.
There are two main actors interacting with the system: the common user of the platform and the external embedded component.
The common user while navigating in the interface, consults and filters information and has the ability to create visualizations, get the embed code of the visualization and export it as
3.1. Requirement Specification
a CSV table.
The external embedded component does requests directly to the server. In first place it makes a request to obtain a valid authentication token. After that it makes a request with the query that returns the data table with the results. Figure 17 depicts a simple use case diagram of the system.
3.1. Requirement Specification
3.1.4 Requirements
On the process of software development time and efficiency are key factors. So, it is a good practice to prioritise the different requirements, in order to hep organise the development process and obtain a final product that is as close as possible to the wanted result.
Table1presents the type of priority by which requirements will be listed.
Priority Description
Must Requirements that must be implemented in order to consider the final product a success.
Should Requirements that should, if possible, be part of the final product.
Nice Desirable requirements, implemented only if there is time to do it, without compromise the implementation of higher priority requirements.
3.1. Requirement Specification
In order to present to the reader a general view of the requirements, on this subsection are presented two lists of requirements and their priorities.
Table2 shows the first list of requirements. Functional requirements describing features and behaviours that the final solution must have.
Requirement Id Name Priority
1 HTML client integrated component Must
2 Class level analysis Must
3 Instance level analysis Must
4 Cluster level analysis Must
5 Data properties picker Must
6 Multiple visualization types support Must
7 Visualization constrains Must
8 Native query support Must
9 Google Visualization Json table output Must
10 Embed HTML component Must
11 Self updating HTML component Must
12 Interval result segmentation Must
13 Query filter support Must
14 Query limits support Should
15 Query offset support Should
16 Query operations support Nice
17 Data table export as CSV Nice
Table 2.: Functional requirements
Table3 shows the second list of requirements. Non-Functional requirements considered as restrictions both to the system and the development.
Requirement type Requirement Id Name Priority
Usability 18 Effectiveness Must
Usability 19 Efficiency Must
Design 20 Oobian platform Must
Interface 21 Oobian client Must
Physical 22 Hardware requirements Must
3.2. Proposed Architecture
3.2 proposed architecture
As said previously, the main goals of this project were to formalize a query structure, to propose an output format for the resultant data set and to represent that data set in a visual form.
Figure 18.: Architecture Block Diagram
So, the proposed solution consists on a component, to be available in the Oobian client user interface, where the user selects data properties and chart types he wants to analyse. Once the data properties are selected, a query in the specified Json format is injected into a request that is sent to a web service present in the Kserver. That request with the Json query is processed and the resultant data set is mapped into the specified Json data table format. The web service returns that data table which is then processed by the visualisation API and the charts are presented to the user. Figure 18 represents a general view of the solution.
3.3. Query Format
3.3 query format
As said before, one of the main goals of this master work was to define a query format to obtain data from the server.
The first step to accomplish this goal was to formally define a context free grammar to de-scribe the query language.
query:
'{ select :'select',from:'from',' where:'where ', limit:INTEGER',' offset:INTEGER
',' locale:''STRING'}'
;
select:
'{ operator :'STRING',properties :[ 'properties']} '
;
from:
'{ contextId :'STRING',('instanceId:STRING',)'*', namespace :'STRING'(, objPropId :'STRING')'*'}' ; where: '{'filters'}' ; properties: STRING(','STRING)* ; filters: filter(','filter)* ; filter:
STRING':''['STRING(','STRING)*']'
|STRING':''['INTEGER(','INTEGER)*']'
;
As shown in the listing above, the query has the following elements:
• Select: contains an operator(e.g., Count) and an array with a list of properties to be obtained from the server and included on the final chart. Each data property defined here corresponds to a column of the results table. The order of the data properties
3.4. Output Format
is important as it defines the order of the data columns of the result data set and ultimately the visual representation.
• From: identifies the location of the data, with the contextId representing the id of the context (class or instance id) of the ontology, the instanceId representing the id of the instance and the namespace where those ids are located. InstanceId is an optional field, as it is only needed when performing analysis of clusters related to one instance in particular objPropId represents the id of a relation, it is also optional as it is only needed when performing analysis of a particular relation of an instance;
• Where: contains a set of properties defining the criteria to filter the results of the query;
• Limit: an integer value to limit the number a results;
• Offset: an integer value to define the number of items to skip before returning results. • Locale: contains the language of the data that should be returned.
Below is an example of a valid sentence containing a query:
{
select:{operator:"null",properties:[":city"]},
from:{
contextId:": Education ",
instanceId:":Person_W - A0CgjJyz ",
namespace:"http :// www.owl - ontologies .com/CV.owl#"
},
where:{
": countryCodeSource " : [ "GB" ], ":city" : [ " London " ] }, limit:1, offset:1, locale:"pt" } 3.4 output format
With this master work, Maisis intended to specify a standard output format for the result set of the query. So, to ensure that this format was reusable if needed, the chosen solution was to create a Json file. This Json follows the rules accepted by Google Charts API. The Json file has two main properties: cols and rows.
3.4. Output Format
Cols: consists in an array of objects matching the columns of a table that describes the ID and Type of each column.
• id: identifies the column;
• label (optional): string with a label to identify the column; • type: data type of the column;
Supported data types: • string; • number; • boolean; • date; • datetime; • timeofday.
Rows: consists in an array of objects matching the rows of a table. Each row contains a array of cell (c) objects corresponding to the cells of a table.
Each cell has a v property that is the value of the cell. The data type of the cell has to match the data type of the correspondent column.
Example of a Json structure with 3 columns and 5 rows.
{
"cols": [
{"id": "col_1 ", "label ": "year", "type": " string "}, {"id": "col_2 ", "label ": "sales ", "type": " number "}, {"id": "col_3 ", "label ": " expenses ", "type": " number "} ], "rows": [ {"c":[{"v":"2001"},{"v":"3"},{"v":"5"}]}, {"c":[{"v":"2002"},{"v":"5"},{"v":"10"}]}, {"c":[{"v":"2003"},{"v":"6"},{"v":"4"}]}, {"c":[{"v":"2004"},{"v":"8"},{"v":"32"}]}, {"c":[{"v":"2005"},{"v":"3"},{"v":"56"}]} ] }
3.5. Embed component
3.4.1 CSV Table
Having defined that the output of the service was going to be a Json string containing a table, it was only logic to choose CSV as the format to the export feature.
CSV (Comma Separated Values or Character Separated Values) is a simple file format widely supported by business, consumer and scientific applications, that stores tabular data in a plain-text formt. This means that the file is a sequence of characters with no data that has to be interpreted. A CSV file can store any number of records, separated by line breaks. Each record consists of fields separated by a character, for example a comma or a semicolon, as illustrated in the following listing.
Number of employees;Companies
1 -10;58 100 -500;22 50 -100;14 10 -25;13 25 -50;12 3.5 embed component
One of Maisis initial goals for this work was to develop a mechanism to embed visualizations created by users, with the help of Oobian client, into their own websites.
To accomplish this goal, the proposed solution was to dynamically generate an HTML com-ponent that could easily be copied and integrated in a web page source code.
Below is depicted an example of a generated component.
<div id=" knowledge1404490905747 "
data-knowledge-address="http ://172.27.192.180:8080 "
data-knowledge-service="/ Knowledge /rest/ kanalytics /data"
data-knowledge-user=" jujn9P4BXK + U2MGahmo0Vg =="
data-knowledge-pass="dZW+ Md37p1sDdhNUaJcF6w =="
data-knowledge-query="{ 'select ' : { 'operator ' : null , 'properties ' : [ ': anoCriacao ' ] },
'from ' : { 'contextId ' : ': Empresa ', 'namespace ' : 'http :// www.tice.pt/ ontology /tice.owl#' }, 'where ' : { '' : [ ] },
'limit ' : 0, 'offset ' : 0, 'locale ' : 'pt ' }"
data-knowledge-chart=" BarChart "
3.5. Embed component
style="width :600 px; height :400 px"> </div>
In HTML 5 it is possible to store custom data attributes in HTML components. These stored data-* attributes can later be used in the JavaScript pages to create richer and engag-ing user experience.
The generated embed component has the following structure:
• id: Id of the component. In order for this id to be unique, it is composed by the word knowledge followed by the timestamp of the time when it was created. This way it is possible to include several components in the same page without having duplicated ids; • data-knowledge-address: Address where the Kserver is located;
• data-knowledge-service: Contains the specific web service signature that returns the data;
• data-knowledge-user: Contains an encrypted user name to login into the kserver; • data-knowledge-pass: Contains the correspondent password;
• data-knowledge-query: Contains the specific query for obtaining the desired results. • data-knowledge-chart: Visualization type;
• data-knowledge-title: Visualization title;
• style: Contains the styling of the component, namely the width and the height of the visualization.
Chapter3focused on the specification of the proposed solution. In this chapter, the solution itself was presented to the reader. Starting from the requirement specification process followed by the specification of the several proposed components, specific aspects of the proposed solution were described.
4
D E V E L O P M E N T
This chapter of the document aims to present the development stage of the master work. It is made a description of the main methods, choices and results obtained while developing the solution. This chapter is divided in several sections, in order to explain the several components that were developed, both client and server side. To aid the understanding of what was developed, this chapter is illustrated with several pictures and diagrams.
4.1 client side
As said previously, the Oobian platform is based on a well defined Client - Server architecture. Being so, the developed solution is based on the same architecture that was introduced in the previous chapter and depicted in 18
Oobian HTML client is based on the JavaServer Faces (JSF) framework. JSF is a ”standard Java framework for building user interfaces for Web applications.” It is based on a component-driven design model and uses XML files called view templates or facelets. The FacesServlet processes requests, loads the appropriate view template, builds a component tree, processes events and renders and HTML response to the client.
In JSF exists the concept of composite components, special types of templates that act as a component. Any component is essentially a piece of reusable code that behaves in a particular way. A composite component consists of a collection of markup tags and other existing components. This reusable component has a customized, defined functionality and can have validators, converters, and listeners attached to it like any other component. With Facelets, any XHTML page that contains markup tags and other components can be converted into a composite component. Figure 19 depicts a simple diagram of JSF architecture.
In order to integrate the desired Knowledge Analytics module in the Oobian client the approach chosen was to develop a composite component that could be easily integrated in the interface, as the one listed in figure 20.
This interface module should provide a slider panel with a menu to select which property to analyse, the type of visualization to create, both limit and offset inputs to specify the set of
4.1. Client side
Figure 19.: JSF architecture
Figure 20.: Knowledge Analytics composite component
results, and the number of segments. This number of segments defines the number of intervals to split the results when performing analysis of numeric or temporal properties.
Once this panel is a JSF composite component, the only work needed to include it in an existent page is to call it and pass context parameters.
Figure21 shows the slider panel described above, integrated in the interface at a class level. JSF uses Managed Beans to separate presentation from business logic. Program logic is contained in the bean implementation code and JSF simply refers to bean properties. Basi-cally, a managed bean is a specialized Java class that synchronizes values with components, processes business logic and handles navigation between pages.
It is possible to define the scope in which beans are stored. There are the following scopes available:
• Application (@ApplicationScoped): Application scope persists across all users’ inter-actions with a web application.
• Session (@SessionScoped): Session scope persists across multiple HTTP requests in a web application.
• View (@ViewScoped): View scope persists during a user’s interaction with a single page (view) of a web application.
4.1. Client side
Figure 21.: Analytics panel
• Request (@RequestScoped): Request scope persists during a single HTTP request in a web application.
• None (@NoneScoped): Indicates a scope is not defined for the application. • Custom (@CustomScoped): A user-defined, non-standard scope.
To support the composite component, it was developed a view scoped managed bean. This knowledge bean is the core of the client side as it handles all the logic of the component.
According to user’s interaction with the interface, it builds a query object, and serializes it in a Json string. To do this serialization the choice was to use Jackson. Jackson is a suite of data processing tools for Java, among which are included libraries as the Object Mapper or Object Writter that allows to serialize Java objects to Json strings and deserialize Json strings back to Java objects.
4.1. Client side
In JSF it is possible to inject dependencies of managed beans into other managed beans. Oobian HTML client has several managed beans to handle different operations. When develop-ing the Knowledge Analytics component this was taken into account and several dependencies were included in the Knowlege bean. Figure22shows an extract of the Knowledge bean where these dependencies are injected.
Figure 22.: Extract from Knowledge bean: managed properties
For example, facetedSearchBean handles the logic behind the faceted search features of the client. The best way to include filters when building a query was to use filters that users apply when navigating in the client. So when users create a visualization it is created with the filtered set of data and reflect what users define in the faceted filtering mechanism.
4.1. Client side
Once created the query object is parsed by Jackson into a Json string and posted into a web service request sent to the Knowledge Analytics REST web service (figure 23). As response, the web service returns a Json string containing a data table with the format specified in chapter 3.
4.1. Client side
The data table is read by a JavaScript function (see figure 24) included in the component and the visualization is drawn in a pop-up.
4.1. Client side
4.1.1 Component Integration and Configuration
As said previously, Oobian HTML is based on JSF and it is a modular platform. It can be configured to include or not to include modules in order to meet users needs. These configurations are stored on a properties file that is read by a configurations managed bean that defines if the modules are rendered or not in the HTML client.
Knowledge Analytics was developed as a composite component, intended to be a module, so its configurations are stored on that same properties file. Figure 25 shows an extract of that properties file.
Figure 25.: Extract from the configurations file There are the following configurable properties:
• enabled: a boolean that defines if the component is enabled;
• exportCsvEnable: a boolean that defines if the export as csv feature is enabled; • embedChart: a boolean that defines it the visualization embedding is enabled;
• defaultLimit: an integer to define the default Limit of the query to limit the result set; • defaultOffset: an integer to define the default Offset the result set;
• defaultChartWidth & defaultChartHeight: integers to define the default dimensions, in pixels, of the visualization on the client;
• defaultEmbedWidth & defaultEmbedHeight: integers to define the default dimensions, in pixels, of the visualization when embedded on an external web site.
4.2. Server side
4.2 server side
As said previously (see Chapter 3, Figure 18), Knowledge Analytics component relies on a Client-Server architecture. In the previous section the main aspects of the development of the client side were presented to the reader; in this section are presented the main aspects of the development of the server side.
In the core of the server side are several REST web services, developed using the Jersey framework. Java defines REST support via the Java Specification Request (JSR) 311. This specification is known as JAX-RS. Jersey is a Java framework for developing RESTful web services, that provides support for JAX-RS APIs and serves as JAX-RS reference implemen-tation.
JAX-RS uses annotations to define the REST behaviour of Java methods:
• @PATH : Path to the base URL + /created_path. The base url is defined by the application name, the servlet and the URL from the web.xml configuration file;
• @POST: Indicates that the method answer to an HTTP POST request; • @GET: Indicates that the method answer to an HTTP GET request; • @PUT: Indicates that the method answer to an HTTP PUT request;
• @DELETE: Indicates that the method answer to an HTTP DELETE request;
• @Produces(type): Defines which MIME type is delivered by the method, for example ”text/plain” or ”application/Json”;
• @Consumes(type): Defines which MIME type is consumed by the method; • @PathParam: Used to inject values from the URL into a method parameter.
4.2. Server side
Figure 26.: REST web service interface
Figure26shows an extract of the interface of the developed services, each one has a specific address either the encrypted login credentials, or the Json data table.
• getLogin is used by the embedded visualization to perform login on the platform. It an encrypted user/password pair and returns a valid temporary OAuth access token. • getTableForComponent receives, from the external embedded component, an access
to-ken and a query for a class level analysis as parameter. Returns a valid Json string containing a table with the data for the visualization.
• getTableForClient receives, from the HTML client, an access token and a request object containing a query for a class level analysis. It returns a valid Json string containing a table with the data for visualization.
• getTableForClientCluster receives, from the HTML client, an access token and a request object containing a query for a cluster level analysis. Returns a Json string containing a table with the data for visualization.
4.2. Server side
• getTableForComponentCluster receives, from the external embedded component, an ac-cess token and a Json string with the query for a cluster level analysis. Returns a Json string containing a table with the data for visualization.
• getTableForComponentClusterRelations receives, from the external embedded compo-nent, an access token and a Json string with the query for an instance level analysis. Returns a Json string containing a table with the data for visualization.
• getTableForClientClusterRelations receives, from the HTML client, an access token and a request object containing a query for an instance level analysis. Returns a Json string containing a table with the data for visualization.
Each one of these services parses the query and fills the output table with data retrieved from an Enterprise Java Bean(EJB) of the Oobian Kserver.
4.3. Visualization Embedding
4.3 visualization embedding
So far in this chapter it were presented and described some of the key aspects of the devel-opment stage. It was explained how the client and the server side of the component were developed. In this section it is described another one, the visualization embedding.
One of the goals Maisis had for the project was to allow users to embed visualizations, charts or tables, (created in Oobian) into external web sites for example personal, or company web pages.
As explained in Chapter3, the proposed solution was to develop a feature to create a custom HTML element, a div, with custom HTML 5 data-* attributes. These attributes were then read by a JavaScript library would retrieve the query string, make an HTTP request to the correspondent web service, obtaining the data table and then render the visualization embed-ded into the web page content. Figure28 shows the developed pop-up with the HTML code of the div element that can be embedded into an web page.
Figure 28.: Popup with the embedding code
The first problem encountered when developing this solution was about how to guarantee access to the data. Oobian server requires an OAuth access token as authentication. In the client, this token is created via login, with a registered user/password pair.
This seemed a good starting point, but having the user/password pair, or a token included in the component, in the ”open”, was obviously out of question.
4.3. Visualization Embedding
In the process of creating the visualization, in the Oobian Client, users are logged in and have a valid user session. So, when generating the embed code in the client, user’s credentials are encrypted using an AES Cipher algorithm with Maisis own secret key.
Having the credentials encrypted allowed to include them in the embed code.
In the developed JavaScript library, a login() function reads the encrypted user/password pair from the embed component, makes a request to the login web service on the server. This web service decrypts the credentials, generates a valid access token and returns it in the response. Once obtained the token, it is just a question of including it in the HTTP with the query in order to authenticate the KServer and retrieve the Json data table to draw de visualization. The next problem was how to deal with duplicate id’s and how to allow the embedding of multiple visualizations into the same page.
To deal with the duplicate id problem, the choice was to append a timestamp to the id of the div, when generating the embedding code. This way, each generated component has a unique id.
To draw multiple visualizations in the same page, the solution was to include a function in the JavaScript library to create an array containing all the elements with a specific attribute, in this case, the custom data-knowledge-query attribute. Figure 29 shows this function.
4.3. Visualization Embedding
Once the array with the correct id’s for the elements is built, for each one of those elements, the main JavaScript function gets the needed values from the custom data-* attributes. It makes an HTTP request and draws the visualization with the data table presented on the HTTP response. Figure 30 shows an extract of that function.
Figure 30.: Extract from the drawFromEmbed function
Chapter 4 focused on the development stage of the master work. Here, the reader found a technical perspective of the solution, with the exposition and explanation of some of the key aspects and choices made during the development process.