7
Assessing the hospital survey of patient safety culture.
A review of the assumptions, methods and data analysis protocol
[1]
Kevin Barros Azevedo
[2]
[email protected]Carlos Alberto da Silva
[3] [email protected]António Abrantes
[4]
[email protected]Resumo
O tema segurança do paciente está a tornar-se num dos tópicos mais discutidos nas instituições de saúde, nomeadamente ao nível dos hospitais. O objetivo deste artigo é apresentar uma revisão da estrutura do mode-lo de questionário Hospital Survey on Patient Safety Culture (HSOPSC) e analisar sumariamente as principais investigações que foram desenvolvidas utilizando este modelo de questionário para explicar as dimensões da cultura de segurança do doente. Este instrumento foi criado pela Agency for Healthcare Research and Quality (AHRQ), dos Estados Unidos da América e tornou-se num modelo comummente usado neste país bem co-mo internacionalmente, com ou sem adaptações.
Palavras-chave: Segurança do doente, hospital, questionário, qualidade, cultura. Abstract
Patient safety theme is becoming one of the most discussed theme in healthcare facilities, mainly at hospitals. The main aim of this paper was to present a review of the structure Hospital Survey on Patient Safety Culture model (HSOPSC) and analyze in a brief summary of the main researches that were developed recently using this survey model to explain the patient safety culture dimensions. This instrument was created by the Agency for Healthcare Research and Quality (AHRQ) and became a survey commonly used in the United States of America and increasingly used internationally, with or without adaptations.
Keywords: Patient safety, hospital, survey, quality, culture.
Introduction
Unsafe healthcare provided to patients results in numerous millions of patients suffering injuries or even death, worldwide (Baker et al. 2004).
A patient can be defined as a person “who is a
recipi-ent of healthcare, itself defined as services received by individ-uals or communities to promote, maintain, monitor or restore health. Patients are referred to rather than clients, tenants or consumers, although it is recognized that many recipients such
as a health pregnant woman or a child undergoing immuniza-tion may not be regarded, or regard themselves, as patients. Healthcare includes self-care” (World Health
Organiza-tion, 2009). The definition of this concept has a great importance, because all this research is based on the most important element of healthcare – the patient. The patient is the center of each healthcare process, such as simple plain x-ray or a more com-plex magnetic resonance examination.
According to the World Health Organization (2009), safety can be defined as the “reduction of risk
8
of unnecessary harm to an acceptable minimum. An accepta-ble minimum refers to the collective notions of given current knowledge, resources available and the context in which care was delivered weighed against the risk of non-treatment or other treatment”. Due to the human nature of the
healthcare professionals, the presence of unneces-sary harm will occur at some point in the healthcare processes, however, the probability of so, should be kept as minimal as possible. To maintain this possi-bility as low as possible, it is of greater importance to keep each healthcare process (such as a plain ra-diography or the intravenous catheterization of a patient) updated, according to the current national or international standards. Also, the continuous professional development, which is mandatory in some developed countries, is a good way for healthcare professionals to continue to learn and grow throughout their careers, allowing them to keep their skills and knowledge updated and to work safely, legally and effectively (Health and Care Professions Council, 2014).
Adverse events related to healthcare are a frequent circumstance of healthcare provided at hospitals (Vries et al. 2008). This is an undesirable fact that evolved as a serious problem, being responsible for the death of more patients per year than breast can-cer or acquired immunodeficiency syndrome (AIDS) (Vries et al. 2008). The occurrence of ad-verse events is one important indicator of patient safety. Adverse events are defined “as unintended
inju-ries or complications that are caused by healthcare, rather than by the patient’s underlying disease, and that lead to death, disability at the time of discharge or pro-longed hospi-tal stays” (Baker et al. 2004).
The sum of two concepts stated above, namely pa-tient and safety, results in the concept of papa-tient safety, which can be defined as “the reduction of risk of
unnecessary harm associated with healthcare to an acceptable minimum. An acceptable minimum refers to the collective notions of given current knowledge, resources available and the context in which care was delivered weighed against the risk of non-treatment or other” (World Health
Organiza-tion, 2009).
In other words, patient safety can be regarded as the result or outcome of safe healthcare processes de-veloped by the professionals. This is the ultimate
goal of the whole healthcare staff, however, each process is always dependent on the safe care envi-ronment of the department (Kristensen et al. 2007). Adverse events can occur in all places where healthcare is delivered. Most of the knowledge de-veloped on this theme derive from research in hos-pitals, because the risks involved are higher for the patient. However, many adverse events occur in other healthcare settings such as private medical offices, nursing homes, pharmacies, community clinics or even the homes of patients (World Health Organization, 2004).
Patient safety theme is becoming one of the most discussed theme in healthcare facilities, mainly at hospitals. This topic is regarded as a structural and structuring component of the health processes de-veloped and a very important variable of the holistic concept of quality in healthcare (Fernandes & Quei-rós, 2011).
Healthcare is a very complex field of practice, where professionals from very different areas (multidisci-plinary) work together. Despite the strong depend-ence on self-acting, where the team factors and the organizational factors have a very important role (Fragata, 2010) the need to check safety culture from the inside assumes a very important role (Chen & Li, 2010), mainly when the institutions are making the effort for improving the quality of healthcare provided.
The complexity and magnitude of this problem, at the hospital level, was systematically evaluated. The majority of damage caused to patients could have been avoided (by more than a half). The number of adverse events (unintended damage that may result in patient suffering or even death and is related with the healthcare process and not the underlying dis-ease) occurring in inpatients was 3.7%, and 13.6% of these adverse events resulted in death of the pa-tient (Brennan et al. 1991).
If the professionals share a patient safety culture, with a positive result of increasing it at the healthcare institutions, a way to reduce the occur-rence of adverse events as much as possible emerg-es. By learning from the outcomes of the errors and by the restructure of the processes, all aiming to
9 avoid errors or incidents, it is possible to create a culture where patient safety is regarded as an achievable main goal (Handler et al. 2006).
The safety culture develops as a result of values, attitudes, competences and patterns of individual or group behaviour, determining the compromise, the style and the expertise of safety healthcare (Health and Safety Comission, 1993).
To establish and develop a safety culture in the whole healthcare, such as a hospital, or in a specific department, the first step is to determine their cur-rent level of safety culture (Provonost et al. 2004). All the healthcare facilities, including the Radiology Departments aim to deliver a high quality examina-tion at the lowest possible risk of harm to the pa-tient. Unfortunately, this goal is difficult to be achieved completely, and errors will happen in the processes developed. It is very important that healthcare professionals and managers are aware that the possibility of error is always present and thus should create the need to identify weak areas of the healthcare processes that require close attention in order to intervene and reduce the occurrence of errors as much as possible.
To address areas of potential weakness, where er-rors can easily happen, several measuring tools, such as surveys made to the professionals, can be used. Much of these tools allow to access the patient safe-ty culture of an entire institution or department. Most of the research worldwide uses quantitative surveys to measure safety culture, and at the same time propose changes in the patient safety by im-plementing interventions, targeting several dimen-sions of safety accessed in those surveys.
The main aim of this paper was to present a review of the structure Hospital Survey on Patient Safety Culture model (HSOPSC) and analyze in a brief summary of the main recent researches that were developed recently using this survey model to ex-plain the patient safety culture dimensions.
1- The emergence of Safety as an
Organiza-tional Culture
Some industries with potential hazardous environ-ment like the aviation or the nuclear power plants assess consistently their general safety and some of the historical ways to measure it were based on re-ported data of employee injuries or fatalities (Colla et al. 2005). Nowadays, this idea of safety has changed in a way that not only technical failures are causes of accidents, but organization, management and human factors all together are considered the causes of accidents (Weick et al. 1999).
Based on this new opinion of safety, these indus-tries started to use predictive measures to evaluate safety, with emphasis to the concept of safety cli-mate, which usually refers to the quantifiable con-stituents of the safety culture. This safety culture structure depends on management behaviours, safe-ty systems implemented and, maybe the most im-portant, the employee perception about safety and its importance (Guldenmund, 2000).
There is a commonly accepted rule that states that each person, when performing one task, regardless the task, will, in some point of that task, commit a mistake or, also named, an error (Fragata, 2011). Errors can be avoided through the conception of systems which hinder their occurrence and that en-able the correct procedures to be carried out. For example, some modern vehicles are designed in a way that drivers cannot start them without depress-ing the clutch or, another example, airplane pilots are scheduled in a way that they do not fly many hours uninterruptedly, to not compromise their fo-cus and consequently their performance (Kohn et al. 2000).
Derived from the previous human related rule that at some point an error will be made, every human being that work with the same complex systems may do similar types of errors, if subjected to simi-lar conditions. This rule brings more emphasis to learn from errors that happened in other high risk industries, as the design of error preventing systems and the need of a cultural change inside healthcare organizations (Department of Health, 2002).
10 The immediate causes of accidents are frequently identified as human error or technical failure, but the research and analysis on the circumstances around major accidents for instance, the space shut-tle “Challenger” or “Columbia”, several accidents with buildings and vehicles such as planes or trains or even nuclear incidents, show that besides the immediate causes, there are several questions related to more extensive aspects. These aspects are related to the whole organization (The Institution of Engi-neering and Technology, 2012).
It becomes clear that basic failures in organizational structure, culture and procedures may induce an accident in an organization. This environment is being more and more described in terms of percep-tions, beliefs and behaviours that are generally shared inside the organization.
Safety culture is defined as “the product of individual
and group values, attitudes, perceptions, competencies, and patterns of behaviour that determine the commitment to, and the style and proficiency of, an organization’s health and safe-ty management” (Sorra & Nieva, 2004).
1.1- The emergence of Patient Safety concept It is a paradox to note that patients may suffer any type of harm while they are under a healthcare pro-cedure.
In the Radiology Department, a possible severe consequence to the patient is the administration of iodinated contrast material. This procedure is used in x-ray based techniques and aims to improve the diagnostic accuracy of that technique. However, this procedure as an inherent risk of develop an allergic reaction that might become fatal despite it is very low, less than one in 130,000 at most (Bettmann, 2004). It is clear that a risk versus benefit must be done by the healthcare team regarding this proce-dure to each patient, however, healthcare is very complex and the results of each procedure are influ-enced by several factors.
It is unavoidable that inside any healthcare organiza-tion, patients may be negatively affected, and in
each encounter between the patient with the healthcare provider, the possibility of damage is present (Sandars & Cook, 2007).
“Primum non nocere” is a Latin adage attributed to Hippocrates and means a simple, but at the same time, very important concern that must be remem-bered “first do no harm”.
This has been the axiom of healthcare professionals for the past decades, and in the last few years, socie-ty had paid close attention to this subject (Harmsen et al. 2010; Nagel & Nagel, 2007).
In 1854, during the Second World War, a nurse named Florence Nightingale collected data on sol-diers’ deaths, and she realized that many of them were dying due to health problems acquired after their admittance into the hospital, at a higher rate than from the lesions the lead them to the hospital. This nurse introduced actions to increase the hy-giene and the standardization of healthcare proce-dures and she accomplished her goal to decrease the dead rate among soldiers in the hospital (Shell & Karen, 2008).
Healthcare can be seen in many ways as an industry, it involves a high risk of causing some kind of mor-bidity or even mortality, which makes it an industry that is prone to hazard (Kohn et al. 2000).
Patients seek healthcare to reduce their suffering associated to health problems. From this statement, it is important to define what the meaning of health is.
“Health is a state of complete physical, mental and social
well-being and not merely the absence of disease or infirmity”
(World Health Organization, 1948). Despite this definition has been written more than sixty years ago, this has not changed since then.
This definition has in its core the whole human be-ing, since it does not restrict health to the organic state alone, but says for example, that the human being is required to have good mental and social conditions, such as a balanced psychological state or employment and a house to live.
11 Nevertheless, while the healthcare system or service is provided with the capability to cure disease or relieve suffering, it can also origin greatly unneces-sary harm to the patients. This potential to cause harm to patients, should not be regarded as a suita-ble, or common, consequence of providing healthcare.
Nowadays there exists a large acceptance and awareness of the problem on the clinical error and a determination, in some sectors at least, to face them. But, despite the awareness and the efforts made to avoid them, they are as old as medicine itself (Vincent, 2010).
Since the report of the Institute of Medicine entitled “To Err is Human: Building a Safer Health System” in 1999, healthcare organizations spent tremendous attention on this theme (Blendon et al. 2002; Health et al. 2000) and developed a wide range of patient safety efforts (Altman et al. 2004; Leape & Berwick, 2005). The healthcare organizations should adopt organizational models and strategies of other high risk industries to minimize the errors and reduce the damage to patients, as much as possible, appealing to a consistent pattern of safety and improving the patient safety (Kohn et al. 2000).
Some numbers about errors are presented, to better understand the magnitude of this problem. Errors cause between 44000 and 98000 deceases every year in American hospitals and over 1000000 injuries (Kohn et al. 2000).
Other patients are daily exposed to possible errors, but are fortunate to suffer no noticeable damage (Aron & Headrick, 2002).
Preventable harm that can result in severe disability can occur in 1 in every 10 patients admitted to a hospital, and 1 in every 3000 patients may die due to an adverse event (Nagel & Nagel, 2007).
Baker et al. (2004) found that medical errors are the eighth more important cause of death in the USA. They also state that data on this subject, from other countries, are similar.
Jha et al (2010) suggested that damage due to the intervention of healthcare happens too frequently
and that a considerable part of this damage is pre-ventable. These authors states that to reduce harm caused to patients requires a directed, ingenious and properly managed research. Also, the authors claim that this is the way to achieve a better understanding of its sources and contributing elements.
The multidisciplinary approach with which this sub-ject has been understood, rapidly emerged a change in paradigm and soon a new subject was introduced – Patient Safety. Most of the attention regarding patient safety has been placed to hospitals, because at this level of the healthcare there is an evident presence of high-risk procedures and is always in a potentially hazardous setting.
The publication from Harvard Medical Practice Study alerted the healthcare professionals and the governing entities to the extent of clinical errors. More than 30000 hospital records of patients, in a random selection of 51 hospitals in the New York state, carefully were analysed. The adverse events observed were long term hospitalization due to oth-er causes than the base pathology, physical debility when discharged or death due to healthcare proce-dures. The percentage of admissions that resulted in an adverse event was 3.7%. The proportion of ad-verse events that could have been prevented was 58% (Sandars & Cook, 2007).
These results were confirmed in a similar study car-ried out in intensive care units in Colorado and Utah, with 2.9% of the admissions resulting in ad-verse events, 53% of them were avoidable (Vincent, 2010).
One of the largest researches was carried out in Australia, where 805 incidents of 324 general practi-tioners were analysed. The estimated rate of adverse events was 40-80 by 100000 appointments, 76% were avoidable and 27% had the potential to cause severe damage to patients. In a study conducted in the United Kingdom about prescriptions emitted by general practitioners and then analysed by pharma-cists, 0.13% were identified as potential causes of adverse reactions (Sandars & Cook, 2007).
This last rate may seem insignificant, but it is im-portant to consider that more than a million ap-pointments take place every day and 1.5 million
pre-12 scriptions are generated on a daily basis (Vincent, 2010).
In a revision of 4031 adult admittances in a hospital, from 11 medical and surgical departments of two hospitals in United States of America, there were 6.5 adverse events derived from medication record-ed, for each 100 admissions, and 28% of these med-ication errors were avoidable (Wilson et al. 1995). Medication related adverse events are also common in primary healthcare, with 13-51% of all reported incidents being related to medication. In two studies done in the United Kingdom about the reason for admission in hospitals, about 6% were considered as a result of a medication related adverse event that was avoidable (Sandars & Cook, 2007). Others types of adverse events are avoidable infections, surgical and diagnosis errors and the events that include medical equipment (Wilson, et al., 1995). Several studies that have been examined, point to similar numbers (10 adverse events by 100 admis-sions). In 65% of these cases, there is no harm to patient, in 30% damage occurs, 5% severe damage happens, including death, and 50% can be avoided (Fragata, 2011).
1.2- Patient Safety and medical erros?
The majorities of medical errors are preventable (Leape et al. 1991). These errors are due to a set of several contributing elements such as poor process-es, poor methods, improper setting, fading equip-ment’s and/or poor management.
According to what has been said, Patient Safety can be understood as the delivery of healthcare without any kind of error.
Patient safety represents a worldwide public healthcare problematic which affects countries and levels of development. World Health Organization (WHO) Patient Safety, known as the World Alliance for Patient Safety was established in 27th October 2004 and intended to gather global efforts to in-crease the healthcare safety for patients in all WHO
state members, by reducing the number of disease, damages and deceases caused to patients through-out therapeutic or diagnostic procedures (World Health Organization, 2008; Shermam et al. 2009; Nagel & Nagel, 2007).
There are various fences to understand the nature of human error. There is an inherent possibility to fail just because of being a human. In fact, the price of this humanity is the reliability. From the Latin axiom errare humanos est it is possible to understand that this an ancient awareness that keeps very actual since there is no known area where humans work that does not present flaws of process or result (Fragata 2011).
Some contributing factors to fail may be fear of re-taliations and absence of comment after errors are reported (Jeffe et al. 2004), not fully distributing and working with error reports (Farley et al. 2008) and a perceived lack of system changes subsequent to er-rors that occurred (Harper & Helmreich, 2005). In an ageing population, healthcare consumers are presenting more and more complex and chronic diseases and patients are becoming active partici-pants rather than passive receivers of care (Liza-rondo et al. 2010).
The several types of errors and harm to the patient are classified regarding domain, or where they oc-curred, along the spectrum of healthcare processes and facilities.
The error is defined as the deviation of a result from a pre-established plan or the use of a wrong plan to achieve a given goal, both impossible to achieve. The error supposes that there was a plan and that the error was involuntary.
According to Fragata and Martins (2006), it is pos-sible to err actively, or by commission, and passive-ly, or by omission. Lapses or flaws are considered automatic and due to the lack of agility or attention, while mistakes are errors due to poor planning, poor use of the rules or poor rationale of the pro-fessional.
According to the same authors, honest errors are done by persons that follow the rules, the processes
13 and that accomplish their obligations and they still error due to their human condition. There might be some responsibility of the professional, but there is no liability possible, while in the negligence cases, where errors happen due to disrespect of the rules and good practices, there must be direct liability of the professional.
At last, according to the same authors, a near miss is an error that could have caused physical, or other type of damage to the patient. The possibility did not occur because the patient physiologically resist-ed to the error or some other barrier to the error prevented it, just in time, allowing recovery of the accident trajectory and aborting it without conse-quences.
According to Leape et al (1993) there are typically four types of errors in the healthcare area, that can even happen simultaneously:
• Diagnostic errors that include error or delay in diagnosis of a pathology in the patient; • Failure to employ indicated tests to detect the
pathology in a patient;
• Use of outdated tests or therapy due to lack of continuous profession al development and;
• Failure in the performance expected, based on the outcomes of monitoring or testing the patient.
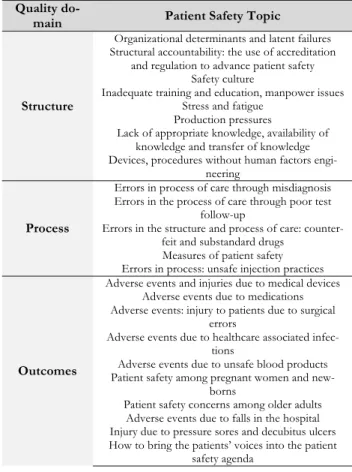
According to Jha et al (2010), experts examined evi-dence and identified (table 1) important breaches concerning developing, transitional and developed countries. These topics were divided in three quality domains:
• Structural factors
An important cause of unsafe care is the col-lapse of intricate processes, also known as organizational accidents. These failures derive from several factors from different system levels and may include latent failures (Reason, 2005). Worldwide, lack of healthcare profes-sionals properly trained is a fact that impairs safety. In 2006, WHO released the notice that in 57 countries, there was a lack of 2.4 million general practitioners, nurses and midwives
(World Health Organization, 2006); • Processes
Lack of diagnosis is not enough studied, but is the base of an important kind of error in healthcare. It presents broadly rates of de-layed and/or mistaken diagnosis. This hap-pens also in developed countries regardless of their available technology. In these countries, at least 10% to 15% of diagnoses are inap-propriate (Graber et al. 2005).
• Outcomes
At all interactions between professionals and patients there is a chance of an adverse event to occur, affecting the result of the healthcare system. For example, in Canada, 7.5% to 10.4% of inpatients suffer damage due to medication errors (The Canadian Adverse Events Study, 2004).
Table 1: Major Patient Safety Topics Quality
do-main Patient Safety Topic
Structure
Organizational determinants and latent failures Structural accountability: the use of accreditation
and regulation to advance patient safety Safety culture
Inadequate training and education, manpower issues Stress and fatigue
Production pressures
Lack of appropriate knowledge, availability of knowledge and transfer of knowledge Devices, procedures without human factors
engi-neering
Process
Errors in process of care through misdiagnosis Errors in the process of care through poor test
follow-up
Errors in the structure and process of care: counter-feit and substandard drugs
Measures of patient safety Errors in process: unsafe injection practices
Outcomes
Adverse events and injuries due to medical devices Adverse events due to medications Adverse events: injury to patients due to surgical
errors
Adverse events due to healthcare associated infec-tions
Adverse events due to unsafe blood products Patient safety among pregnant women and
new-borns
Patient safety concerns among older adults Adverse events due to falls in the hospital Injury due to pressure sores and decubitus ulcers How to bring the patients’ voices into the patient
safety agenda Source: Based on Jha, et al. (2010)
14 1.3- Patient Unsafety
Patient unsafety occurs when errors take place and could be divided as acts of omission (failing to do the right thing) or commission (doing something wrong), as mentioned before. Any of this acts result in dangerous healthcare circumstances and/or unin-tentional damage to the patient (World Health Or-ganization World Alliance for Patient Safety, 2006). Patient outcome is the impact upon a patient, which is totally, or partially attributable to unsafety (Shermam et al. 2009).
According do World Health Organization, each time a patient is harmed by the health system, it is a betrayal of trust. These so-called adverse events are actually reverse events. Instead of advancing peo-ple’s health and well-being, medical errors send them backwards, causing more harm than good (World Alliance for Patient Safety, 2006)
Incident: A Patient incident is an episode or situation
that could have, or did produced, a needless damage to a patient that Wagner and Van der Wal (2005) defined as an unintentional episode during the healthcare process that produces, could have produced or still might end in dam-age to the patient. A patient incident can be as simple as a reportable circumstance, a near miss explained before, a no harm incident or a harm-ful incident (adverse event) (Shermam et al. 2009). An incident type is a descriptive word for a class formed of a group of incidents with a common origin.
Accident: An accident was defined by Fragata (2011)
as an undesirable occurrence that affected the healthcare process and that comprmised, in a complete manner, the final intended outcome, resulting disturbances or major consequences that will be permanent.
Adverse Event: Zegers et al. (2007) defined an adverse
event as an unintended damage that resulted in momentary or perpetual incapacity, decease or extended hospital stay, and is caused by healthcare processes instead of patient’s primary disease. The adverse events are not mandotorily caused by errors or negligency attitudes, could
avoidable or unavoidable and surely cause loss of eficiency and increase of monetary costs (Fraga-ta, 2011). According to the same author, events can be divided in major events and minor events:
• Major events occur during a diagnostic or in-terventional procedure and threatens the pa-tient's life immediately, imposing immediate life saving actions. Usually, these events cause relevant physical damage.
• Minor events also occur during a diagnostic or interventional procedures but, unlike the major events, do not threaten patient’s life immediately and directly. The most frequent minor events are called flux disturbances and they could be as simple as a phone ringing. However, these events seem to have a cumu-lative effect and can end in a major event.
Never Event: The Department of Health’s Patient
Safety Policy team also has described what a never event is. Never events are defined as “se-rious, largely preventable patient safety incidents that should not occur if the available preventa-tive measures have been implemented by healthcare providers” (Department of Health, 2011). Fragata (2011) defined a never event as severe adverse events that cause damage to pa-tient or even death, occuring always in an unex-pecred way and are isolated in time. This type of event suggests the need for a research to identify processes or organizational flaws that could re-veal the cause of that accident. These events de-fine an organization’s risk and safety and usually have close mediatic attention due to their out-comes. These events are those that never should have happened. To be a never event, an incident must include the following criteria:
• The incident has strong probability for, or has caused severe harm or death;
• There is proof of the similar happening in the past;
• There is existing national international rec-ommendations to prevent this event from happening;
• Happening is easy to define, identify and can be accessed continually.
15 The occurrence of this type of events indicate the organisation may not have put in place the right systems and processes to prevent the inci-dents from happening and thereby prevent harmful outcomes. It is also an indicator of how safe the organisation is and the patient safety culture within that setting.
Danger, Risk and Error Chain: Danger is present
when there is chance for potential adversity, that propiciates the occurrence of adverse events with damage as the outcome. Danger could also be seen as an agravating to the initial risk of a given procedure (Fragata, 2011). According to the same author, the inherent risk is an unavoid-able risk, associated to a procedure, such as a given diagnositic or treatment, that is present even when done in ideal conditions, with the best equipment and best team possible. The aditional risk is what patients will be exposed, besides the inherent risk, when victims of safety errors or avoidable circumstances. The error chain designates that a accident usually is conse-quence of a seconse-quence of errors, involving the complex organizational causes such as the blun end and the sharp end. The only way to study these sequence of causes is the technique of root cause analysis.
2- The Hospital Survey on Patient Safety
Culture
The patient safety culture as a dimension on healthcare quality, is crucial as a way to add value to the organizational culture. The Hospital Survey on Patient Safety Culture (HSOPSC) is an instrument to access patient safety culture commonly used worldwide and, consequently, in countries with in-homogeneous levels of development in regards to the healthcare.
The HSOPSC was developed by a research organi-zation that was contracted by the Agency for Healthcare Research and Quality (AHRQ), from the United States of America. This research was subsi-dised by the Medical Errors Workgroup of the
Quality Interagency Coordination Task Force (QuIC) (Sorra & Nieva, 2004).
The goal of the authors of this survey was: “To
devel-op a reliable, public-use safety culture instrument that hospi-tals could administer on their own to assess patient safety culture from the perspective of their employees and staff”
(Agency for Healthcare Research and Quality, 2004).
The researchers started the development of this survey by reviewing the literature related to patient safety. Then, several surveys on patient safety were reviewed and hospital staff was contacted about this topic.
The pre-test to initial survey was carried out with hospital professionals with the aim of confirming if all the items were understandable. The authors used two techniques to pre-test the survey: the cognitive testing and the external review of the survey. The purpose of cognitive testing is to investigate the adherence of participants to respond questions. At the same time, it is intended to know if respondents comprehend the question and if they provide truth-ful responses. The cognitive testing technique guar-antees that a survey question successfully detects the holistic scientific intent of the question and, at the same time, makes sense to the respondents (Centers for Disease Control and Prevention, 2005).
The performance of a question skimmed with cog-nitive testing can be summarized in the following four stage question-response process:
1. Comprehension 2. Retrieval 3. Judgment 4. Response
To execute cognitive testing, semi-structured inter-views are usually conducted, with a small number of participants, similar to the participants that the sur-vey is intend to be used with. The authors will un-ambiguously check how participants understood a question and how they formulated an answer. Un-like a field test, the primary goal of a cognitive test is to provide an in-depth exploration of particular concepts, processes and patterns of interpretation
16 instead of produce statistical data that can be uni-versal for an entire population.
As a result, cognitive testing is done to a selected and small intentional sample (Centers for Disease Control and Prevention, 2005).
Cognitive interviews were conducted by the au-thors, with the following staff (Agency for Healthcare Research and Quality, 2004):
• A nurse supervisor. • A risk supervisor. • A section clerk. • A dietician.
• A food services member. • A respiratory therapist. • A pharmacist
• A pathologist
• Several nursing, resident and general practi-tioners from different Unites States of Amer-ica hospitals.
The authors also requested for evaluations of the draft survey from other investigators that were fa-miliarised with safety culture issues, a hospital man-ager, a group of general practitioners, as well as the Joint Commission on Accreditation of Healthcare Organizations (JCAHO).
The final pilot survey included of 79 items assessing 14 dimensions of patient safety culture (Agency for Healthcare Research and Quality, 2004a,b).
2.1- Draft HSOPSC Pilot Survey
The draft HSOPSC pilot survey evaluated the sev-eral dimensions in a five point Likert answer scale, stating degrees of agreement, ranging from strongly disagree to strongly agree, or frequency, ranging from never to always (Agency for Healthcare Re-search and Quality, 2004a,b).
2.1.1- Review of methodology and statistical analyses of draft HSOPSC
The sampling technique used by the authors of the survey, to carry out the pilot study, was purposive sampling, in order to ensure that all of the job cate-gories were included.
The pilot survey was administered to a sample of 21 hospitals from six different United States of Ameri-ca states. The authors gathered information from ten different hospitals.
Additionally, information from one Veterans Health Administration (VHA) hospital and ten hospitals from Georgia were sent to researchers by the VHA and the Emory Center on Health Outcomes and Quality.
The hospitals sample was designated in order to be the most inhomogeneous possible, including several regions, teaching levels of the hospital, sizes of the hospitals. This inhomogeneity is essential to guaran-tee that the most different types of healthcare facili-ties are represented in the results of the pilot survey, thus enhancing the strength of data.
In addition, two organizations were hospitals that aim to get profit, one organizations was a veterans' hospital, and one was a geriatric hospital.
For the ten hospitals that were part of the sample, the researchers delivered a cover letter presenting the research, the survey itself, a envelope to return the completed survey.
Researchers also arranged contact elements in each hospital that helped them to distribute and to col-lect surveys in the hospitals. There were one hospi-tal that the envelope was sent to the home of the participants, instead of their workplace.
The results from the pilot survey were statistically analysed. The statistics aimed to check the con-sistency, the validity and the factor structure of the survey, using exploratory factor analysis and con-firmatory factor analysis. The final version of HSOPSC was made by keeping the best items. A total of 1437 surveys were returned, from the
17 4983 sent to several healthcare institutions, resulting in a 29% response rate. The survey used in the pilot study, as the final version of Hospital Survey on Patient Safety Culture, includes few demographic questions to prevent that confidentiality problems arise.
Most of the respondents were female (81%) and 84% of the participants had direct interaction with patients. The average age of the participants was 43 years old and they worked for about 10 years on that healthcare facility.
About the statistical analyses done to the items in the Hospital Survey on Patient Safety Culture, the main goal was to obtain “a shorter, revised survey instrument, based on conceptually meaningful, in-dependent, and reliable safety culture dimensions, with three to five items measuring each dimension” (Sorra & Nieva, 2004).
Sorra and Nieva (2004) used exploratory factor analyses on the data obtained from the survey to explore the dimensionality. The main components extraction was used and the varimax rotation, to maximize the independence of the factors.
The exploratory factor analysis showed the exist-ence of multiple factors (that can also be considered as dimensions of the survey). Almost all of these distinct factors were the same as the groupings made during the construction of the survey with eigenvalues equal to 1.0, or greater.
The total variance explained by the 14 components or factors is 64.5%, with almost all items loading highly on only one factor (with a factor loading greater than or equal to 0.40).
To further examine the dimensionality of the sur-vey, Sorra and Nieva (2004), took into account the previous culture dimensions, and carried out a con-firmatory factor analysis (CFA). The CFA is used to analyse all the variables simultaneously, intending to find the subjacent structure to the whole variables group (Hair, et al., 2006). So, CFA allowed to test the fit of a model with a number of factors suggest-ed and additionally specifisuggest-ed the items that account for each factor given, based on the exploratory fac-tor analysis.
The authors achieved, after CFA, a final model with 12 dimensions:
• Two outcome dimensions.
• Ten safety culture dimensions composed by three or four items each, with a total of 42 items. These safety culture dimensions are split in three groups, the internal context, the external context and the outcome or result variables.
The authors of this survey used several model fit indices. They found that all fit indices met the crite-rion for good conformance with indices at 0.90 or above (Sorra & Nieva, 2004). The closer each of these indices is to 1.00, the better the fit of the model to the data, as shown and explained below:
• The comparative fit index (CFI): The fit of a model refers to the ability of that model to replicate the data. So, a well-fitting model is one that is equitably consistent with the hy-pothesized one. Also a good-fitting meas-urement model is required before inferring the causal pathways of the structural model. Nowadays, there are several fit indices. In the Incremental Fit Index (IFI), also called Rela-tive Fit Index (RFI), the value of zero indi-cates the worst possible model (null or inde-pendence model) to the value of 1 indicates the best possible model. The Absolute Fit Index (AFI) supposes that the best fit model has a fit of 0. So, the measure of fit then de-fines how far the model is from perfect fit. Finally, after reviewing the fit indices, the CFI is only interpretable when comparing two different models. In this case, the value of 0 indicates a non-fitting model while the value of 1 indicates a perfectly adjusted mod-el (Pestana & Gageiro, 2014). It is hmod-elpful to distinguish CFI from AFI, because this last one does not need a comparison between two models.
• The goodness-of-fit index (GFI): The GFI gives information on the proportion of correla-tions between the original variables that can be explained by the model. The GFI varies between 0 and 1, where 0 indicates no
ad-18 justment of factorial analyses to the data and the closer to 1, the higher the proportion of data explained by the model. As indicators of the adjustment quality, it is suggested by Pestana and Gageiro (2014) that for the in-terval between 0.90 and 0.95 (excluded) the GFI should be considered reasonable, or ad-equate and for the interval beteween 0.95 (in-cluded) and 1 the GFI should be considered good. Values below 0.5 are nor acceptable. • The adjusted GFI (AGFI): The AGFI is the
GFI (explained above) adjusted to the de-grees of freedom (df) relative to the number of observed variables and therefore can be used in less complex models with fewer pa-rameters (Schermelleh-Engel et al. 2003). AGFI values range between 0 and 1 with larger values indicating a better fit. Usually for this index, values above 0.90 indicate a good fit relative to the baseline model, while values greater than 0.85 may be considered as an acceptable fit. Values below 0.5 are nor acceptable.
• The normalized fit index (NFI): The NFI, or al-so known as Bentler-Bonett Index (BBI), is an incremental measure of fit. The best pos-sible model is defined as model with a chi-square (χ2) of zero and the worst model by the χ2 of the null model. A NFI value be-tween 0.90 and 0.95 is considered to show acceptable fit, above 0.95 is considered a good fit. Values below 0.5 are considered to be a poor fitting model. When NFI equals one, the target model is the best possible im-provement over the independence model (Schermelleh-Engel et al. 2003).
• The non-normalized fit index (NNFI): The NNFI, or also known as Tucker-Lewis Index (TLI) is another incremental fit index that, unlike the NFI (or BBI) has no penalty for adding parameters. If the index is greater than one, it is set at one. It is interpreted as the BBI, meaning that the best possible mod-el is defined as modmod-el with a chi-square (χ2) of zero and the worst model by the χ2 of the null model. Also, in the same way as BBI, a
TLI value between 0.90 and 0.95 is consid-ered to show acceptable fit, above 0.95 is considered to have a good fit and below 0.50 is considered to be a poor fitting model. • The Root-Mean-Square Error of Approximation
(RMSEA) achieved in the pilot survey was 0.04 (Sorra & Nieva, 2004). This is an amount of approximate fit of the model to the population and is therefore concerned with the discrepancy due to approximation, per degree of freedom. This measure is lim-ited below by zero and the fit is better when the value of RMSEA is closer to 0. It is said the model has a good fit to the data if the RMSEA value is 0.05 or less. Values between 0.05 (excluded) and 0.08 can be considered as an adequate fit, and values between 0.08 (ex-cluded) and 0.10 as a poor fit. RMSEA values above 0.1 are not acceptable, because the model does not fit to the data achieved and therefore the model should be excluded. This measure is regarded as relatively independent of sample size, and additionally favours par-simonious models (Schermelleh-Engel et al. 2003).
Furthermore, the composite scores are calculated by obtaining the mean of responses to the items in each dimension, varying from 1 (low score) to 5 (high score). These scores were originated from the five point Likert scale. It is important to take in to account that some items should be reverse coded, since some questions were negatively worded (Sorra & Nieva, 2004).
The authors Sorra and Nieva (2004) calculated the correlation between the dimensions based on the composite scores estimated. The construct validity can be evaluated by the relation between composite scores and it is proposed to have moderate correla-tions (between 0.20 and 0.40) or weak correlacorrela-tions (less than 0.2). If the correlation between two di-mensions is high (equal or above 0.85) these dimen-sions are considered to measure the same construct, so they should be linked and some items can be eliminated. In the pilot survey of HSOPSC, correla-tions between the safety culture composites or scales ranged from 0.23 (Nonpunitive Response to
19 Error and Frequency of Event Reporting) to 0.60 (between Hospital Management Support for Patient Safety and Overall Perceptions of Safety).
Moreover, the authors, in the pilot survey of HSOPSC performed an ANOVA by hospitals to check if there was greater response variability on the safety culture dimensions between hospitals. Re-member that the One-Way Anova explores the ef-fect of one factor in the endogenous, or dependent, variable, testing if the means in each category of the respective factor are the same or not between them-selves. The use of this test in independent samples demands the following assumptions (Pestana & Gageiro, 2014). The observations in each group have normal distribution or, at least, symmetric; the variance of each group is the same between them-selves, thus being homocedastic. They found that all these test results on each of the 12 composites had statistical significance, supporting the hypothesis that hospitals have differentiated scores on each dimension. This means that different hospitals have different composite scores on regards to safety cul-ture outcome variables and dimensions (Sorra & Nieva, 2004).
3- From Dimensions and Outcome
Varia-bles of HSOPSC to Items and Reliability
Analysis of each dimension of HSOPSC
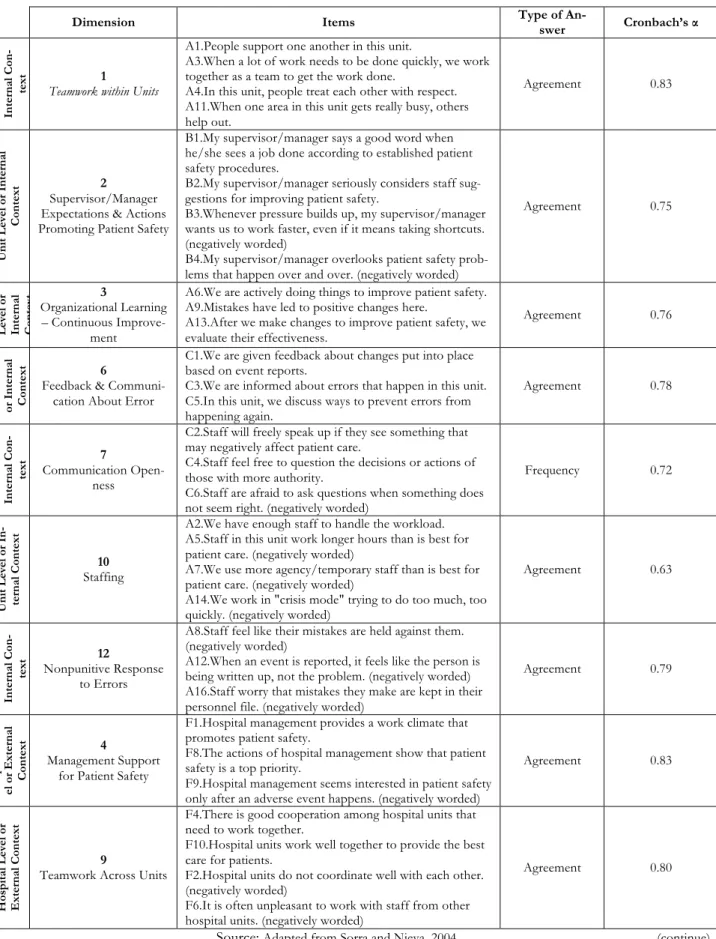
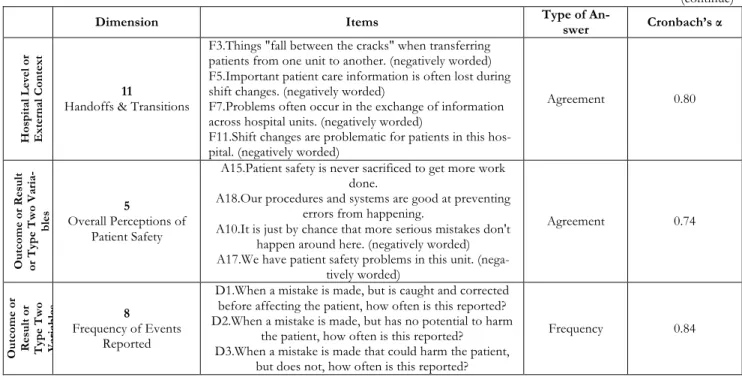
The Hospital Survey on Patient Safety Culture sur-vey emphasizes the patient safety characteristics as well as error and event reporting.
This survey measures seven unit-level dimensions of safety culture, also called internal context. These dimensions together compose what can be classified as the internal context, when referring to a given unit or department:
• Supervisor/Manager Expectations & Actions Promoting Safety (4 items);
• Organizational Learning – Continuous Im-provement (3 items);
• Teamwork within Units (4 items); • Communication Openness (3 items);
• Feedback and Communication about Error
(3 items);
• Nonpunitive Response to Error (3 items); • Staffing (4 items).
In addition, this survey measures three hospital-level dimensions of safety culture, also called external context. These dimensions together compose what can be classified as the external context, when refer-ring to a given unit or department:
• Hospital Management Support for Patient Safety (3 items);
• Teamwork Across Hospital Units (4 items); • Hospital Handoffs and Transitions (4 items). Additionally, this survey measures two outcome dimensions, also called result variables, which were included in the final format. These dimensions to-gether compose what can be classified as the results of type 1:
• Overall Perceptions of Safety (4 items); • Frequency of Event Reporting (3 items); Finally, this survey also measures the following out-come single item variables. These two variables can be named as the results of type 2:
• Patient Safety Grade (of the Hospital Unit or Department) (1 item);
• Number of Events Reported (1 item);
In Fig. 2 it is possible to observe a schematic inter-pretation of the final Hospital Survey on Patient Safety Culture in a more comprehensive way. The Hospital Survey on Patient Safety Culture, as stated above, is composed of twelve dimensions and two outcome variables.
In total, the HSOPSC presents 42 items, numbered and divided by letters from A to G. Some of the items, as explained below, are negatively worded. This means that, when computing the scores of the-se items, thethe-se answers should be reverthe-se coded. This is of major importance, for example, to calcu-late the percentage of positive answers to each item.
20 Fig. 2: Safety culture dimensions and outcome
measures of HSOPSC
Source: Based on Jha, et al. (2010)
In tables in annex it is possible to observe the groups of dimensions (divided by internal context, external context and outcome or result or type two variables), their respective items, the outcome varia-bles and the possible answers along a five point Lik-ert scale are presented. The LikLik-ert scale used, as mentioned above, is composed by response scales of agreement (“Strongly Disagree”, “Disagree”, “neither Agree nor Disagree”, “Agree” and “Strong-ly Agree”) or frequency (“Never”, “Rare“Strong-ly”, “Some-times”, “Most of the time” and “Always”) In addi-tion, the reliability statistics, using the Cronbach’s α, based on the pilot test data from 21 hospitals and more than 1,400 professionals (Agency for Healthcare Research and Quality, 2014) are provid-ed for each one of the dimensions.
This survey has also two more single-items desig-nated as outcome or result or type one variables. These single items are presented in the table in an-nex.
4- Worldwide Psychometric Validation of
HSOPSC
Several researchers worldwide dedicated to the psy-chometric validation of Hospital Survey on Patient Safety Culture to their countries, with the aim of checking the accuracy of this instrument. After its translation and adaptation to the semantic of the respective country, the researchers have written and published peer reviewed papers of results about the cultural context in which this instrument is intended to be used.
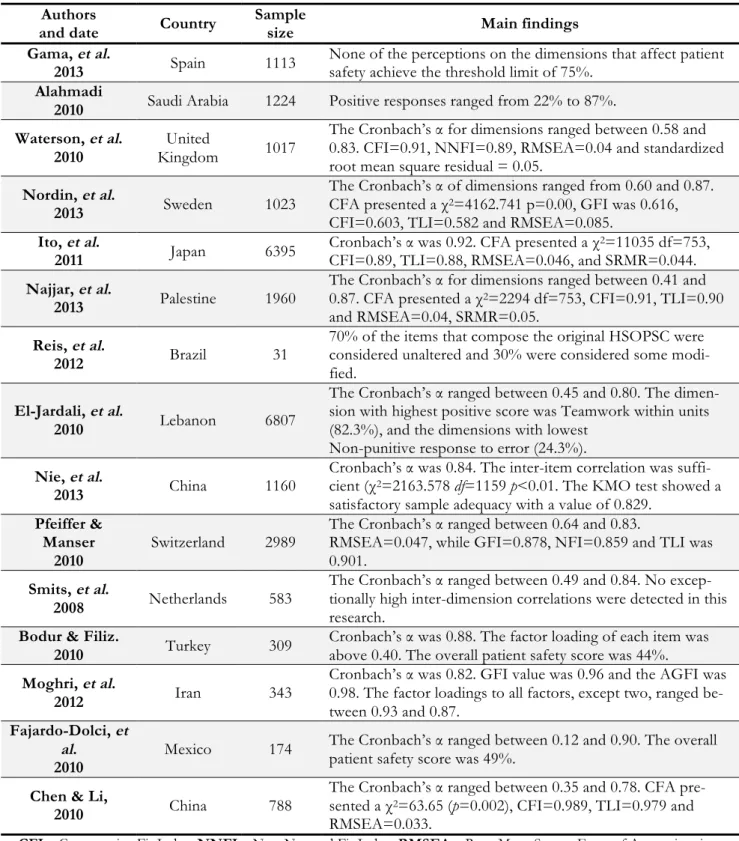
In table 2 it is presented a brief summary of the main recent researches that were developed recently using the Hospital Survey on Patient Safety Culture. In the study entitled “Cultura de seguridad del pa-ciente y factores asociados en una red de hospitales públicos españoles” developed by Gama et al (2013), the percentage of positive perceptions re-garding patient safety was 73.5% for the dimension “Teamwork within units” and 63.2% for the dimen-sion “Supervisor/Manager expectations & Actions promoting patient safety”. None of the participants’ perceptions on the dimensions that affect patient safety achieved the threshold limit of 75%, meaning that no strengthened areas of patient safety exist. The dimension “Staffing” obtained 61.0% of nega-tive responses, this one being very important area to improve. In this research, 90% of the participants have direct contact with patients, which is an origi-nal characteristic of this study. Other professioorigi-nal categories such as clerks or porters were not includ-ed since they do not neinclud-ed a university level degree to develop their duties and, because of that, may not be able to fully understand the patient safety con-cept. This research was done with a sample of 1113 healthcare workers from several areas and from 8 different Hospitals. 62.3% of the participants were nurses and 30.8% were physicians. The response rate of this research was 35.4%.
21
Table 2: Recent researches using the HSOPSC
Authors
and date Country
Sample
size Main findings
Gama, et al.
2013 Spain 1113 None of the perceptions on the dimensions that affect patient safety achieve the threshold limit of 75%. Alahmadi
2010 Saudi Arabia 1224 Positive responses ranged from 22% to 87%. Waterson, et al.
2010 Kingdom United 1017
The Cronbach’s α for dimensions ranged between 0.58 and 0.83. CFI=0.91, NNFI=0.89, RMSEA=0.04 and standardized root mean square residual = 0.05.
Nordin, et al.
2013 Sweden 1023
The Cronbach’s α of dimensions ranged from 0.60 and 0.87. CFA presented a χ2=4162.741 p=0.00, GFI was 0.616,
CFI=0.603, TLI=0.582 and RMSEA=0.085. Ito, et al.
2011 Japan 6395
Cronbach’s α was 0.92. CFA presented a χ2=11035 df=753,
CFI=0.89, TLI=0.88, RMSEA=0.046, and SRMR=0.044. Najjar, et al.
2013 Palestine 1960
The Cronbach’s α for dimensions ranged between 0.41 and 0.87. CFA presented a χ2=2294 df=753, CFI=0.91, TLI=0.90
and RMSEA=0.04, SRMR=0.05. Reis, et al.
2012 Brazil 31
70% of the items that compose the original HSOPSC were considered unaltered and 30% were considered some modi-fied.
El-Jardali, et al.
2010 Lebanon 6807
The Cronbach’s α ranged between 0.45 and 0.80. The dimen-sion with highest positive score was Teamwork within units (82.3%), and the dimensions with lowest
Non-punitive response to error (24.3%). Nie, et al.
2013 China 1160
Cronbach’s α was 0.84. The inter-item correlation was suffi-cient (χ2=2163.578 df=1159 p<0.01. The KMO test showed a
satisfactory sample adequacy with a value of 0.829. Pfeiffer &
Manser 2010
Switzerland 2989
The Cronbach’s α ranged between 0.64 and 0.83.
RMSEA=0.047, while GFI=0.878, NFI=0.859 and TLI was 0.901.
Smits, et al.
2008 Netherlands 583
The Cronbach’s α ranged between 0.49 and 0.84. No excep-tionally high inter-dimension correlations were detected in this research.
Bodur & Filiz.
2010 Turkey 309
Cronbach’s α was 0.88. The factor loading of each item was above 0.40. The overall patient safety score was 44%. Moghri, et al.
2012 Iran 343
Cronbach’s α was 0.82. GFI value was 0.96 and the AGFI was 0.98. The factor loadings to all factors, except two, ranged be-tween 0.93 and 0.87.
Fajardo-Dolci, et al.
2010
Mexico 174 The Cronbach’s α ranged between 0.12 and 0.90. The overall patient safety score was 49%.
Chen & Li,
2010 China 788
The Cronbach’s α ranged between 0.35 and 0.78. CFA pre-sented a χ2=63.65 (p=0.002), CFI=0.989, TLI=0.979 and
RMSEA=0.033.
CFI – Comparative Fit Index; NNFI – Non-Normed Fit Index; RMSEA – Root Mean Square Error of Approximation; CFA – Confirmatory Factor Analysis; χ2 – Chi square test; GFI – Goodness-of-Fit Index; TLI – Tucker Lewis Index; SRMR – Standardized Root Mean square Residual; HSOPSC – Hospital Survey on Patient Safety Culture; df – degrees of
22 In another research entitled “Assessment of patient safety culture in Saudi Arabian hospitals” developed by Alahmadi (2010), the rate of positive responses ranged from 22% to 87%. Strengthened areas of patient safety were “Organizational learning – Con-tinuous improvement” (87%), “Teamwork within units” (84%) and “Feedback and communication about errors” (77%). Areas with potential of being enhanced were “Number of events reported” (43% of the participants did not reported any event in the past twelve months), “Non-punitive response to error” (22%), “Staffing” (22%) and “Teamwork across units” (27%). In addition, it was found that management interest in patient safety is only trig-gered after the occurrence of an adverse event. Leadership should view errors as an opportunity to improve, because a blame culture influences the ability to evaluate errors negatively. This research was done with a sample of 1224 professionals, from several professional categories in 13 general hospi-tals. In this research, the sample was composed by 60% of nurses, 8.3% of physicians and 7.6% of al-lied health professionals in hospitals. The response rate of this research was 47.4%.
In the study entitled “Psychometric properties of the Hospital Survey on Patient Safety Culture: find-ings from the UK” developed by Waterson et al. (2010), the main findings show a positive opinion with regard to the safety culture of the participants workplace. From all the surveys distributed, 1461 were returned, from which only 1017 had given val-id responses to the 40 items. The response rate of this research was 37%. The Cronbach’s α for di-mensions ranged between 0.58 and 0.83. The con-firmatory factor analysis (CFA) proved poor level of adequacy, the comparative fit index (CFI) was 0.91, the non-normed fit index (NNFI) was 0.89, and the root mean square error of approximation (RMSEA) was 0.04 and standardized root mean square residu-al (SRMR) was 0.05.
The SRMR is an absolute measure of fit and is de-fined as the standardized difference between the observed correlation and the predicted correlation. Because the SRMR is an absolute measure of fit, a value of 0 indicates perfect fit and the SRMR has no penalty for model complexity. This measure indi-cates the quality of the adjustment of the model to
the factorial analysis and values lower than 0.05 in-dicate very good fit, values between 0.05 (included) and 0.1 (excluded) indicate good fit and values equal or higher than 0.1 are unacceptable. The sociodem-ographic data present a sample composed by 60% of nursing staff, 21% of allied health professionals, 11% of management staff and 8% of medical staff. Less than half of the sample worked in their current hospital for more than 5 years.
The research entitled “Swedish Hospital Survey on Patient Safety Culture – Psychometric properties and healthcare staff’s perception” developed by Nordin et al. (2013), had a response rate of 48%. The sample was composed by 64% of registered nurses, 29% of enrolled nurses and 7% of physi-cians. Two more dimensions were added to the original HSOPSC survey. Two dimensions showed positive responses with scores above 75%. The Cronbach’s α of dimensions ranged from 0.60 and 0.87 and to the new dimensions ranged between 0.81 and 0.72. The translated HSOPSC had CFA with a chi square test (χ2) of 4162.741 significance value (p) of 0.00, goodness-of-fit index (GFI) was 0.616, CFI was 0.603, Tucker Lewis index (TLI) was 0.582 and RMSEA was 0.085. This cross-sectional research was done based on 1117 returned surveys, from which 1023 were valid. The sample was com-posed by 3 hospitals. The inclusion criteria was to be a registered nurse, enrolled nurse or physician. Also, they had to be working for more than 3 months, servicing grade of 50% or more and not have had one extended absence from work. The overall response rate was 48%.
The study entitled “Development and applicability of Hospital Survey on Patient Safety Culture (HSOPS) in Japan” developed by Ito et al. (2011), had a Cronbach’s α of 0.92, with scores ranging from 0.46 and 0.88 in several dimensions. The translated HSOPSC to Japanese language presented, in a twelve factor model, a CFA with χ2=11035, 753 degrees of freedom (df), CFI was 0.89, TLI was 0.88 and RMSEA was 0.046 and SRMR. Polychoric correlations were calculated for the 12 dimensions. The highest correlation was between tion Openness and Feedback” and “Communica-tion about Error”. The lowest correla“Communica-tion was be-tween “Frequency of Event Reporting” and
“Staff-23 ing”. “Frequency of Event Reporting” also showed small correlations to other dimensions, ranging be-tween 0.04 and 0.37. “Overall Perceptions of Safe-ty” had medium correlations, ranging from 0.39 to 0.54. The 12 dimensions Japanese HSOPSC had a valuable role to access patient safety culture in Ja-pan. This research was done with a sample of 6395 professionals, from 13 acute care general hospitals. Different professional groups participated. 61% were nurses, 10.7% were clerks, 8.4% were physi-cians, 7.5% were allied health professionals and the remaining were other professional groups in hospi-tals. The response rate was 74.9%.
In the study entitled “The Arabic version of the hospital survey on patient safety culture: a psycho-metric evaluation in a Palestinian sample” devel-oped by Najjar et al. (2013), was found that only the dimension “Frequency of Event Reporting” scored a reliability coefficient higher than 0.8 (0.87). The global Cronbach’s α was not specified. The lower reliability coefficient was 0.41 in the dimension “Communication Openness”. The translated HSOPSC to Arabic language presented, in a twelve factor model, a CFA presented a χ2 of 2294 with df=753, CFI of 0.91, a TLI of 0.90 a RMSEA of 0.04 and a SRMR of 0.05. This research was done with a sample of 2022 returned surveys, from which 1960 were valid to be used. 13 Palestinian hospitals participated in this research. Most of the respond-ents were nurses (51.3%), followed by physicians (17.7%), management and administrative staff (10.5%), allied health professionals (9.4%), related healthcare professionals (5.4%) and others (4.7%). The study entitled “Adaptação transcultural da versão brasileira do Hospital Survey on Patient Safe-ty Culture: etapa inicial” developed by Reis, et al. (2012), showed that, in accordance to the translation team experts and the target population in Brazil, 70% of the items that compose the original HSOPSC were considered unaltered and 30% were considered somewhat modified. No researches on transcultural adaptation and psychometric evalua-tion of HSOPSC to the Portuguese language were found. This research was done with a sample of 31 professionals, from different hospitals in Rio de Janeiro, which answered the pre-test designed to evaluate the verbal comprehension and clarity of
each question.
In the study entitled “The current state of patient safety culture in Lebanese hospitals: A study at baseline” developed by El-Jardali et al. (2010), was found that the dimensions with highest positive score were “Teamwork within units” (82.3%), “Hospital management support for patient safety” (78.4%) and “Organizational learning and continu-ous improvement” (78.3%). Dimensions that scored the lowest were “Handoffs and transitions” (49.7%), “Staffing” (36.8%) and “Non-punitive re-sponse to error” (24.3%). 60% of the participants reported that they had not completed any report on adverse events in the last year and 70% graded the patient safety of their hospital as Excellent. The reliability coefficient ranged from 0.45 in dimension 5 “Overall perception of patient safety” and 0.80 in dimension 8 “Frequency of events reporting”. This research was done with a sample of 6807 returned surveys, from the 12250 surveys sent to 68 Leba-nese hospitals. About the composition of the partic-ipants group, 57% were nurses, 13.7% were clerks and allied health professionals and 3.7% were physi-cians. The remaining were other professional groups from the hospitals including pharmacists and ad-ministration.
In the study entitled “Hospital survey on patient safety culture in China” developed by Nie et al. (2013), was found that the positive response rate for 10 dimensions of patient safety culture ranged be-tween 45% and 88%. The lowest positive score was to the dimension Staffing and the highest score was to the dimension Organizational learning-Continuous improvement. The dimension Overall perception of patient safety scored 45% of positive response rate and Feedback and communication about error scored 50% of positive response rate. The internal consistency was measured by the Cronbach’s α and ranged between 0.40 and 0.75. The overall reliability was 0.84. The inter-item cor-relation was sufficient (χ2=2163.578 df=1159 p<0.01. The Kaiser-Meyer-Olkin (KMO) test showed a satisfactory sample adequacy with a value of 0.829. The KMO is a measurement on the varia-bles homogeneity, which compares simple correla-tions with partial correlacorrela-tions between variables. Partial correlations between two variables is the