FUNDAÇÃO GETULIO VARGAS
ESCOLA DE ADMINISTRAÇÃO DE EMPRESAS DE SÃO PAULO
IS FOREIGNNESS A SOURCE OF COMPETITIVE ADVANTAGE IN THE BRAZILIAN PHARMACEUTICAL INDUSTRY? AN EXPLORATORY STUDY
RICARDO ITAPEMA DE CASTRO MONTEIRO
SÃO PAULO 2018
RICARDO ITAPEMA DE CASTRO MONTEIRO
IS FOREIGNNESS A SOURCE OF COMPETITIVE ADVANTAGE IN THE BRAZILIAN PHARMACEUTICAL INDUSTRY? AN EXPLORATORY STUDY
Applied Thesis presented to Escola de Administração de São Paulo da Fundação Getulio Vargas, as requirement for the degree of Master of Competitive Management.
Field of Knowledge Finance and Control Counsellor: Prof. Dr. Hsia Hua Sheng
SÃO PAULO 2018
Monteiro, Ricardo Itapema de Castro.
Is foreignness a source of competitive advantage in the brazilian
pharmaceutical industry? : an exploratory study / Ricardo Itapema de Castro Monteiro. - 2018.
43 f.
Orientador: Hsia Hua Sheng
Dissertação (MPGC) - Escola de Administração de Empresas de São Paulo.
1. Empresas multinacionais. 2. Industria farmacêutica - Brasil. 3. Capital de giro. 4. Empresas multinacionais - Lucratividade. I. Sheng, Hsia Hua. II. Dissertação (MPGC) - Escola de Administração de Empresas de São Paulo. III. Título.
CDU 334.726(81)
Ficha catalográfica elaborada por: Isabele Oliveira dos Santos Garcia CRB SP-010191/O Biblioteca Karl A. Boedecker da Fundação Getulio Vargas - SP
RICARDO ITAPEMA DE CASTRO MONTEIRO
IS FOREIGNNESS A SOURCE OF COMPETITIVE ADVANTAGE IN THE BRAZILIAN PHARMACEUTICAL INDUSTRY? AN EXPLORATORY STUDY
Applied Thesis presented to Escola de Administração de São Paulo da Fundação Getulio Vargas, as requirement for the degree of Master of Competitive Management.
Field of Knowledge Finance and Control
Approval date:
20/08/2018
Examination Board:
_________________________________ Prof. Dr. Hsia Hua Sheng (Counsellor) FGV-EAESP
_________________________________ Profa. Dra Adriana Bruscato Bortoluzzo INSPER
_________________________________ Profa. Dr. Natalia Diniz Maganini
ACKNOWLEDGEMENTS
I dedicate this work to my eternal spouse, Fernanda Falsete, that feeds my life with love and joy. Thank you for all your help and patience.
To the Professors Doctors Hsia Hua Sheng and Mayra Ivanoff Lora for the support and guidance during the development of this work.
RESUMO
O crescimento acelerado do mercado farmacêutico brasileiro nos últimos dez anos atraiu e intensificou os investimentos de empresas farmacêuticas multinacionais. As empresas nacionais também investiram pesadamente. A indústria amadureceu e a concorrência se intensificou. No entanto, uma empresa que opera num ambiente estrangeiro, que é impulsionado por forças competitivas desconhecidas, geralmente se depara com custos adicionais para operar. Este fenômeno é chamado de "Liability of Foreigness" (LOF). Ainda assim, a filial estrangeira de uma empresa também pode ter vantagens exclusivas devido ao fato de serem estrangeiras, o chamado "Asset of Foreingnness" (AOF). Essas expectativas são evidentes na indústria farmacêutica brasileira? O presente trabalho emprega a metodologia de dados em painel com efeitos fixos em quatro modelos de regressão para uma amostra de 22 empresas (11 subsidiárias brasileiras de multinacionais e 11 empresas nacionais) desta indústria. Os modelos utilizados foram comprovados anteriormente por outros pesquisadores, em diferentes segmentos de mercado e países. As descobertas deste trabalho suportam parte das hipóteses formuladas por esses estudiosos e sugerem a existência do “Liability of Foreignnes”
Palavras Chaves: liability of foreignness, asset of foreignness, capital de giro,
ABSTRACT
The accelerated growth of pharmaceutical market in Brazil, in the past ten years, attracted and intensified investments from multinational pharmaceutical companies. National companies also invested heavily. The industry matured and competition intensified. However, a company that operates in a foreign, new environment, driven by unfamiliar competitive forces generally encounters additional costs to operate. This phenomenal is called ‘liability of foreignness’ (LOF). Still, the foreign branch of a company may also have unique advantages due to their being foreign, the so called ‘asset of foreignness’ (AOF). Do these theoretical expectations hold in the Brazilian pharmaceutical industry? The paper employs panel data methodology with fixed effects on four regression models for a sample of 22 companies (11 Brazilian subsidiaries of multinationals and 11 national companies) from this industry. Moreover, the models utilized were proved by other researchers, in different markets segments and countries. The findings support the hypothesis formulated by these scholars and suggest the existence of “Liability of Foreignness”.
Key words: liability of foreignness, asset of foreignness, working capital, profitability,
SUMMARY
1. INTRODUCTION ... 9
2. THEORETICAL FRAMEWORK ... 11
(2.1) Assets and Liability of Foreignness ... 11
(2.2) Working Capital and ROA ... 12
(2.3) Working capital and profitability in the Brazilian pharmaceutical industry ... 13
(2.4) Asset and Liability of Foreignness in working capital ... 16
3. METHODS & DATA ... 20
(3.1) Literature research ... 20 (3.2) Data selection ... 20 (3.3) Variables ... 22 4. RESULTS ... 27 (4.1) Descriptive Statistics ... 28 (4.2) Correlation matrix ... 30 (4.3) Regression Analysis ... 32 5. CONCLUSION ... 35
Appendix A - The Brazilian Pharmaceutical Industry Supply Chain ... 37
1.INTRODUCTION
The purpose of this article is to evaluate the existence of the ‘Asset and Liability of Foreignness’ in the Pharmaceutical industry in Brazil. Assets of Foreignness (AOF) are defined as the unique benefits that come as part of a multinational subsidiary (MNE) experience that are unavailable to host-country rival company (Mallon and Fainshmidt 2015). Liability of Foreignness (LOF) is commonly defined as the costs of doing business abroad that result in competitive disadvantage for a MNE subsidiary, that would not incur to a local firm (Zaheer, 1995).
In the past 10 years, the number of multinational corporations (MNEs) operating in the pharmaceutical market of Brazil quintupled (IQVIA, 2017) due to its relevant size and high growth rates. National companies (NACs) grew and quickly gained market leadership. In the global ranking of major markets per value (IQVIA, 2017), the Brazilian market went from 10th in 2011 to 8th in 2016, and it is expected to reach the 5th place in 2021. In this setting, it is natural that the market attracts newcomers.
Multinational corporations investing in new markets abroad must have specific assets with considerable advantages to confront the disadvantages that are present there (Caves 1971). When looking at the number of multinationals present in the Brazilian pharmaceutical market (25% of the total number of companies, IQVIA, 2017) and knowing their combined sales represent 49% of overall market sales (IQVIA, 2017) it is questionable whether they have significant advantages in this market.
In addition, changes in the competitive setting and regulatory scenario introduced strong pressure on price formation, challenges on the dynamics of portfolio replenishment and difficulties in negotiations with pharmacy chains/wholesalers resulted from market consolidation. Also, changes in the MNEs product global sourcing strategy brought challenges to its subsidiaries on obtaining products to its markets (Gomes et al, 2014). Under this new competitive and operational environment, companies were required to increase investments in trade credit and inventory to preserve competitiveness. Thus, working capital management became a strategic capability. According to Almeida et al (2014), “working capital management has become one of the most important subjects in the companies and many financial officers seek to identify in their specific niches, the main drivers and appropriate levels of working capital". Under this reformulated
perspective it is also questionable how did working capital affected the pharmaceutical industry performance.
Thus far, several systematic researches in Brazil have tested the existence of the AOF or LOF in local industries, however, so far, none have target the Brazilian pharmaceutical industry. This study contributes with the literature by specifically approaching this sector, evaluating the existence of Asset and or Liability of Foreignness among the studied companies.
Additionally, the paper contributes to the studies initially developed by Deloof (2003), Lazaridis et al (2006), Gill et al (2010), Enqvist et al (2014) and Bozzeda (2017) since it evaluates the relationship of working capital and profitability in a sample of 22 companies (11 Brazilian subsidiaries of MNEs and 11 national owned companies) from 2011 to 2016.
The study tests four hypothesis to assess whether the foreignness status of MNEs represent a competitive advantage or disadvantage (and therefore an AOF or LOF) in the working capital and its elements (accounts receivable, inventory, accounts payable). Evidences of Liability of Foreignness are identified on the relation between ROA and Inventory (DIO), proposing that MNE profitability is negatively impacted by its inventory levels (DIO). The study also concludes that the higher the financial debt ratio of MNEs the lower their profitability.
The article is organized into five (5) sections. Following this section, item 2 will provide a theoretical framework and an introduction on working capital and profitability in the pharmaceutical industry in Brazil. Item 3 will present the details of the selection criteria of the sample and a description of all variables utilized. Item 4 will discuss the results, descriptive statistics and regression. Finally, in item 5 the conclusions are stated, the limitations of the study and proposals for future lines of research.
2.THEORETICAL FRAMEWORK
(2.1) Assets and Liability of Foreignness
Assets of Foreignness (AOF) are those unique benefits that come as part of a multinational affiliate experience that are unavailable to host-country rival company (Mallon and Fainshmidt 2015). According to Sethi and Judge (2009), foreignness itself can sometimes be a source of advantage because it can require the ownership of unique resources, capabilities, and/or opportunities that are unavailable to host-country competitors. Goguen and Conolly (2012) identified that physicians (and patients), in emerging markets, usually choose drug products from multinational brands due to their higher perceived quality.
Examples of foreign competitive advantages were provided by different scholars. Dunning (1998) verified advantage motivated by technological intensity and specific types of organizational skills/assets. Delios et al (2001) concluded that intangible assets, such as patents and trademarks, increase MNEs competitiveness in a host country. Fagre et al (1982) identified that the magnitude of foreign direct investment to a certain country is a powerful bargaining lever in negotiations with the host country government.
Hymer (1960/1976) was the first author to establish a theoretical argument to explain the reason why foreign companies face competitive disadvantages in the host country market when compared with their local competitors. The author observed that, differently from local companies, foreign face additional costs associated to the unfamiliarity with the local market. In the same way, Hennart (1982) indicated that the operation of a business in a foreign country often faces higher costs and expenses when compared with the operation of a national company.
Zaheer and Mosakowski (1997) concluded that multinational subsidiaries (MNEs), frequently come across extra costs driven by the lack of knowledge of the economic environment and its political influences, the distinct treatment from local government in favor of national companies, the reluctance of nationalist buyers to purchase from foreign companies, as well as, restrictions imposed by the home government of a company. Mezias (2002) observed the existence of Liability of foreignness (LOF) at federal and state court levels in different regions of the United States. The scholar concluded that foreign subsidiaries operating in the country have a disadvantage in the settlement of labor
lawsuits. Likewise, Bhattacharya et al (2007) investigated all types of disputes (antitrust, agreement conflicts, labor disputes, patent violation and product liability) present at the federal courts of the US and concluded that American companies have more of an advantage at federal courts than foreign companies. Eden and Miller (2004) evaluated LOF under an institutional distance point of view (degree of separation or the extension in which the institutions differ between countries) and concluded that a substantial institutional difference create difficulties for MNEs trying to stablish legitimacy in a host country.
(2.2) Working Capital and ROA
Working capital (WC) is the flow of funds necessary for a company to operate activities. It includes funds invested in current assets, which, in the normal course of business can be turned into cash in a brief period without disrupting the organization. Current liabilities are those obligations intended to be paid in the ordinary course of business within short-term. Consequently, given its importance, the efficient working capital management is recognized as a vital aspect of the financial management practices in all forms of organization.
Almeida (2010), in a study performed in Brazil, with companies listed at BMF&BOVESPA, to identify the relation between investment in working capital and the company value, concluded that that an efficient management of the working capital is a critical part of the strategy of any company that intends to create value to shareholders. Another important objective of any company is to maximize profit (Raheman at al 2007). However, to preserve liquidity while maximizing profit can be a difficult challenge to be accomplished. If a company don´t prioritize profit, it won´t survive for a longer period, on the other hand if it doesn´t manage its working capital, it may face insolvency or bankruptcy. According to Almazari (2013), one objective should not be at the cost of the other because both have their importance and therefore the management of working capital can affect the profitability of the company.
Several scholars extensively studied the relation between working capital and profitability. Deloof (2003), in a study with 1009 listed Belgian companies found a significant and negative relationship between profitability and the companies working
capital. He also identified a similar result in the relationship between accounts payable and profitability.
Gill, Biger and Mathur (2010), analyzed a sample of 88 American companies listed on NYSE for a period of 3 years (2005 to 2007) and found statistically significant and negative relationship between profitability and DSO, They also identified a positive relationship between CCC and profitability and concluded that profitability dictates how managers act in terms of managing accounts receivables and therefore companies can create value for their shareholders by reducing the number of days for accounts receivables
Lazaridis and Tryfonidis (2007), in similar study performed with listed companies at Athens Stock Exchange observed a negative and significant correlation between CCC and probability. Their research indicated that, less profitable companies decrease the accounts receivable position (DSO) to minimize the cash gap in the CCC.
Enqvist et al. (2013) investigated the influence of working capital management (WCM) of Finnish listed companies over an 18-year period and found out a negative relationship between the cash WCM and profitability.
Lastly, Bozzeda (2017) performed a study covering 117 companies in Latin America, over an eleven-year period (2005-2015), from different industries, except the banking industry and concluded the existence of a significant negative relationship between the CCC and profitability (ROA).
(2.3) Working capital and profitability in the Brazilian pharmaceutical industry
During many years, from a competitive perspective, the pharmaceutical market was dominated by MNEs that commercialized innovative, highly technological, free priced, patent protected drugs, result from heavy investments in R&D and discover of new molecules. (Torres et al, 2011). NACs had a marginal participation in the market and had low ambition to innovate, given the excessive cost to develop innovative drugs and the high-risk financial return associated to this process (Gomes, 2017). MNEs enjoyed such competitive advantages that, from the financial management perspective, the companies had not to worry with working capital and profitability management.
In 1999, however, the creation of the Brazilian health regulatory agency (ANVISA), the institution of a “generic drugs” regulation and the establishment of Medication regulation
chamber (CMED) changed this scenario. The registration process of new drugs was revisited and the agency prioritized registering medicines that bring more impact to the health of the population, incentives the market competition and reduce prices (Anvisa, 2017). Consequently, the registration of innovative product became a lengthy process, impacting MNEs competitive advantage. Similarly, setting a new product pricing became a challenge since CMED stablished very strict regulations. Furthermore, the price chamber begun controlling prices of all drugs commercialized in the country, limiting the companies to increase profitability by increasing prices.
National companies begun investing heavily, with government support (The Brazilian Development Bank stablished a special program to fund Pharma industries at subsided rates for capital investments), focusing their business on the generic drugs or own branded copies of drugs that have gone off-patent.
In parallel to these changes in the Brazilian market, the multinational companies begun suffering the pressure to replace its aging portfolios given the expiration of patents. However due to the long time, to the substantial cost of launching a new molecule plus the uncertainty inherent in R&D investments, the companies promoted changes in its strategy. They reduced investments to minimize the R&D uncertainty and integrated production operations globally to exploit cost efficiencies via a global supply chain strategy (Sousa et al, 2010).
The impact was a wave of deactivation of “local” production sites of MNEs. According to Brazilian association of chemical companies (Abifina), more than one thousand manufacturing sites of fine chemistry products were deactivated during this period (Filho and Pan, 2003). MNEs begun to import from head offices. The trade balance of pharmaceutical products was affected, and Brazil achieved, in 2013, the 5th highest commercial deficit in world ranking of commercial balance of pharmaceutical products (Interfarma 2014).
Another significant move on the pharmaceutical industry commercial channel also took place during the last two decades. The biggest pharmacy chains begun a M&A move and market significantly concentrated with the top five companies dominating 47% of total pharmaceutical retail market in 2016 (Abrafarma, 2016). Similarly, the three biggest wholesalers achieved 34% of the total market revenues in 2017, according to the data from IQVIA. This movement rebalanced forces in the relationship supplier-customer. In this new scenario, an efficient management of the working capital is a critical factor for both MNEs and NACs. Market concentration in the commercial channels elevated the
importance trade credit and commercial discounts as a commercial lever, and consequently the accounts receivable and profitability management.
Additionally, the cash investment management became a critical determinant of liquidity because MNEs now must precisely allocate the correct quantity of funds to inventory of import products that guarantee its operations continuity. NACs, on the other hand, have the challenge to choose the correct allocation of funds in capital investments (production plants) and inventory (raw material and inventory).
Finally, the profit maximization became a constant challenge for the industry. Price controls imposed by CMED represented a strategic barrier to MNEs when selecting which products to launch in the local market. In the meantime, NACs face the challenge of commercializing low-priced products with no technological differentiation (by law the price of generic drugs must be 35% lower than the reference drug, but they are on average 40%, Viera et al, 2006).
The pharmaceutical industry in Brazil has approximately 550 companies, out of which 25% are MNEs and 75% NACs (IQVIA, 2017). From industry sales perspective MNEs hold 49% the total.
Multinational and national companies have distinct business models that directly impacts its WC and profitability. The MNEs businesses focus on the commercialization of innovative, patent protected drugs, with differentiated selling price and high margins. National companies rely on high scale production and aggressive commercialization of generic drugs/branded generics drugs.
Trade terms is a critical factor in the relationship pharma industry-customers particularly because the sales channel is highly concentrated: the eight major players (pharmacy chains and wholesalers) account for 80% of the private pharmaceutical market sales (excluding sales to government). Commercial discounts are critical factors utilized by NACs given the fact that generics/branded generic drugs have no technical differentiation and consequently require NACs to offer aggressive commercial discounts to motive its customers to commercialize its products (despite the negative impact in their profitability).
Both MNEs and NACs supply products to the Brazilian government. The Brazilian National Health System contains a type of pharmaceutical assistance whose purchases are segmented by cost and type of disease. The Ministry of Health oversees the centralized acquisition and the direct negotiation with companies provides an increased bargaining power, that influences both the price paid for each drug and the payment terms. Given
the frequent governmental budget restrictions, prices are normally negotiated down, affecting the industry profitability, and payments delayed according to budget availability.
Multinational companies, differently from NACs, import most of its products from headquarters located overseas, and as a response to the complex logistic and highly regulated process of importing medicines to Brazil, they generally operate with high levels of inventory. This is also a strategy utilized to guarantee product supply upon unforeseen expansion of demand and to protect from unpredictable disruptions from supply side.
Accounts payable also differ between MNEs and NACs. MNEs works mainly with a single supplier (headquarters) who also enforces payment policies that aim to minimize shareholders risks that arise from international operations (Wihlborg, 1980). MNEs normally have little room negotiating payment terms.
(2.4) Asset and Liability of Foreignness in working capital
Accounts Receivable
Account receivable are the funds the customers/clients own to the company. The receivable is a line of credit extended by the company to its customer due in a short period of time. A company’s commercial strategy, trade credit policy and collection efficiency are the main factors that determine its accounts receivable position.
Trade credit can be utilized as a sales lever, since in economic terms, increasing the trade credit period is equivalent to increasing the commercial discount practiced (Mian and Smith, 1992). Yet, the trade credit strategy really depends on its competitive position and bargaining power in commercial negotiations. The pharmaceutical sector commercial environment is highly concentrated (IQVIA, 2017) and sustaining a healthy commercial relationship may be costly to some companies.
The literature has emphasized that MNEs bringing capital and technology enjoy considerable advantage (assets of foreignness) over domestic entities (Sethi et al, 2009). MNEs in the Brazilian pharmaceutical industry commercialize innovative drugs, that are result from R&D investments and backed up by strong clinical research data. Physicians prescribe this type of drugs to its patients because of its higher proven clinical efficacy, technological benefits and because MNEs invest heavily in scientific promotion of their
portfolios among medical community. Also, physicians (and patients), in emerging markets, perceive higher quality on drugs from multinational (Goguen et al, 2012). Besides, these drugs have higher price per unit, that generates higher profit to retailers when compared to the commercialization of generic drugs (that lack differentiation and compete on price). Consequently, when negotiating with its customers, MNEs have an advantage over NACs, which is reflected the investment levels of trade credit and commercial discounts. This company specific advantage supports MNEs to overcome LOF.
Furthermore, once sales are performed, the faster it´s collected the better for a company. Research conducted by Lee (2016), in Brazil with MNEs from electronics sector concluded that MNEs are more predisposed to use factoring strategies to reduce accounts receivable position, maintain a higher level of cash and, consequently, operate with a higher financial flexibility for investments and potential uncertainties in a foreign market. In a research conducted by another scholar (Lazaridis et al, 2007), with listed companies at Athens Stock Exchange, identified that, companies with low DSO levels are generally less profitable and they use this strategy to reduce the cash gap that exist in their working capital.
Deloof (2003) and Gill (2010) in different studies (the earlier on large Belgian non-financial companies during the period from 2008 to 2012 and the later 88 companies listed on the New York Stock Exchange during the period from 2005 to 2007), identified a negative relationship between the number of days in account receivables (DSO) and profitability
Hence, the first hypothesis is formulated (H1). Since MNEs have a competitive advantage over NACs, and thus need lower investments of trade terms to sustain commercial competitiveness and commercialize high margin, innovative products, it is expected that MNEs have lower DSO and higher profitability than NACs. Therefore, MNEs should present a negative relationship between DSO and profitability.
Inventories
Traditionally inventory-holding decisions are based on the relation between inventory and sales. A high inventory means that there is weaker demand for the products offered by the company, significant level of competition or inefficient inventory management. A lower inventory level indicates that the company investment in inventory might be too low, high demand for the products of the company or efficient inventory management.
The strategic move of multinationals to integrated production operations globally negatively impacted its subsidiaries operations in Brazil. The importation of pharmaceutical products is a highly regulated, long and complex process. MNEs have to monitor trade policies and deliberations of multilateral economic agreement that directly affect the process, have to manage the inefficiency generated by the deteriorated infra structure from main air and sea ports, have to manage the external uncertainty from local authorities that frequently go on strikes and, finally, have to administrate the exchange rate volatility, via hedging strategies, require dedicated financial management to avoid cost increases that impact the profitability of the company.
Managing this complexity associated with transitions through a global supply chain represent additional costs for a MNEs that NACs don´t have, therefore it’s a form of LOF as described by Zaheer and Mosakowski (1997).
Lazaridis et al (2006) and Enqvist et al. (2013) found out that there exists a negative relationship between the inventory levels and profitability. The analyzed companies achieved higher levels of profitability by increasing efficiency of inventories and minimizing the inventory conversion cycle.
At this point, the second hypothesis is formulated (H2). Given its complex global supply chain and since inventories can be used as a form to prevent disruptions in the production process, loss of business due to shortage of products and offer better service levels for their customers MNEs operates with higher inventory levels to overcome the complexity and risks that exist along its supply chain network. However, holding high inventory level puts MNEs at risk of aged inventory that can only be sold if the company offers financial benefits to its customers. Normally commercial discounts are offered what affects profitability. Therefore, it is expected that MNEs have a negative relationship between inventory levels and profitability.
Accounts Payable
The accounts payable are all outstanding obligations a company has with its supplier. Higher values are desired by finance management of a company because this helps them to settle commitments with vendors for longer periods and the fund can be used in other alternative courses of business. The higher the value, the longer companies take to settle their debts with suppliers (Brealey et al, 2013),
One effect from the integration of production operations globally is the fact that MNEs parent company became the subsidiary primary supplier. This increased the MNE global
network interdependency and consequently reduced the subsidiary management independency because it must cope with payment policies established by HQ which have close relation with local regulations and laws of parent company home country. NACs, in contrast, have flexibility to manage the payment period, are restricted by local rules of host country and have the freedom to choose the usage of funds.
Moreover, the intercompany payment terms, in Brazil, are regulated by the government (Law 6.404, published in 1976) and determine that the payment terms to the parent company must be short to avoid the Brazilian Central Bank to interpret this operation as an inter-company loan, which would implicate in interests and taxes (PWC, 2016). The literature describes the cost of transacting with parent MNEs global networks as LOF given the disadvantage resulted from rules created by parent company local laws (Hymer, 1960) and the environmental cost in the host country (Zaheer et al, 2009).
Gill et al (2010) and Deloof (2003), identified a negative relationship between accounts payable and profitability. They also concluded that the later a company pays the bills, the higher is the profitability, hence the larger the number of days accounts payable are, the greater is the company performance.
Then, the third hypothesis is formulated (H3). Since MNEs have higher margin but limited flexibility over most of its payment terms, MNEs have a negative relationship between DPO and ROA.
Cash Conversion Cycle
The cash conversion cycle (CCC) has three components: accounts receivable translation period, inventory conversion period and accounts payable deferral period. To optimize it´s CCC, a company can improve each of the three components independently. For example, accounts payable to suppliers can be delayed serving as a financing vehicle, increasing the A/P cycle, which effectively reduces the CCC and makes working capital more efficient.
Working capital efficiency is thus based on the principle of accelerating cash collections and reducing cash disbursements. As a result, companies that operate with lean stocks, collect their receivables quickly and delays its payments to suppliers, have shorter CCCs and can be classified as more efficient. MNEs, in the contrary, to overcome the competitive disadvantage originated from importing products, operates with higher inventory levels than NACs. They also operate with lower accounts payable deferral period to comply with its global network interdependency and host country local laws.
Deloof (2003), Lazaridis et al. (2007), Enqvist et al. (2013) and Bozzeda (2017) observed a significant and negative relation between CCC and profitability.
Thus, the forth hypothesis is formulated (H4): since MNE have higher profitability but higher CCC (due to higher inventory and lower A/P) MNEs will have a positive relation between CCC and profitability.
3.METHODS & DATA
(3.1) Literature research
As previously mentioned, the primary objective of this article is to perform an exploratory research to verify the existence of the AOF and LOF phenomenon in the pharmaceutical industry in Brazil thought the analysis of working capital elements of national and multinational companies.
This process involves evaluating the existing studies on related topics, discussing the problem with experts and analyzing data from companies that operate in the sector. The bibliographic evaluation was conducted making use of the Science Direct, J Stor, Scielo, Wiley, FGV Digital Repository and Google Scholar using the keywords: (i) Liability of Foreignness, (ii) Asset of Foreignness, (iii) The Brazilian Pharmaceutical Industry, (iv) Working Capital Management, (vi) Working Capital Management in Pharma Industry and (vii) Supply Chain in Pharmaceutical Industry.
Next, a systematic review was used filtering the criteria: author, title, keywords, economy sector, results and conclusions. After methodically reviewing of their contents, forty-seven articles were deemed relevant for the current study.
(3.2) Data selection
To sample the companies for this study, it was utilized the Brazilian pharmaceutical companies ranking from October 2017 (IQVIA, 2017). The list contains 548 companies, out of which only Hypera is public traded. All others are privately held.
A few criteria were utilized to filter the sample. The first was the operations size, defined as the ones that own, individually or under common control total assets more than R$ 240
million or gross annual revenue exceeding R$ 300 million. The reason for selecting is the fact that the Law 11.638, published on December 28th, 2007, requires that all companies that meet these conditions must publish their financial statements in the Official Gazette of the State in which the company's head office is located or in another major circulation newspaper. Therefore, the financial data is available.
The second criteria utilized was filtering only companies whose ownership are exclusively national or international so that we could isolate the foreignness effect. Next a study was performed on State Official Gazettes and Valor Economic Newspaper, media vehicles that companies use to publish its financial results. The result of this research was identification of data from thirty-one companies, thirteen multinationals and sixteen national companies. Since the original expectation was to gather data from all companies, a qualitative research was performed with executives from five multinational companies to understand the probable reasons no more data was found. As result it was identified that companies utilize judicial means (legal injunctions) at supreme court to cancel the effects from Law 11.638 so that their financial data is kept private.
Consequently, a third criterion was applied to the selected samples that was to exclusively utilize data from companies that had six consecutive fiscal years (2011 to 2016) available. Consequently, one multination was excluded from the sample.
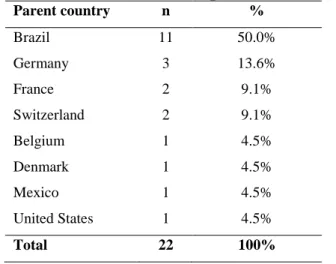
Finally, the three smallest national companies (utilizing the criteria revenue size) were excluded so that the sample contained a balanced number of representatives from MNEs and NACs. From a nationality perspective, the sample contains eleven companies from Brazil, three from Germany, two from France, two from Switzerland and one for Belgium, Denmark, Mexico and the United States. Table 1 summarizes the origin of the companies included in the samples while table 2 lists the companies’ names.
Table 1: Home base of Companies in the study Parent country n % Brazil 11 50.0% Germany 3 13.6% France 2 9.1% Switzerland 2 9.1% Belgium 1 4.5% Denmark 1 4.5% Mexico 1 4.5% United States 1 4.5% Total 22 100%
Source: Self prepared
Table 2: Companies in the study
# Company Home Base # Company Home Base
1 Ache Brazil 12 Sanofi France
2 NC Farma Brazil 13 Roche Swiss
3 Eurofarma Brazil 14 Novartis Swiss
4 Apsen Brazil 15 UCB Belgium
5 Blau Brazil 16 Servier France
6 Teuto Brazil 17 BMS US
7 União Quimica Brazil 18 Merk Germany
8 Zodiac Brazil 19 Novo Nordisk Denmark
9 Hypera Brazil 20 Frenesius Germany
10 FQM Brazil 21 Bayer Germany
11 Kley Hertz Brazil 22 Genomma Lab Mexico
Source: Self prepared
(3.3) Variables
The dependent variable utilized was return on assets (ROA), measured as the ratio of net income to total assets. ROA was chosen because this ratio concentrates on measuring the company’s overall profitability and, as pointed out by Barber and Lyon (1996), is not buried by special items or affected by the capital structure of the firm.
Furthermore, by choosing ROA, as dependent variable, the study remains in consistence with previous studies from Deloof (2003), Lazaridis et al (2006), Gill et al (2010), Enqvist
et al (2014) and Bozzeda (2017). Similarly, the utilized independent variables were DSO, DIO, DPO and CCC.
Days of sales outstanding (DSO) is a measure of the average number of days until the customer pays their bills. The higher the DSO the longer the cash cycle and therefore the higher working capital levels.
Days of Inventory Outstanding (DIO) is a ratio measuring the average number of days an item is held in the inventory. A high value in DIO means a potential weak demand for the products offered by the company or inefficient inventory management. On the other hand, a lower inventory holding period will indicate that the company investment in inventory might be too low, high demand for the products of the company or efficient inventory management.
Days of Payable Outstanding (DPO) is a company average period that measures how long it takes a company to meet its outstanding payments. The higher the value of days in DPO the better to help settling commitments with vendors for longer period so that funds can be used in other alternative courses of business. The higher the value, the longer companies take to settle their payment commitments to their suppliers.
The Cash Conversion Cycle is estimated considering these three variables jointly. The longer the CCC, the greater the net investment in current assets, and hence the greater the need for financing of current assets.
The calculation was based on methodology described by Shin and Sonen (1998): DSO = (Accounts Receivables/Sales) x 365
DIO = (Inventory/Sales) x 365
DPO= (Accounts Payables/Sales) x 365 CCC= (DSO+DIO) – DPO
The control variables utilized were Size, Leverage and Fixed Assets: SIZE = Net Sales
LEV = Financial Debt Ratio = (Short-Term Loans + Long-Term Loans)/Total Assets FA = Fixed Assets/Total assets
Size (SIZE) was chosen based on the studies from Enqvist et al (2014) and Bozzeda (2017) that use this variable as an inverse proxy of financial constraints following the notion that smaller companies face higher informational asymmetry and agency costs and, hence, will be more financially constrained. For this reason, the working capital levels of smaller companies tend to be lower than large companies.
Leverage (LEV) was selected based on the researches carried out by Gill et al (2010), Enqvist et al (2014) and Bozzeda (2017) in which the Financial Debt to Total Assets Ratio (leverage) were supposed to affect the relationship between profitability and working capital.
Fixed assets (FA) was selected because Deloof (2003) and Gill et al (2010) considered the ratio of fixed financial assets to total assets as a control variable. For some companies in his study such assets are a significant part of total assets.
Additionally, a lagged result variable, ROAt-1 was utilized based on the assumption that
companies have their results affected by previous performance, with their managers tending to sustain a minimally persistent trajectory that avoids abrupt changes that could negatively signal investors and shareholders (Lemmons et al, 2008).
To conclude, the dummy variable aims to capture the ownership origin of the company (MNEs or NACs) which may affect companies working capital and profitability, but they cannot control. This variable will also support the identification of AOF or LOF.
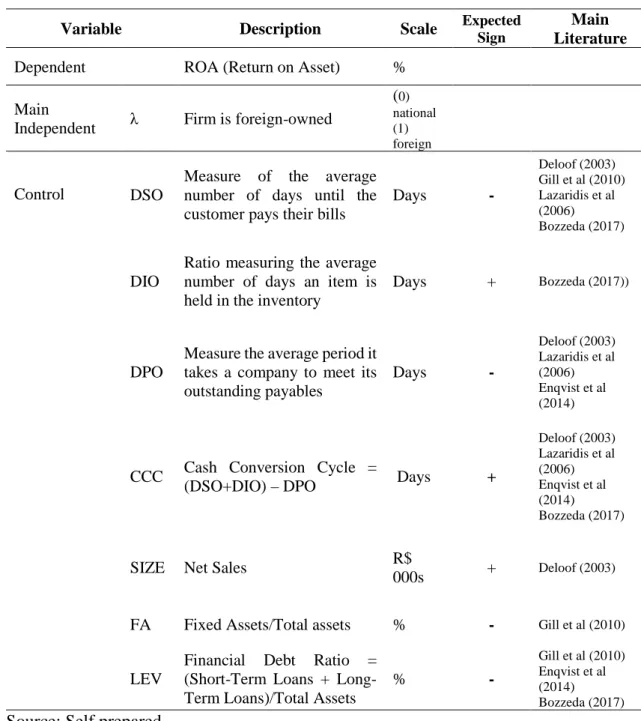
Table 3: Variables
Variable Description Scale Expected Sign Main Literature
Dependent ROA (Return on Asset) %
Main
Independent λ Firm is foreign-owned
(0) national (1) foreign Control DSO
Measure of the average number of days until the customer pays their bills
Days - Deloof (2003) Gill et al (2010) Lazaridis et al (2006) Bozzeda (2017) DIO
Ratio measuring the average number of days an item is held in the inventory
Days + Bozzeda (2017))
DPO
Measure the average period it takes a company to meet its outstanding payables Days - Deloof (2003) Lazaridis et al (2006) Enqvist et al (2014)
CCC Cash Conversion Cycle =
(DSO+DIO) – DPO Days +
Deloof (2003) Lazaridis et al (2006) Enqvist et al (2014) Bozzeda (2017)
SIZE Net Sales R$
000s + Deloof (2003) FA Fixed Assets/Total assets % - Gill et al (2010)
LEV
Financial Debt Ratio = (Short-Term Loans + Long-Term Loans)/Total Assets
% -
Gill et al (2010) Enqvist et al (2014) Bozzeda (2017)
Source: Self prepared
(3.4) Models
Following the models previously utilized by Deloof (2003), Lazaridis et al (2006), Gill et al (2010), Enqvist et al (2014) and Bozzeda (2017), to test the proposed hypothesis, an
interaction with a time-invariant variable (dummy λ) was included to observe its impact
(1) ROAi,t = β0 + β1DSOi,t + β2SIZEi,t + β3LEVi,t + β4FAi,t + β5λi,t + ROAi,t-1 +
β6DSO*λi,t+ β7SIZE*λi,t+ β8LEV*λi,t+ β9FA*λi,t+ β10λi,t+ ROA*λ i,t-1+ εi,t
(2) ROAi,t = β0 + β1DIOi,t + β2SIZEi,t + β3LEVi,t + β4FAi,t + β5λi,t + ROAi,t-1 +
β6DIO*λi,t+ β7SIZE*λi,t+ β8LEV*λi,t+ β9FA*λi,t+ β10λi,t+ ROA*λ i,t-1+ εi,t
(3) ROAi,t = β0i,t + β1DPOi,t + β2SIZEi,t + β3LEVi,t + β4FAi,t + β5λi,t + ROAi,t-1 +
β6DPO*λi,t+ β7SIZE*λi,t+ β8LEV*λi,t+ β9FA*λi,t+ β10λi,t+ ROA*λ i,t-1 + εi,t
(4) ROAi,t = β0 + β1CCCi,t + β2SIZEi,t + β3LEVi,t + β4FAi,t + β5λi,t + ROAi,t-1 +
β6CCC*λi,t + β7SIZE*λi,t + β8LEV*λi,t + β9FA*λ i,t + β10λi,t+ ROA*λ i,t-1 + εi,t
Where:
β0: Intercept of the equation
β1, β2, β3, β4, β5: Coefficients of variables
ROA: Return on Assets
DSO: Days of sales outstanding DIO: Days of inventory outstanding DPO: Days of payment outstanding CCC: Cash conversion cycle SIZE Net Sales
LEV: Financial Debt Ratio FA: Fixed Assets to Total assets
ROAt-1: Return on assets lagged result variable
λ: Multinational dummy i: Individual company’s t: Time in years
4.RESULTS
Once data was collected, an analysis of descriptive statistics was performed with the objective to describe the major features of the collected data, such as the mean, median, standard deviation, the minimum and the maximum of the sample and variables.
The following analysis was the correlation analysis to describe the relationship between variables. In this study, the focus was to evaluate the relationship between working capital management and the company’s profitability. The software utilized was STATA version 15.1.
The data utilized in the study were classified as panel data given its characteristics: Panel data are data where multiple cases (i.e. companies) are observed at different periods of time. In this study 22 different companies were observed across 6 years.
Next, VIF (variance inflation factors) were evaluated to detect multicollinearity. These factors demonstrate how much of the variance of an estimator is disturbed by the presence of collinearity with the other regressors contained in the model. As per Gujarati (2003) VIF values higher than 5 indicates a multicollinearity problem but the analysis indicated that this problem is not present in the regression equations since all the VIF were lower than 1.6. The following step was to identify which technique to analyze panel data: Fixed Effects Model (FEM) or Random Effects Modem (REM).
To determine the best model, the Hausman test was applied (Gujarati, 2003). According to this test, under the null hypothesis, estimators of the model with random effects are consistent and efficient; under the alternative hypothesis, estimators with random effects are not consistent, but the estimators with fixed effects are consistent. The test was conducted for all models proposed and the result, for all models, was found to be a p-value lower than 0.01, which rejects the null hypothesis, that is, the most appropriate model would be the FEM. Moreover, FEM should be an appropriate specification for this study because it focus on a specific set of 11 companies and the proposed inference is restricted to the behavior of these sets of firms during a certain period of time (2011 to 2016).
Still, the regression models have a time-invariant variable (dummy λ) that must be tested, to that end, to do so, an interaction was used to show how the effect of a prediction variable (dummy λ) on the outcome may vary.
Next test performed was to verify the occurrence of heteroskedasticity. This is a concern in the regression analysis as it can invalidate statistical tests of significance because the
standard errors of these estimates will be biased leading to a bias in test statistics and confidence intervals. Consequently, a modified Wald test was applied to all the four models and the null was rejected thus confirming that there is a heteroscedasticity problem. To correct this, as indicated by Baltagi (2005), the regression was calculated utilizing robust standard errors.
(4.1) Descriptive Statistics
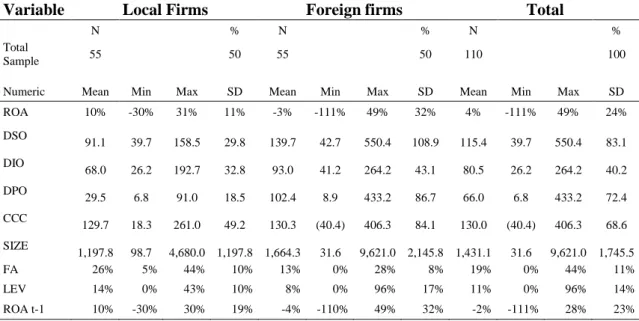
Descriptive statistics are used to describe and discuss characteristics of a data set more generally and orderly than using raw data alone. Table 4 provides descriptive statistics about all variables captured from 22 companies from the year of 2011 to 2016. Total observations come to 110 observations (22 companies x 6 years).
There are differences between the minimum and maximum values in all variables among studied companies. On DSO, 39.7 days is the minimum observed and 550.4 is the maximum for companies to collect trade debts from customers. The lowest value (39.7) belongs to a NAC while the highest to a MNEs. The low value from a NAC could be explained by the fact that NACs prefer offering commercial discounts instead of trade terms when negotiating product sales with its customers. The high value from a MNE means the company performs sales to government that may be delaying its payments due to governmental budgetary restrictions. On average, the statistics indicate it takes 115.4 days on average for companies in pharma sector to collect their cash, with a standard deviation is 83.1 days.
Table 4: Descriptive statistics for the variables
Variable Local Firms Foreign firms Total
N % N % N %
Total
Sample 55 50 55 50 110 100
Numeric Mean Min Max SD Mean Min Max SD Mean Min Max SD
ROA 10% -30% 31% 11% -3% -111% 49% 32% 4% -111% 49% 24% DSO 91.1 39.7 158.5 29.8 139.7 42.7 550.4 108.9 115.4 39.7 550.4 83.1 DIO 68.0 26.2 192.7 32.8 93.0 41.2 264.2 43.1 80.5 26.2 264.2 40.2 DPO 29.5 6.8 91.0 18.5 102.4 8.9 433.2 86.7 66.0 6.8 433.2 72.4 CCC 129.7 18.3 261.0 49.2 130.3 (40.4) 406.3 84.1 130.0 (40.4) 406.3 68.6 SIZE 1,197.8 98.7 4,680.0 1,197.8 1,664.3 31.6 9,621.0 2,145.8 1,431.1 31.6 9,621.0 1,745.5 FA 26% 5% 44% 10% 13% 0% 28% 8% 19% 0% 44% 11% LEV 14% 0% 43% 10% 8% 0% 96% 17% 11% 0% 96% 14% ROA t-1 10% -30% 30% 19% -4% -110% 49% 32% -2% -111% 28% 23%
Source: Self prepared
On DIO, the lowest value is 26.2 days for a NAC company while the highest is 264.2 days for a MNEs (the sample average is 80.5 days and standard deviation 40.2 days). The justification must be related to the strategy adopted by MNEs to operate with higher product stock levels to avoid any product supply rupture to customers. Technology used in the manufacturing, automation level of supply chain, and the production capacity could also explain the NAC results.
For DPO, the minimum and maximum are 6.8 and 433.2 days respectively. The sampled companies take on average 66.0 days to pay its suppliers. A representative from NAC companies has the lowest value while a MNEs the highest. The standard deviation is 72.4 days. The low value from NAC may be consequence of low bargaining power with its suppliers or they may be discounting for early payments to reduces its supplier financing. The 433.2 days from MNEs may be explained by the usage of intercompany purchasing as a financing strategy. The MNE delay its payment outstanding to HQ and allocate the funds to other obligations. However, from the head office perspective, this brings a major concern to financial managers about the risk these international transactions represent. On the Cash Conversion Cycle some companies have -40.4 whereas others 406.3 days, being MNEs both the companies that presented these results. On average, companies take 130 days to complete one full cash conversion cycle with a standard deviation of 68.6 days. Representatives from MNEs have both the most and least efficient working capital
efficiency. Additional qualitative information would be useful to understand the drivers for such variability, such as internal management policies, years of experience operating in the alien country, degree of familiarity with local market, etc.
Regarding the value of return on assets (ROA), the companies within the study have a 4% return on asset with a standard deviation of 24%. MNEs presented maximum values (49.3%) while NACs, the minimum (-30%).
The leverage, measures the degree of financing, with the higher ratio belonging to companies with aggressive financing policies. This ratio ranges from 0% to 96% and counts 11% on average. The standard deviation for this measure is not high, probably because the evaluated companies have an equivalent level of financing policy.
Sales, which is used to measure the company size is found significantly different, ranging from a NAC with 98.7 Million Brazilian Reais to a MNEs with 9.6 Billion Brazilian Reais. Fixed assets presented a minimum of 0% and maximum of 44% both data from NACs. Among MNEs the average FA was 13% while among NACs was 26%. The difference suggests that NACs have higher investment in fixed assets, what can be explained by the fact that they product locally most of its products, what require investments in machinery that are part of production sites.
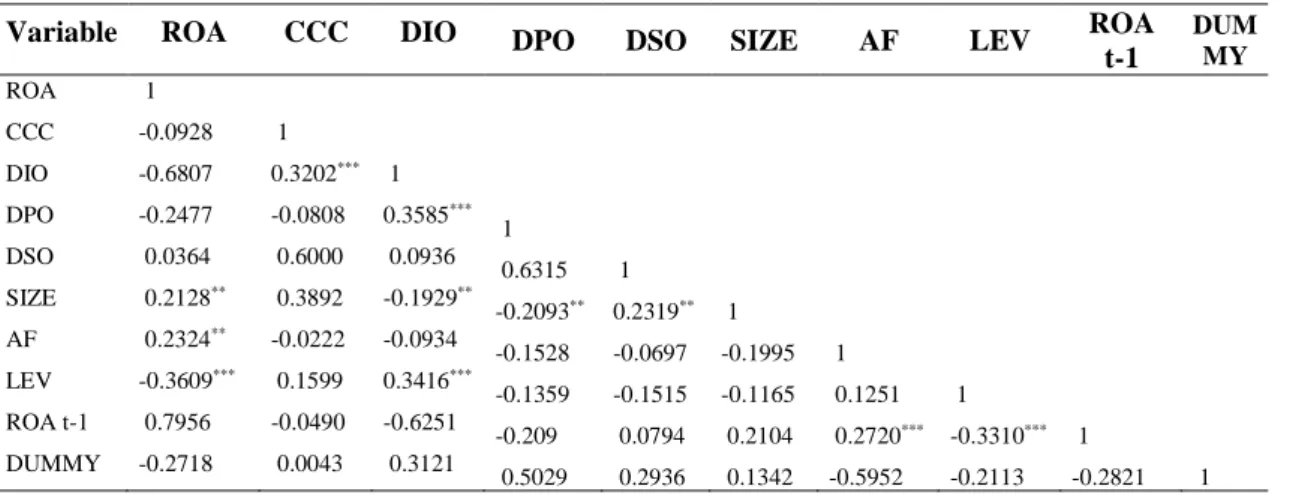
(4.2) Correlation matrix
Table 5 presents the Pearson correlation coefficients for all the variables mentioned. There is a negative relation between the Return on Assets (ROA) and the working capital components (inventories, accounts payables and cash conversion cycle). This finding is consistent with the research of Deloof (2003) and Lazaridis et al (2006) The correlation results indicate a negative coefficient between inventories and ROA (-0.6807). This suggests that if a company take an extended period to sell its inventories, the profitability will consequently decrease.
Table 5: Correlation matrix of numerical variables
Variable ROA CCC DIO DPO DSO SIZE AF LEV ROA
t-1 DUM MY ROA 1 CCC -0.0928 1 DIO -0.6807 0.3202*** 1 DPO -0.2477 -0.0808 0.3585*** 1 DSO 0.0364 0.6000 0.0936 0.6315 1 SIZE 0.2128** 0.3892 -0.1929** -0.2093** 0.2319** 1 AF 0.2324** -0.0222 -0.0934 -0.1528 -0.0697 -0.1995 1 LEV -0.3609*** 0.1599 0.3416*** -0.1359 -0.1515 -0.1165 0.1251 1 ROA t-1 0.7956 -0.0490 -0.6251 -0.209 0.0794 0.2104 0.2720*** -0.3310*** 1 DUMMY -0.2718 0.0043 0.3121 0.5029 0.2936 0.1342 -0.5952 -0.2113 -0.2821 1
Source: Self prepared
Note: *** p< 0.01, ** p<0.05 and * p<0.1
On accounts payable, there is a negative coefficient (-0.0364) between DPO and ROA. A reasonable explanation according to Deloof (2003) is that companies wait too long to pay their suppliers. Early payment to suppliers might increase the profitability of the company due to large discounts for punctual payments.
The result of the correlation analysis shows a positive relation (0.0364) between Accounts Receivables (DSO) and ROA. This means that if the number of days of AR increases, the profitability also increases. An explanation to this result may be the fact that customers delay paying their obligations but include payment of penalties and interest when settling the payments. Also, companies may offer trade terms instead of discounts on product prices.
The cash conversion cycle and ROA have a negative coefficient. This is consistent with the theory that the interval of time between the expenditure for the purchases of materials and the collection of sales of finished goods can be too long, and that decreasing this time increases profitability (Deloof, 2003).
The analysis also shows a significant positive correlation between sales which is used to measure the size of the firm and the profitability (ROA). This outcome is like the ones from Deloof (2003), Lazaridis et al (2006) and Gill et al (2010) This shows that as the size of the company increases, it will increase its profitability and vice versa.
The results show that the financial debt ratio has a negative correlation (-0.3609) with the profitability, indicating that an increase in debt is associated with a decrease in the profitability. Finally, the fixed assets ratio (FA) and the profitability have a positive
coefficient (0.2324) which demonstrates that an increase in fixed assets is associated with an increase in profitability and vice versa. This result is similar to the one from Deloof (2003) and Lazaridis et al (2006).
As stated earlier, the Pearson correlation analysis shows the relationship between the variables, it does not identify the causes from consequences, for example, it is hard to determine whether lower DSO leads to higher ROA and vice versa. Moreover, the correlation analysis can´t evaluate the existence of AOF/LOF phenomenon, which is a main objective of this study. For this reason, the regression analysis is explained in the next section to determine the impact of working capital management on corporate profitability and the existence of asset or liability of foreignness.
(4.3) Regression Analysis
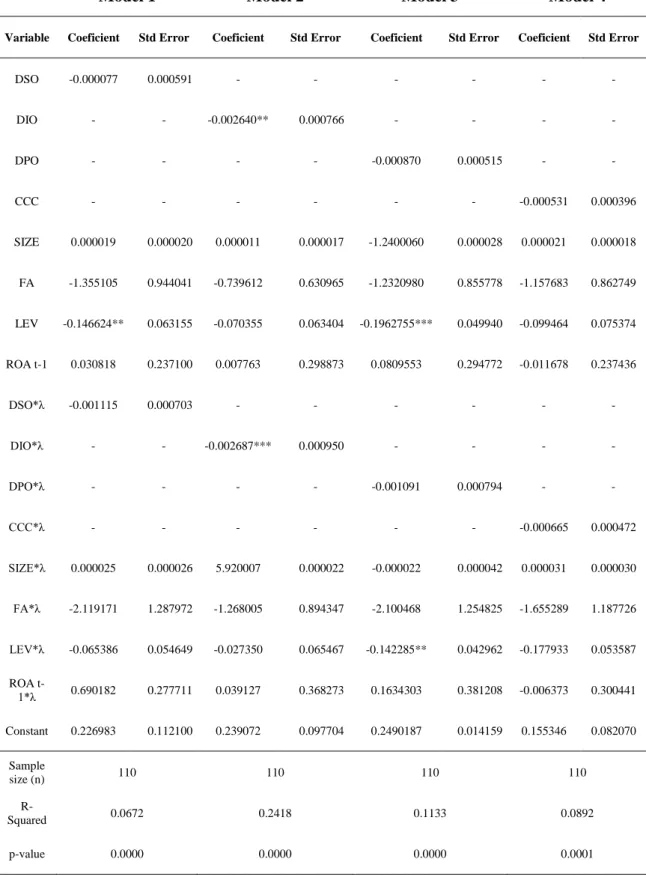
Tables 6 and 7 summaries the regression results. The first regression model indicates that ROA and DSO are statistically insignificant suggesting that these variables cannot explain the impact of DSO on pharmaceutical companies’ profitability (ROA). This finding is contrary to the one from Deloof (2003), Gill et al (2010), Lazaridis (2006) and Bozzeda (2017). Similar result is verified when analyzing the coefficients of these variables when interacted with the MNE dummy. Therefore, there is no support to prove Hypothesis 1 (H1).
The results from the regression model 2 indicates a negative relationship between ROA and DIO statistically significant at 5% level. The result indicates that by maintaining a high inventory the profitability will be negatively affected. Bozzeda (2017) presented opposite results. When analyzing the coefficients of these variables with the interaction of the MNE dummy, the model is statistically significant at 1% level (negative relation). This result supports Hypothesis 2 (H2) and follows the ones from Deloof (2003) and Enqvist et al (2014).
Table 6: Regression Results
Source: Self prepared
Note: *** p< 0.01, ** p<0.05 and * p<0.1
Model 1 Model 2 Model 3 Model 4
Variable Coeficient Std Error Coeficient Std Error Coeficient Std Error Coeficient Std Error
DSO -0.000077 0.000591 - - - - DIO - - -0.002640** 0.000766 - - - - DPO - - - - -0.000870 0.000515 - - CCC - - - -0.000531 0.000396 SIZE 0.000019 0.000020 0.000011 0.000017 -1.2400060 0.000028 0.000021 0.000018 FA -1.355105 0.944041 -0.739612 0.630965 -1.2320980 0.855778 -1.157683 0.862749 LEV -0.146624** 0.063155 -0.070355 0.063404 -0.1962755*** 0.049940 -0.099464 0.075374 ROA t-1 0.030818 0.237100 0.007763 0.298873 0.0809553 0.294772 -0.011678 0.237436 DSO*λ -0.001115 0.000703 - - - - DIO*λ - - -0.002687*** 0.000950 - - - - DPO*λ - - - - -0.001091 0.000794 - - CCC*λ - - - -0.000665 0.000472 SIZE*λ 0.000025 0.000026 5.920007 0.000022 -0.000022 0.000042 0.000031 0.000030 FA*λ -2.119171 1.287972 -1.268005 0.894347 -2.100468 1.254825 -1.655289 1.187726 LEV*λ -0.065386 0.054649 -0.027350 0.065467 -0.142285** 0.042962 -0.177933 0.053587 ROA t-1*λ 0.690182 0.277711 0.039127 0.368273 0.1634303 0.381208 -0.006373 0.300441 Constant 0.226983 0.112100 0.239072 0.097704 0.2490187 0.014159 0.155346 0.082070 Sample size (n) 110 110 110 110 R-Squared 0.0672 0.2418 0.1133 0.0892 p-value 0.0000 0.0000 0.0000 0.0001
The model 3 regression indicates that the relation between ROA and DPO is not statistically significant, diverging from the results from Deloof (2003), Lazaridis et al (2006) and Enqvist et al (2014). Same result was identified when applying interaction of the MNE dummy. This suggests that foreignness does not affect the relation of AP and profitability and therefore Hypothesis 3 (H3) have no support.
The regression from model 4 indicates a statistically insignificant (p=0.195) relationship between CCC and ROA. The model also pointed out that for MNEs (interaction of MNE dummy), the relationship is statistically insignificant. This is contrary to expected results, and therefore Hypothesis 4 (H4) have no support.
The control variable company size (SIZE) are also statistically insignificant in the 4 models, suggesting that SIZE does not affect the profitability of companies in the Brazilian pharmaceutical industry.
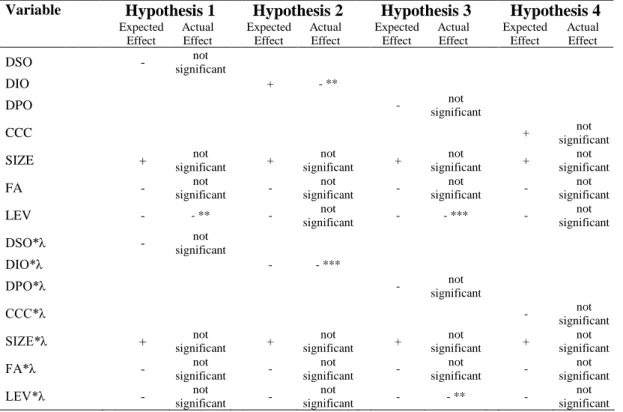
Table 7: Regression Analysis
Variable Hypothesis 1 Hypothesis 2 Hypothesis 3 Hypothesis 4 Expected Effect Actual Effect Expected Effect Actual Effect Expected Effect Actual Effect Expected Effect Actual Effect
DSO - significant not
DIO + - **
DPO - not
significant
CCC + not
significant
SIZE + significant not + significant not + significant not + significant not
FA - significant not - not
significant - not significant - not significant LEV - - ** - not significant - - *** - not significant
DSO*λ - significant not
DIO*λ - - *** DPO*λ - not significant CCC*λ - not significant SIZE*λ + not significant + not significant + not significant + not significant
FA*λ - significant not - not
significant - not significant - not significant LEV*λ - not significant - not significant - - ** - not significant
Source: Self prepared
The Financial Debt Ratio (LEV) is negative and statistically significant at 1% level and affects profitability. For MNEs interaction, it is also negative and significant at 5% level which is validates the results from Deloof (2003), Gill et al (2010), Enqvist (2013) and Bozzeda (2017).
The relationship between fixed assets ratio (FA) and ROA is not statistically significant, differently from Deloof (2003). For MNEs (when interacting with the MNE dummy), the results are similar.
5.CONCLUSION
The purpose of this paper was to explore the existence of Asset or Liability of foreignness phenomena in the pharmaceutical industry in Brazil. To accomplish this, a sample of 22 companies, during the period from 2011 to 2016 was used, with the data grouped on a yearly basis following the panel data methodology.
The main hypothesis investigated the relation between the working capital, measured by the cash conversion cycle and its components, and the company's profitability (ROA). They were tested by statistical models that have been proven by several scholars in different markets and countries. The models were enhanced by incorporating a MNE dummy that interacted with other variables to support the proposed hypothesis.
The results found in model 3, testing the relation of ROA and DIO, indicates a negative and statistically significant relation between DIO and the company profitability, implying that by increasing the efficiency of inventories and minimizing inventory conversion periods, companies in the pharma industry in Brazil can achieve higher profitability levels. This contributes to the published researches from Deloof (2003), Lazaridis et al (2006) and Enqvist (2013). When interacting with MNE dummy, the results are also statistically significant, at 1% level, supporting hypothesis 3.
Since, MNEs operate with higher inventory than NACs (MNEs have on average 93 days of inventory while NACs have 68 days) as result of strategic decisions made by its headquarters, that established global supply of products instead of holding local duction, MNEs have a competitive disadvantage, that is unique to them (MNE affiliate), that a local company do not incur (Zaheer, 1995) and therefore this is an evidence of LOF. The regression models 1, 2 and 4 results are statistically insignificant and therefore don’t provide support to prove hypothesis 1, 2 and 4 and cannot demonstrate the Asset or Liability of Foreignness phenomena in DSO, DPO and CCC. The models also indicated statistical insignificance between ROA and the control variable Size.
The control variable financial debt ratio was found to be negatively and statistically significant implying that less profitable companies rely on borrowed funds to finance
operations. In fact, debt financing affects the financial cost which will lead to decreasing profitability.
The results of this study should be interpreted with care because of limitations of the research on the limited sample size and limited time horizon of data utilized. For future studies, researchers should consider utilizing alternative proxies to measure the existence of AOF/LOF such as ROE, Gross Profit, EBITDA, the psychic distance, the effect of government subsidies on NACs/MNEs performance, the effect on sales growth rates from the amount of time a new product is approved by ANVISA. Also, the geographical expansion of the study, incorporating the pharmaceutical industry of other countries in Latin America could substantiate the results from this analysis. Finally, additional factors could be evaluated to understand their influence in the company profitability such as economic activity, exchange rates, credit volume, etc.
APPENDIX
Appendix A - The Brazilian Pharmaceutical Industry Supply Chain
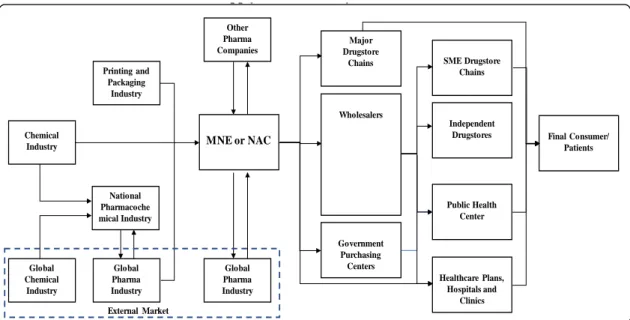
A supply chain is an integrated process where several business entities work together to produce and exchange goods and services (Susarla, 2012). Typically, in manufacturing industries the stages are: raw materials acquisition, primary (and secondary) manufacture (including packaging) and distribution to customers. Each one may comprise one or more sub-stages and products may be kept in storage units (e.g. warehouses) between stages (Miguel et al 2014). The figure 1 below provides an illustration of the pharmaceutical industry chain:
Figure 1 – The Pharmaceutical industry supply chain
Source: Adapted from “Reverse Logistics from Pharma Sector” – Brazilian Agency of Industrial Development
The pharmaceutical industry reaches its final consumer (patients) through retailers, wholesalers and government purchasing centers. In the private channel (retailers/distributors), the products are directly delivered to the customer’s distribution sites located at strategic areas, next to big customer markets or at States offering fiscal benefits (decreased tax burden or presumed payment). The commercial negotiation is
Printing and Packaging Industry National Pharmacoche mical Industry Global Pharma Industry Global Pharma Industry Other Pharma Companies Global Chemical Industry Chemical Industry External Market Wholesalers Major Drugstore Chains Government Purchasing Centers SME Drugstore Chains Independent Drugstores Healthcare Plans, Hospitals and Clinics Final Consumer/ Patients Public Health Center pp y y MNE or NAC
based on the discount and trade credit granting to encourage the purchase of higher volumes and as a management strategy for the customer/supplier relationship (Meltzer 1960). In economic terms, increasing the trade credit period is equivalent to increasing the commercial discount practiced (Mian and Smith 1992); so, the credit granting policy can be also observed as a company pricing policy.
The service rendered to the public channel is dispersed because the products are directly delivered to the dispensation sites (hospital, health sites, government clinics, etc.) and it is also characterized by a low commercial negotiation flexibility, since the purchases made by these entities are regulated by laws that determine the use of the lowest practiced price model (auction) or the direct purchase model that applies mandatory commercial discounts and their standard payment terms. The figure 2 below provides a simple illustration of the drug distribution chain:
Figure 2: The Pharmaceutcial industry sales distribution chain Source: Self Prepared
Distributors Healthcare Plans, Hospitals and Clinics Government Purchasing Centers Retail/ Drugstores Pharmaceutcial Industry Patients
BIBLIOGRAPHY
Abrafarma (2016) Retrieved from https://www.abrafarma.com.br/informações
Almazari, A. A. (2013). The relationship between working capital management and profitability: Evidence from Saudi cement companies. British Journal of Economics,
Management & Trade, 4(1), 146-157.
Almeida, J. R. D. (2010). Gestão do capital de giro, acesso a financiamentos e valor da
empresa (Master dissertation, Escola de Administração de Empresas de São Paulo da
Fundação Getulio Vargas).
Almeida, J. R. D., & Eid Jr, W. (2014). Access to finance, working capital management and company value: Evidences from Brazilian companies listed on BM&FBOVESPA.
Journal of Business Research, 67(5), 924-934.
Anvisa (2017) Retrived from
http://portal.anvisa.gov.br/rss/asset_publisher/Zk4q6UQCj9Pn/content/medicamentos-prioridade-para-registro/219201?inheritRedirect=false
Avila, J. D. P. C. (2004). O desenvolvimento do setor farmacêutico: a caminho de uma estratégia centrada na inovação. Revista Brasileira de Inovação, 3(2), 283-307.
Baltagi, B. (2008). Econometric analysis of panel data. John Wiley & Sons. 3rd.
Barber, B. M., & Lyon, J. D. (1996). Detecting abnormal operating performance: The empirical power and specification of test statistics. Journal of financial Economics, 41(3), 359-399.
Bhattacharya, U., Galpin, N., & Haslem, B. (2007). The home court advantage in international corporate litigation. The Journal of Law and Economics, 50(4), 625-660.
Blinder, A. S., & Maccini, L. J. (1991). Taking stock: a critical assessment of recent research on inventories. Journal of Economic perspectives, 5(1), 73-96.
Bozzeda, R. (2017). The influence of working capital on corporate performance (Master dissertation, Escola de Economia de São Paulo da Fundação Getulio Vargas).