Evaluation of comprehensive care for
older adults in primary care services
Nádia PlacideliI,II , Elen Rose Lodeiro CastanheiraII , Adriano DiasII , Pedro Alcântara da
SilvaIII , Josiane Lozigia Fernandes CarrapatoIV,II , Patricia Rodrigues SanineII , Dinair
Ferreira MachadoII , Carolina Siqueira MendonçaII , Thais Fernanda Tortorelli ZariliII ,
Luceime Olivia NunesII , José Fernando Casquel MontiV,II , Zulmira Maria de Araújo
HartzVI , Maria Ines Battistella NemesVII
I Universidade Estadual Paulista. Faculdade de Medicina de Botucatu. Departamento de Enfermagem. Botucatu, SP, Brasil
II Universidade Estadual Paulista. Faculdade de Medicina de Botucatu. Programa de Pós-Graduação em Saúde Coletiva. Departamento de Saúde Pública. Botucatu, SP, Brasil
III Universidade de Lisboa. Instituto de Ciências Sociais. Lisboa. Portugal IV Instituto Toledo de Ensino. Bauru, SP, Brasil
V Universidade Federal de São Carlos. Faculdade de Medicina. São Carlos, SP, Brasil VI Universidade Nova de Lisboa. Instituto de Higiene e Medicina Tropical. Lisboa. Portugal
VII Universidade de São Paulo. Faculdade de Medicina. Departamento de Medicina Preventiva. São Paulo, SP, Brasil
ABSTRACT
OBJECTIVE: To evaluate the performance of comprehensive care for older adults in primary care services in the Brazilian Unified Health System in the state of São Paulo, Brazil.
METHODS: A total of 157 primary care services from five health regions in midwestern São Paulo responded, from October to December 2014, the pre-validated 2014 questionnaire for primary care services assessment and monitoring. We selected 155 questions, based on national policies and guidelines on this theme. The responses indicate the service performance in older adults’ care, clustered into three areas of analysis: health care for active and healthy aging (45 indicators, d1), chronic noncommunicable diseases care (89 indicators, d2), and support network in aging care (21 indicators, d3). Performance was measured by the sum of positive (value 1) or negative (value 0) responses for each indicator. Services were clustered according to k-means of the performance scores of each domain. After weighting the domains (Z tests), we estimated the associations between the scores of each domain and independent management variables (typology, planning and evaluation of services), with simple and multiple linear regression.
RESULTS: Chronic noncommunicable diseases care (d2) showed, for all clusters, better average performance (55.7) than domains d1 (35.4) and d3 (39.2). Service performance in the general area of planning and evaluation associates with the performance of older adults’ care.
CONCLUSIONS: The evaluated services had incipient implementation of comprehensive care for older adults. The evaluation framework can contribute to processes to improve the quality of primary health care.
KEYWORDS: Health Services for Older Adults. Comprehensive Health Care. Primary Health Care. Health Services Research. Brazilian Unified Health System.
Correspondence: Nádia Placideli
Universidade Estadual Paulista. Faculdade de Medicina - Campus de Botucatu. Departamento de Enfermagem Av. Prof. Mário Rubens Guimarães Montenegro, s/n - UNESP - Anexo Vermelho. Campus de Botucatu - Botucatu/SP - CEP 18618687
Email: [email protected] Received: Jan 01, 2018 Approved: May 31, 2019 How to cite: Placideli N, Castanheira ERL, Dias A, Silva PA, Carrapato JLF, Sanine PR, Machado DF, Mendonça CS, Zarili TFT, Nunes LO, Monti JFC, Hartz ZMA, Nemes MIB. Evaluation of comprehensive care for older adults in primary care services. Rev Saude Publica. 2020;54:6. Copyright: This is an open-access article distributed under the terms of the Creative Commons Attribution License, which permits unrestricted use, distribution, and reproduction in any medium, provided that the original author and source are credited.
INTRODUCTION
Primary health care (PHC) is pointed out as a priority to assist and monitor older adults’ health status, besides acting in the prevention of health problems and in the health promotion to a healthy aging. Accordingly, the World Health Organization (WHO) proposed in 2004 that primary care services should adapt to serve older adults properly1. In Brazil, in view of the population aging, the Ministry of Health published in 2007 the Caderno de Atenção
Básica (Primary Care Guide) no. 19, guiding primary care teams for a greater resolution of
the older adults’ demands2.
The expansion of the PHC public network and the need to strengthen management structures and to redefine roles in the three spheres of government have driven the institutionalization of agreement and evaluation mechanisms to assist the decision–making process and to improve the public health system3,4. Especially since the last decade, evaluation and monitoring strategies are essential tools to measure the effectiveness of health systems at all levels of care4.
In this context, evaluating services for the older adults’ health care, especially in PHC, is increasingly important to know the advances in implementing the recommendations of the Primary Care Guide no. 192. They cover promotion and prevention actions to achieve active and healthy aging, management of chronic noncommunicable diseases (CNCD) and networking. National and international studies conducted to evaluate the older adults’ care in PHC indicate the need to expand preventive practices and health promotion, infrequent and low diverse in actions, in addition to the importance to build networks of comprehensive care to older adults’ health, ordained by PHC services5–10. The QualiAB 2014 instrument (Questionnaire for Primary Care Services Assessment and Monitoring) proposes, among its indicators for the comprehensive evaluation of primary care services, those directed to older adults’ care11.
Despite the political and technological propositions available in the country for PHC performance in this segment, literature on the actions effectively implemented evaluating their organization and supply is still scarce5, as well as on the challenges generated by population aging for these services5–7. Most studies evaluate the actions developed in PHC according to the older adults’ perception of the care they received, and those who take the organization of actions in a comprehensive way and directed to the work carried out by the teams as an evaluative focus are rare.
This study aims to evaluate the performance of comprehensive care for older adults in primary health care services according to their managers and professionals, as well as to analyze the relationship between performance and indicators of health planning and evaluation.
METHODS
Cross-sectional evaluative research based on the analysis of the results of QualiAB application in 2014. The evaluation occurred in PHC services located in five health regions in midwestern São Paulo: Bauru, Jaú, Lins, Polo Cuesta and Vale do Jurumirim, totaling 68 municipalities and 303 services, according to CNES12 (eliminating duplicate and non–corresponding registrations to PHC services).
This is a convenience sample, consisting of five health regions chosen for a census application of QualiAB 2014. The regions are in areas close to the higher education institution responsible for the research, with which previous partnerships were made in projects to support the management and evaluation of PHC services using the same instrument13. A total of 157 services distributed in 41 municipalities adhered to the project, representing 63% of the existing in the period12. Adhesion was voluntary since no financial incentive or prize was offered in the process.
Teams of each health service answered QualiAB 2014 online, after the municipal manager and the managers or responsible for each service adhered. This application integrated the instrument upgrade and revalidation process, originally validated in 200713–15.
This QualiAB version consists of 126 multiple–choice questions, which generate composite indicators for the overall evaluation of PHC services, to cover the diverse set of health actions attributed to primary care, as provided for the National Primary Care Policy (PNAB—Política Nacional de Atenção Básica)16. It is a questionnaire developed to evaluate and monitor services regarding the structure and organization of the work process by indicators of care and management, regardless of the type of unit, that is, organized both according to the Family Health Strategy and by another type of arrangement between the various existing compositions13.
To this study, we chose and categorized the variables of QualiAB 2014 related to older adults’ health and aging care, thus defining 155 performance indicators. First, we identified and analyzed documents on this evaluation object, to enable its delimitation and build a logical-theoretical model that will guide the selection of indicators and their organization in domains. Although a program specifically designed for the older adults’ health is not instituted, as it is with other segments, guidelines and technical standards are available, which allow delimiting the actions that should be developed at this level of care17.
We used the following documents: the Brazilian Health Policy for Older Adults (PNSPI—Política
Nacional de Saúde da Pessoa Idosa)18, and the guidelines of the Ministry of Health published in the Primary Care Guide no. 192, in the Strategic Action Plan to Tackle Noncommunicable Diseases (NCD) in Brazil 2011–202219, and in the technical manual Guidelines for the care of
people with chronic diseases in Health Care Nets and in priority lines of care20.
The QualiAB 2014 selected indicators were gathered according to three large sets of attributes considered essential to comprehensive care for the older adults’ health and aging in three domains: health care for active and healthy aging (d1, composed of 45 indicators), chronic noncommunicable diseases (CNCD) care (d2, composed of 89 indicators), and structure and support network in the aging care (d3, composed of 21 indicators).
Statistical analysis was conducted from different strategies. To each domain, a final score equivalent to the sum of dichotomous responses was assigned to the indicators that compose it. Value 1 refers to achievement and value 0 to non-achievement. We also defined three clusters (performance groups) using k-means related to the scores, to achieve maximum heterogeneity between the different groups and maximum internal homogeneity in each group21. The three groups were organized by decreasing gradation of k-means obtained by the services, naming group 1 (G1) the services with the highest k-means, and group 3 (G3) those with the lowest k-means.
The second stage tested the association of each group composition with the responses to 30 QualiAB 2014 indicators that characterize the activities related to the service planning and general evaluation, shown in Chart 1. The associations between the selected indicators and each of the three domains were estimated using chi-square tests followed by Z tests. As each domain consisted of different amounts of indicators (with maximum scores of 45, 89 and 21, respectively), the scores were standardized to keep them within the same magnitude scale.
With the standardized scores, simple and multiple linear regression models were adjusted. As independent variables we had the service selected characteristics (Chart 1), and as response variables, the scores of each domain. The variables that obtained r2 values above 50% and significance levels of the model lower than 0.25 with normal distribution of residues in simple adjustments were carried to multiple adjustment, in which those with r2 above 80%, p < 0.05 values, and normal residues distribution were maintained. All steps of statistical analysis were developed with SPSS software version 20.0.
This study was approved by the Research Ethics Committee of the Faculdade de Medicina de Botucatu, Universidade Estadual de São Paulo by opinion no. 855,404.
RESULTS
Among the 157 PHC services evaluated, according to self-classification, Family Health Units (FHU; 42%) prevailed, followed by traditional Basic Health Units (BHU; 36.9%). The Family Health Strategy (FHS) was present in 8.2% of the BHU, and the Community Health Agent Program (CHAP), in 8.9%; 1.2% were traditional BHU or FHU integrated to emergency care, and 2.5% of the services chose to be classified with other modalities.
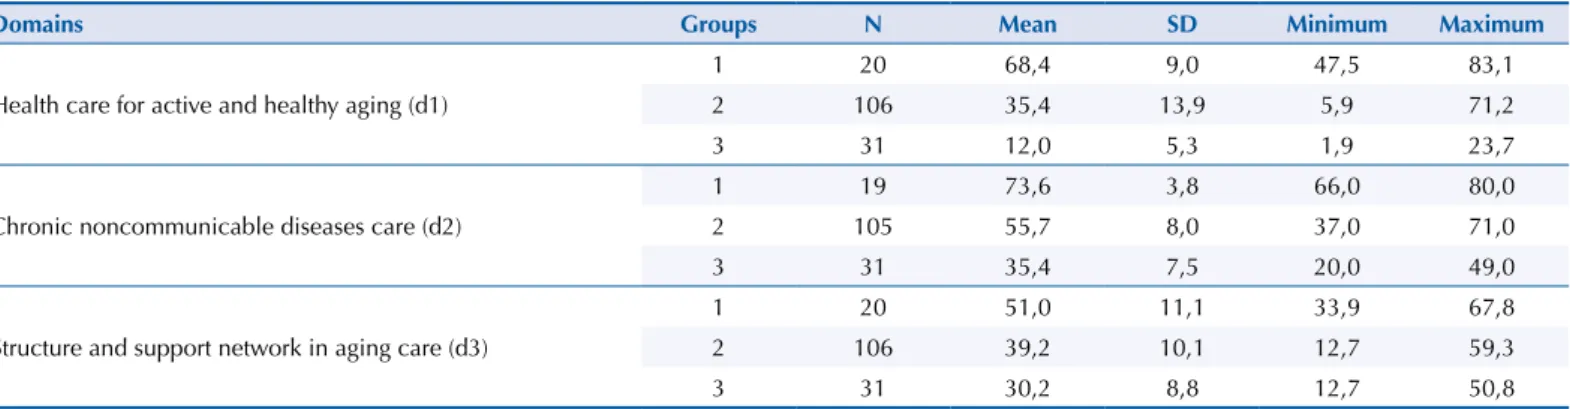
All 45 QualiAB 2014 indicators elected to domain 1 (d1) cover actions of promotion, prevention and assistance related to older adults; aging care in the prevention of health problems and in health promotion; strategies and actions in situations of violence against older adults; and attention to older adults’ caregivers. Domain 2 (d2) clustered 89 indicators corresponding to routine actions for people with CNCD and strategies to approach non-adherence to treatment; programmatic care, routine examinations and medications available to people with arterial hypertension and to people with type 2 diabetes mellitus; and actions for bedridden people care. In domain 3 (d3), we clustered 21 indicators related to infrastructure, supplies and professional qualifications that enable prevention and health promotion for an active and healthy aging, in addition to the network of services for older adults’ health care in collaborative work with primary care. The services distribution in the different groups (G1, G2 and G3) and the average performance according to each analysis domain are shown in Table 1.
Chart 1. Independent variables related to the planning and evaluation dimensions used in simple and multiple linear regression models,
based on the questionnaire QualiAB 2014.
Dimension Thematic cores Independent variables
Planning
Type of service
- Family Health Unit (FHU) - Traditional Basic Health Unit (BHU) - BHU with Family Health Strategy (FHS) - BHU with Community Health Agents Program (CHAP)
- BHU or FHU integrated to emergency care - Health outpost (PAS)
Geographic location
- Rural - Central urban - Peripheral urban Planning of the service
coverage area
- Area defined by participatory planning, considering local reality and ease of access - Area defined by the service team
- No definition of the coverage area Matrix support
- Family health support center (FHSC) - Multiprofessional team - It is not carried out by any instance
Evaluation
Use of epidemiological data for planning
- By municipal management and unit, for planning - By municipal management, but inappropriate by the unit
- Not used Participation in evaluations in the
last three years - Did not participate- Participated
Developments based on the evaluations performed
- Annual teamwork plan
- Activity planning and reprogramming with participation of the multiprofessional team - Report on the problems identified for the municipal secretariat
- The service lacked access to the results - No evaluation was carried out
Changes induced by evaluations
- Assistance organization - Service management
- Assistance management and organization - No changes were reported - Did not participate in any previous evaluation
In all three areas most services are concentrated in group 2 of performance, although with variations between the means achieved. The highest values were obtained in the domain of CNCD care (d2), in which the highest means are also visible.
In domain 1, it is noteworthy the services presented the lowest means among the groups with worst performances. In domain 3, group 1 obtained its lowest mean (51.0) among all domains. Notably, most services perform less than half of the set of indicators evaluated, composing groups 2 (39.2; d2) and 3 (30.2; d3). The slightest difference between the means of the groups in this domain suggests the services show less differentiation in relation to the indicators.
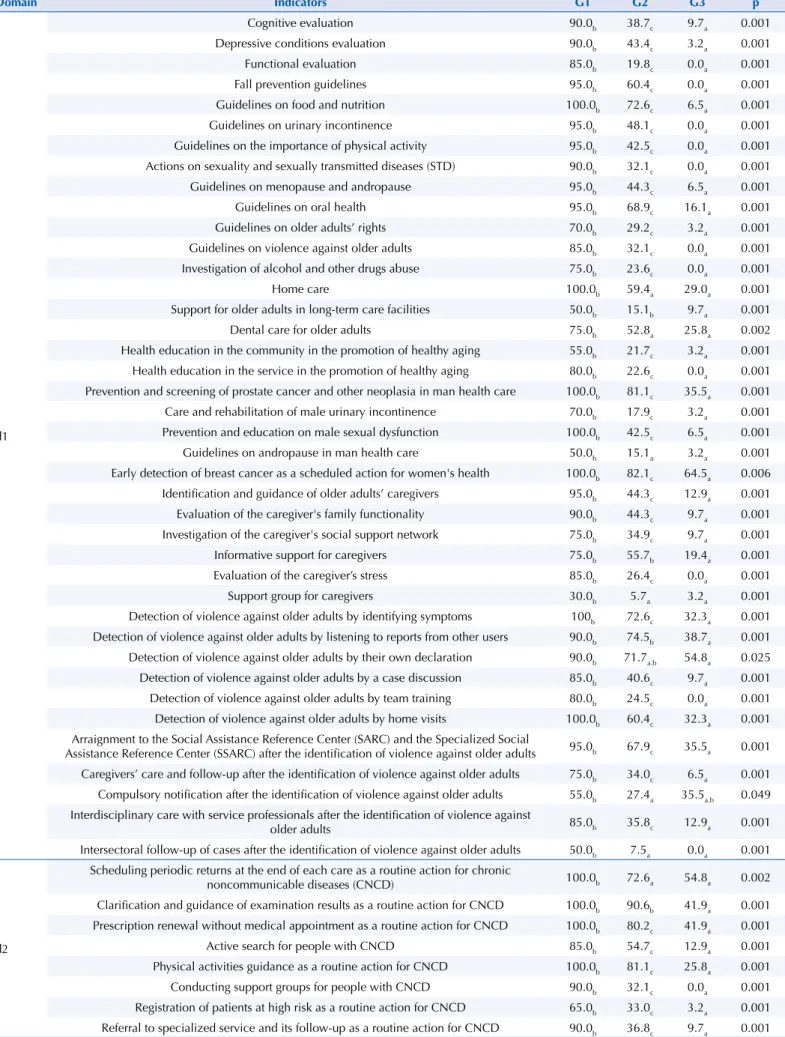
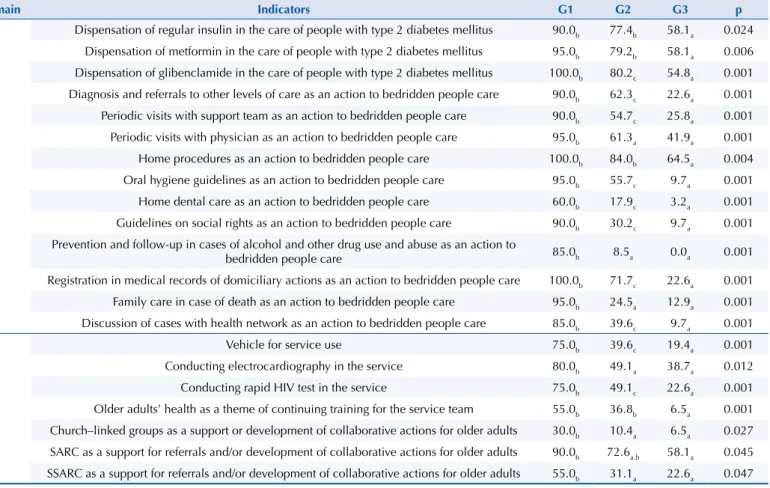
Tables 2 and 3 show the frequencies of indicators by domain and by performance group (G1, G2 and G3), allowing to deepen the understanding of central tendency measures. The differences between groups are significant in 72.9% (113) out of the 155 indicators, shown in Table 2. Services belonging to G1 have high percentages of achievement of most of the actions evaluated; however, they too lacks totality for a comprehensive care for older adults’ health and aging.
In domain 2, we observe the smallest percentage differences of achievement between the quality groups. The smaller response percentages are among the indicators of domain 3, focused on equipment with which services can share actions and care directed to older adults and promote the team’s continued training on older adults’ health—for example, the Specialized Social Assistance Reference Center (SSARC).
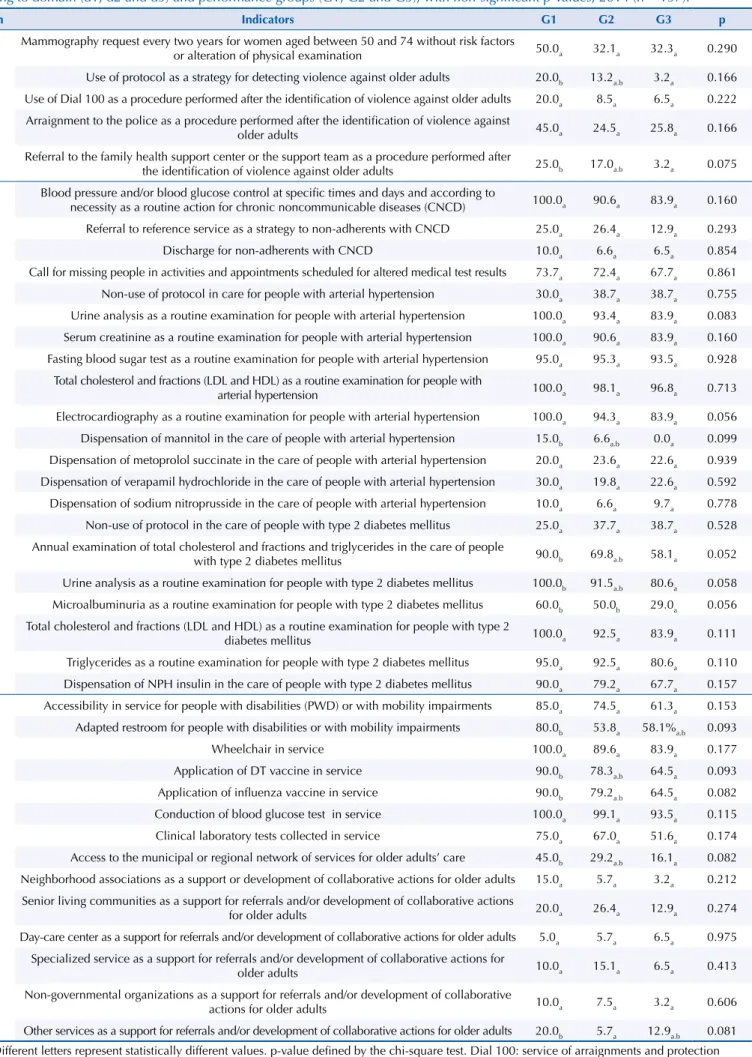
Table 3 features the indicators with no significance according to the chi-square test. This includes 27% (42) out of the 155 indicators. Notably, most of them are in domain 3, in which non-differentiation between groups is due to the availability of infrastructure and, on the other hand, to the lack of support from the services network to older adults’ care in most services.
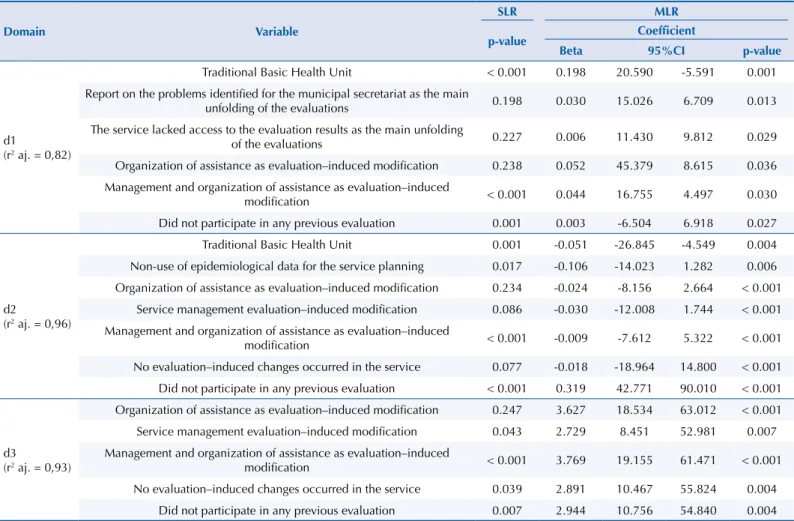
Table 4 provides adjustments to the simple and multiple linear regression (SLR and MLR) models for the domain scores for the health planning and evaluation variables that remained in the final multiple model, although others may have been adjusted according to the criterion defined in the method. Analyzing the independent variables related to the differentiation of quality groups for domain 1 (d1), we found that the service typology, the consequences of evaluations, and changes induced by evaluations are distinctive to compose groups with different performance.
For domain 2 (d2), the independent variables that reflect relation with the differentiation of quality groups relate to the services typology, the use of epidemiological data, and the changes induced by evaluations, to form groups with better or worse performances. In domain 3 (d3), independent variables that influence on the formation of the different performance quality groups for the set of indicators evaluated relate to the changes induced by evaluations.
Table 1. Performance of primary health and aging care services for older adults, clustered according to k-means, per analysis domain,
2014 (n = 157).
Domains Groups N Mean SD Minimum Maximum
Health care for active and healthy aging (d1)
1 20 68,4 9,0 47,5 83,1
2 106 35,4 13,9 5,9 71,2
3 31 12,0 5,3 1,9 23,7
Chronic noncommunicable diseases care (d2)
1 19 73,6 3,8 66,0 80,0
2 105 55,7 8,0 37,0 71,0
3 31 35,4 7,5 20,0 49,0
Structure and support network in aging care (d3)
1 20 51,0 11,1 33,9 67,8
2 106 39,2 10,1 12,7 59,3
3 31 30,2 8,8 12,7 50,8
Table 2. Percentage distribution (%) of performance indicator frequencies in older adults’ health and aging care in primary care services,
according to domain (d1, d2 and d3) and performance groups (G1, G2 and G3), with significant p-values, 2014 (n = 157).
Domain Indicators G1 G2 G3 p
d1
Cognitive evaluation 90.0b 38.7c 9.7a 0.001
Depressive conditions evaluation 90.0b 43.4c 3.2a 0.001
Functional evaluation 85.0b 19.8c 0.0a 0.001
Fall prevention guidelines 95.0b 60.4c 0.0a 0.001
Guidelines on food and nutrition 100.0b 72.6c 6.5a 0.001
Guidelines on urinary incontinence 95.0b 48.1c 0.0a 0.001
Guidelines on the importance of physical activity 95.0b 42.5c 0.0a 0.001
Actions on sexuality and sexually transmitted diseases (STD) 90.0b 32.1c 0.0a 0.001
Guidelines on menopause and andropause 95.0b 44.3c 6.5a 0.001
Guidelines on oral health 95.0b 68.9c 16.1a 0.001
Guidelines on older adults’ rights 70.0b 29.2c 3.2a 0.001
Guidelines on violence against older adults 85.0b 32.1c 0.0a 0.001
Investigation of alcohol and other drugs abuse 75.0b 23.6c 0.0a 0.001
Home care 100.0b 59.4a 29.0a 0.001
Support for older adults in long-term care facilities 50.0b 15.1b 9.7a 0.001
Dental care for older adults 75.0b 52.8a 25.8a 0.002
Health education in the community in the promotion of healthy aging 55.0b 21.7c 3.2a 0.001 Health education in the service in the promotion of healthy aging 80.0b 22.6c 0.0a 0.001 Prevention and screening of prostate cancer and other neoplasia in man health care 100.0b 81.1c 35.5a 0.001
Care and rehabilitation of male urinary incontinence 70.0b 17.9c 3.2a 0.001
Prevention and education on male sexual dysfunction 100.0b 42.5c 6.5a 0.001
Guidelines on andropause in man health care 50.0b 15.1a 3.2a 0.001
Early detection of breast cancer as a scheduled action for women's health 100.0b 82.1c 64.5a 0.006 Identification and guidance of older adults’ caregivers 95.0b 44.3c 12.9a 0.001
Evaluation of the caregiver's family functionality 90.0b 44.3c 9.7a 0.001
Investigation of the caregiver's social support network 75.0b 34.9c 9.7a 0.001
Informative support for caregivers 75.0b 55.7b 19.4a 0.001
Evaluation of the caregiver’s stress 85.0b 26.4c 0.0a 0.001
Support group for caregivers 30.0b 5.7a 3.2a 0.001
Detection of violence against older adults by identifying symptoms 100b 72.6c 32.3a 0.001 Detection of violence against older adults by listening to reports from other users 90.0b 74.5b 38.7a 0.001 Detection of violence against older adults by their own declaration 90.0b 71.7a.b 54.8a 0.025 Detection of violence against older adults by a case discussion 85.0b 40.6c 9.7a 0.001 Detection of violence against older adults by team training 80.0b 24.5c 0.0a 0.001 Detection of violence against older adults by home visits 100.0b 60.4c 32.3a 0.001 Arraignment to the Social Assistance Reference Center (SARC) and the Specialized Social
Assistance Reference Center (SSARC) after the identification of violence against older adults 95.0b 67.9c 35.5a 0.001 Caregivers’ care and follow-up after the identification of violence against older adults 75.0b 34.0c 6.5a 0.001 Compulsory notification after the identification of violence against older adults 55.0b 27.4a 35.5a.b 0.049 Interdisciplinary care with service professionals after the identification of violence against
older adults 85.0b 35.8c 12.9a 0.001
Intersectoral follow-up of cases after the identification of violence against older adults 50.0b 7.5a 0.0a 0.001
d2
Scheduling periodic returns at the end of each care as a routine action for chronic
noncommunicable diseases (CNCD) 100.0b 72.6a 54.8a 0.002
Clarification and guidance of examination results as a routine action for CNCD 100.0b 90.6b 41.9a 0.001 Prescription renewal without medical appointment as a routine action for CNCD 100.0b 80.2c 41.9a 0.001
Active search for people with CNCD 85.0b 54.7c 12.9a 0.001
Physical activities guidance as a routine action for CNCD 100.0b 81.1c 25.8a 0.001
Conducting support groups for people with CNCD 90.0b 32.1c 0.0a 0.001
Registration of patients at high risk as a routine action for CNCD 65.0b 33.0c 3.2a 0.001 Referral to specialized service and its follow-up as a routine action for CNCD 90.0b 36.8c 9.7a 0.001
Domain Indicators G1 G2 G3 p
d2
Referral to adherent group in the service as a strategy to non-adherents with CNCD 30.0b 10.4a 6.5a 0.027 Active search for non-adherents to the treatment with CNCD 85.0b 60.4c 25.8a 0.001 Home visit as a strategy for non-adherents to the treatment with CNCD 95.0b 59.4c 19.4a 0.001 Team discussion on approach alternatives as a strategy for non-adherents with CNCD 85.0b 37.7c 6.5a 0.001 Discussion of cases of non-adherents with CNCD with external supervision 25.0b 11.3b 0.0a 0.019 Convocation of missing adults with chronic diseases at risk of complications 90.0b 49.1a 38.7a 0.001 Follow-up with protocol in the care of people with arterial hypertension 75.0b 44.3c 9.7a 0.001 Three blood pressure measurements at different times in the care of people with
arterial hypertension 90.0b 61.3c 35.5a 0.001
Diet guidance in the care of people with arterial hypertension 100.0b 96.2b 74.2a 0.001 Obesity treatment and/or prevention in the care of people with arterial hypertension 100.0b 67.9c 25.8a 0.001 Periodic exam requests in the care of people with arterial hypertension 100.0b 86.8b 61.3a 0.001 Introduction of non-drug therapy as a first alternative in the care of people with
arterial hypertension 85.0b 56.6c 16.1a 0.001
Cardiovascular risk assessment for drug therapy in the care of people with arterial hypertension 100.0b 57.5c 22.6a 0.001 Group activities in the care of people with arterial hypertension 85.0b 50.9c 6.5a 0.001 Guidance for physical activities in the care of people with arterial hypertension 100.0b 84.0b 45.2a 0.001 Guidance and support for smoking cessation in the care of people with arterial hypertension 95.0b 64.2c 19.4a 0.001 Investigation of alcohol and other drugs abuse in the care of people with arterial hypertension 85.0b 50.0c 0.0a 0.001 Potassium as a routine examination for people with arterial hypertension 100.0b 92.5b 71.0a 0.001 Triglycerides as a routine examination for people with arterial hypertension 100.0a.b 96.2b 83.9a 0.017 Uric acid as a routine examination for people with arterial hypertension 100.0b 91.5b 77.4a 0.020 Funduscopy as a routine examination for people with arterial hypertension 55.0b 18.9c 3.2a 0.001 Dispensation of hydrochlorothiazide in the care of people with arterial hypertension 100.0b 86.8b 67.7a 0.004 Dispensation of furosemide in the care of people with arterial hypertension 100.0b 86.8b 67.7a 0.004 Dispensation of spironolactone in the care of people with arterial hypertension 95.0b 68.9c 48.4a 0.002 Dispensation of atenolol in the care of people with arterial hypertension 65.0a.b 72.6b 45.2a 0.017 Dispensation of propranolol in the care of people with arterial hypertension 100.0b 87.7b 58.1a 0.001 Dispensation of methyldopa in the care of people with arterial hypertension 95.0b 79.2b 58.1a 0.006 Dispensation of amlodipine besylate in the care of people with arterial hypertension 65.0b 59.4b 25.8a 0.002 Dispensation of hydralazine hydrochloride in the care of people with arterial hypertension 20.0b 4.7%a 6.5a.b 0.049 Dispensation of captopril in the care of people with arterial hypertension 100.0b 87.7b 64.5a 0.001 Dispensation of enalapril in the care of people with arterial hypertension 100.0b 76.4a 64.5a 0.013 Follow-up with protocol in the care of people with type 2 diabetes mellitus 75.0b 47.2c 16.1a 0.001 Diet guidance for people with type 2 diabetes mellitus 100.0b 96.2b 80.6a 0.003 Obesity treatment and/or prevention in the care of people with type 2 diabetes mellitus 95.0b 80.2b 32.3a 0.001 Periodic exam requests in the care of people with type 2 diabetes mellitus 100.0b 90.6b 67.7a 0.001 Control, evaluation and guidance of foot care for people with type 2 diabetes mellitus 100.0b 82.1c 41.9a 0.001 Training for self-application of insulin in the care of people with type 2 diabetes mellitus 100.0b 82.1c 51.6a 0.001 Glycometer supply in the care of people with type 2 diabetes mellitus 90.0b 75.5b 48.4a 0.002 Group activities for people with type 2 diabetes mellitus 95.0b 52.8c 6.5a 0.001 Physical activity guidance for people with type 2 diabetes mellitus 100.0b 84.0b 32.3a 0.001 Guidance and support for smoking cessation for people with type 2 diabetes mellitus 90.0b 55.7c 12.9a 0.001 Fasting blood sugar test as a routine examination for people with type 2 diabetes mellitus 100.0a.b 100.0b 87.1a 0.001 Serum creatinine as a routine examination for people with type 2 diabetes mellitus 95.0b 86.8b 71.0a 0.039 Glycated hemoglobin every three months, then every six months, as a routine examination for
people with type 2 diabetes mellitus 95.0b 84.9b 54.8a 0.001
Funduscopy as a routine examination for people with type 2 diabetes mellitus 75.0b 40.6c 6.5a 0.001 Electrocardiography as a routine examination requested for people with type 2 diabetes mellitus 85.0b 66.0a.b 48.4a 0.026
Table 2. Percentage distribution (%) of performance indicator frequencies in older adults’ health and aging care in primary care services,
according to domain (d1, d2 and d3) and performance groups (G1, G2 and G3), with significant p-values, 2014 (n = 157). (Continuation)
Domain Indicators G1 G2 G3 p
d2
Dispensation of regular insulin in the care of people with type 2 diabetes mellitus 90.0b 77.4b 58.1a 0.024 Dispensation of metformin in the care of people with type 2 diabetes mellitus 95.0b 79.2b 58.1a 0.006 Dispensation of glibenclamide in the care of people with type 2 diabetes mellitus 100.0b 80.2c 54.8a 0.001 Diagnosis and referrals to other levels of care as an action to bedridden people care 90.0b 62.3c 22.6a 0.001 Periodic visits with support team as an action to bedridden people care 90.0b 54.7c 25.8a 0.001 Periodic visits with physician as an action to bedridden people care 95.0b 61.3a 41.9a 0.001 Home procedures as an action to bedridden people care 100.0b 84.0b 64.5a 0.004 Oral hygiene guidelines as an action to bedridden people care 95.0b 55.7c 9.7a 0.001 Home dental care as an action to bedridden people care 60.0b 17.9c 3.2a 0.001 Guidelines on social rights as an action to bedridden people care 90.0b 30.2c 9.7a 0.001 Prevention and follow-up in cases of alcohol and other drug use and abuse as an action to
bedridden people care 85.0b 8.5a 0.0a 0.001
Registration in medical records of domiciliary actions as an action to bedridden people care 100.0b 71.7c 22.6a 0.001 Family care in case of death as an action to bedridden people care 95.0b 24.5a 12.9a 0.001 Discussion of cases with health network as an action to bedridden people care 85.0b 39.6c 9.7a 0.001
d3
Vehicle for service use 75.0b 39.6c 19.4a 0.001
Conducting electrocardiography in the service 80.0b 49.1a 38.7a 0.012
Conducting rapid HIV test in the service 75.0b 49.1c 22.6a 0.001
Older adults’ health as a theme of continuing training for the service team 55.0b 36.8b 6.5a 0.001 Church–linked groups as a support or development of collaborative actions for older adults 30.0b 10.4a 6.5a 0.027 SARC as a support for referrals and/or development of collaborative actions for older adults 90.0b 72.6a.b 58.1a 0.045 SSARC as a support for referrals and/or development of collaborative actions for older adults 55.0b 31.1a 22.6a 0.047 Notes: Different letters represent statistically different values. p-value defined by the chi-square test.
It is important to note the adjustment model (r2) for each domain proved to be great, a fact corroborated by its results: 0.82%, 0.96% and 0.93%, respectively.
DISCUSSION
The results point to a better performance of PHC services in actions related to chronic noncommunicable diseases, matching with results from other studies22,23 and reflecting the undifferentiation with which services fulfill the scope of actions in older adults’ health and aging care. Prevention and promotion actions were incompletely incorporated into few services, and most of them lack a support network to collaborative work, resulting on the lack of comprehensive care for older adults’ health in the sample.
This is corroborated by a descriptive study previously conducted by the authors with analysis of the response frequencies of these primary care services on the indicators. This study identified: the presence of a support group for older adults’ caregivers in few services (8.2%), the use of a protocol to attend cases of violence against older adults (12.1%), a record with differentiated risk for people with chronic conditions (31.2%), and inclusion of older adults’ health as the subject of continuing education for the professional team (33.1%)11. Aging and longevity are strongly associated with developing chronic diseases, because aging without any chronic disease is rare24. However, old age cannot be reduced to a set of illnesses in the actions developed in PHC.
The relevance of preventive actions for comprehensive care to the adult’s—and especially to the older adult’s—health apparently is a consensus; however, notably, practices tend to be restricted to the care of more prevalent CNCD5,24. It is obviously not a question of minimizing
Table 2. Percentage distribution (%) of performance indicator frequencies in older adults’ health and aging care in primary care services,
Table 3. Percentage distribution (%) of performance indicators frequencies in older adults’ health and aging care in primary care services,
according to domain (d1, d2 and d3) and performance groups (G1, G2 and G3), with non-significant p-values, 2014 (n = 157).
Domain Indicators G1 G2 G3 p
d1
Mammography request every two years for women aged between 50 and 74 without risk factors
or alteration of physical examination 50.0a 32.1a 32.3a 0.290
Use of protocol as a strategy for detecting violence against older adults 20.0b 13.2a.b 3.2a 0.166 Use of Dial 100 as a procedure performed after the identification of violence against older adults 20.0a 8.5a 6.5a 0.222 Arraignment to the police as a procedure performed after the identification of violence against
older adults 45.0a 24.5a 25.8a 0.166
Referral to the family health support center or the support team as a procedure performed after
the identification of violence against older adults 25.0b 17.0a.b 3.2a 0.075
d2
Blood pressure and/or blood glucose control at specific times and days and according to
necessity as a routine action for chronic noncommunicable diseases (CNCD) 100.0a 90.6a 83.9a 0.160 Referral to reference service as a strategy to non-adherents with CNCD 25.0a 26.4a 12.9a 0.293
Discharge for non-adherents with CNCD 10.0a 6.6a 6.5a 0.854
Call for missing people in activities and appointments scheduled for altered medical test results 73.7a 72.4a 67.7a 0.861 Non-use of protocol in care for people with arterial hypertension 30.0a 38.7a 38.7a 0.755 Urine analysis as a routine examination for people with arterial hypertension 100.0a 93.4a 83.9a 0.083 Serum creatinine as a routine examination for people with arterial hypertension 100.0a 90.6a 83.9a 0.160 Fasting blood sugar test as a routine examination for people with arterial hypertension 95.0a 95.3a 93.5a 0.928
Total cholesterol and fractions (LDL and HDL) as a routine examination for people with
arterial hypertension 100.0a 98.1a 96.8a 0.713
Electrocardiography as a routine examination for people with arterial hypertension 100.0a 94.3a 83.9a 0.056 Dispensation of mannitol in the care of people with arterial hypertension 15.0b 6.6a.b 0.0a 0.099 Dispensation of metoprolol succinate in the care of people with arterial hypertension 20.0a 23.6a 22.6a 0.939 Dispensation of verapamil hydrochloride in the care of people with arterial hypertension 30.0a 19.8a 22.6a 0.592 Dispensation of sodium nitroprusside in the care of people with arterial hypertension 10.0a 6.6a 9.7a 0.778 Non-use of protocol in the care of people with type 2 diabetes mellitus 25.0a 37.7a 38.7a 0.528 Annual examination of total cholesterol and fractions and triglycerides in the care of people
with type 2 diabetes mellitus 90.0b 69.8a.b 58.1a 0.052
Urine analysis as a routine examination for people with type 2 diabetes mellitus 100.0b 91.5a.b 80.6a 0.058 Microalbuminuria as a routine examination for people with type 2 diabetes mellitus 60.0b 50.0b 29.0a 0.056 Total cholesterol and fractions (LDL and HDL) as a routine examination for people with type 2
diabetes mellitus 100.0a 92.5a 83.9a 0.111
Triglycerides as a routine examination for people with type 2 diabetes mellitus 95.0a 92.5a 80.6a 0.110 Dispensation of NPH insulin in the care of people with type 2 diabetes mellitus 90.0a 79.2a 67.7a 0.157
d3
Accessibility in service for people with disabilities (PWD) or with mobility impairments 85.0a 74.5a 61.3a 0.153 Adapted restroom for people with disabilities or with mobility impairments 80.0b 53.8a 58.1%a.b 0.093
Wheelchair in service 100.0a 89.6a 83.9a 0.177
Application of DT vaccine in service 90.0b 78.3a.b 64.5a 0.093
Application of influenza vaccine in service 90.0b 79.2a.b 64.5a 0.082
Conduction of blood glucose test in service 100.0a 99.1a 93.5a 0.115
Clinical laboratory tests collected in service 75.0a 67.0a 51.6a 0.174
Access to the municipal or regional network of services for older adults’ care 45.0b 29.2a.b 16.1a 0.082 Neighborhood associations as a support or development of collaborative actions for older adults 15.0a 5.7a 3.2a 0.212 Senior living communities as a support for referrals and/or development of collaborative actions
for older adults 20.0a 26.4a 12.9a 0.274
Day-care center as a support for referrals and/or development of collaborative actions for older adults 5.0a 5.7a 6.5a 0.975 Specialized service as a support for referrals and/or development of collaborative actions for
older adults 10.0a 15.1a 6.5a 0.413
Non-governmental organizations as a support for referrals and/or development of collaborative
actions for older adults 10.0a 7.5a 3.2a 0.606
Other services as a support for referrals and/or development of collaborative actions for older adults 20.0b 5.7a 12.9a.b 0.081 Notes: Different letters represent statistically different values. p-value defined by the chi-square test. Dial 100: service of arraignments and protection against human rights violations, available 24 hours every day.
the importance of the quality of care for people with chronic diseases, but of emphasizing that older adults are often inserted in this set of problems, which does not automatically offer the necessary for them and for their aging.
Naturally, the actions performed by the HiperDia program, instituted since 2002 by the Brazilian Ministry of Health for people with systemic arterial hypertension and diabetes mellitus25, were implemented because chronic diseases represent one of the main demands for continuous follow-up in PHC services. However, to invest in improving the quality of this care is necessary, because the services fail to fully perform the recommended, as in relation to periodic funduscopy or foot care for people with diabetes, which occur in few services evaluated11.
In this study, it is possible to verify that the guidelines for health prevention and promotion are not being implemented in older adults and aging care, which also occurs with other stages of the life cycle and health demands26,27. In this sense, monitoring older adults’ functional capacity becomes a strategic indicator for health services23, especially for primary care services, which are potentially instrumentalized by the use of scales for functional and cognitive evaluation, among others, available in the Primary Care Guide no. 192.
Studies on older adults’ care by primary care services conducted in Rio de Janeiro (RJ)28 and in Santos (SP)29 found a great disarticulation of the health services network in general and, especially, an absence of an older adults’ health care network, which hampers the supplying of this population health needs. Associations between the performance of the services in older adults’ care and the performance of activities indicative of local planning and evaluation show the importance of service management in determining the technical
Table 4. Adjustments of simple and multiple linear regression (SLR and MLR) models for the domain scores by general planning activity
variables and service evaluation and typology, based on the questionnaire for primary care services assessment and monitoring (QualiAB) 2014 (n = 157).
Domain Variable
SLR MLR
p-value Coefficient
Beta 95%CI p-value
d1
(r2 aj. = 0,82)
Traditional Basic Health Unit < 0.001 0.198 20.590 -5.591 0.001
Report on the problems identified for the municipal secretariat as the main
unfolding of the evaluations 0.198 0.030 15.026 6.709 0.013
The service lacked access to the evaluation results as the main unfolding
of the evaluations 0.227 0.006 11.430 9.812 0.029
Organization of assistance as evaluation–induced modification 0.238 0.052 45.379 8.615 0.036 Management and organization of assistance as evaluation–induced
modification < 0.001 0.044 16.755 4.497 0.030
Did not participate in any previous evaluation 0.001 0.003 -6.504 6.918 0.027
d2
(r2 aj. = 0,96)
Traditional Basic Health Unit 0.001 -0.051 -26.845 -4.549 0.004
Non-use of epidemiological data for the service planning 0.017 -0.106 -14.023 1.282 0.006 Organization of assistance as evaluation–induced modification 0.234 -0.024 -8.156 2.664 < 0.001
Service management evaluation–induced modification 0.086 -0.030 -12.008 1.744 < 0.001 Management and organization of assistance as evaluation–induced
modification < 0.001 -0.009 -7.612 5.322 < 0.001
No evaluation–induced changes occurred in the service 0.077 -0.018 -18.964 14.800 < 0.001 Did not participate in any previous evaluation < 0.001 0.319 42.771 90.010 < 0.001
d3
(r2 aj. = 0,93)
Organization of assistance as evaluation–induced modification 0.247 3.627 18.534 63.012 < 0.001
Service management evaluation–induced modification 0.043 2.729 8.451 52.981 0.007
Management and organization of assistance as evaluation–induced
modification < 0.001 3.769 19.155 61.471 < 0.001
No evaluation–induced changes occurred in the service 0.039 2.891 10.467 55.824 0.004
Did not participate in any previous evaluation 0.007 2.944 10.756 54.840 0.004
performance of programmatic activities. In particular, the low incorporation and use of data resulting from evaluation processes highlights the need to strengthen and improve monitoring and evaluation practices as subsidies for reprogramming technical actions of care, such as those directed to older adults’ health and to aging.
The limits of a cross-sectional study carried out in certain health regions and with a convenience sample should inhibit generalization of results. However, it brings significant elements in the face of the evaluation gap and the absence of instruments directed to assess older adults’ and aging care. In this sense, the study proved feasible to use an instrument that does not focus on this assessment but uses it as part of the diverse set of actions under the responsibility of PHC services.
It is necessary to advance in the provision of practices aimed at older adults by PHC services that seek to face the health demands of this population, aiming to understand the needs arising from aging and to collaborate so that individuals achieve old age with independence, autonomy and productivity29, because most chronic diseases that affect older adults have their main risk factor in their own age24. A contemporary model focused on aging, but especially in the older adult, needs to gather a sequence of education, health promotion, prevention of evitable diseases and postponement of injuries. To achieve positive results, an articulated, referenced network with information system built is essential24,30.
CONCLUSIONS
The performance of comprehensive care for older adults in primary care services in the Brazilian Unified Health System in the state of São Paulo is incipient. Incipience is stronger in healthy aging care activities, while those for treatment of some chronic diseases show relatively better performance.
To distinguish three groups of decreasing performance services was possible according to the three domains evaluated. The intermediate group, group 2, concentrates most services (67%). The best group, group 1, is minority (12%). The worst performing group, group 3, concentrates 31 services (20%) and shows worst performance in all domains, especially in the healthy aging care.
Results indicate the need to improve older adults’ care in all domains, emphasizing, however, the urgency of improving local performance and health network in the effective implementation of actions to aging and older adults’ care according to the Ministry of Health guidelines. The precariousness of performance of various services also draws attention. The evaluation framework was able to characterize and differentiate the current performance of older adults’ care in PHC services and can be used to establish and disseminate new normative standards for PHC.
REFERENCES
1. World Health Organization. Active aging: towards age-friendly primary health care. Geneva; WHO; 2004 [citado 23 jun 2016]. Available from: http://apps.who.int/iris/bitstream/10665/43030/1/9241592184.pdf
2. Ministério da Saúde (BR), Secretaria de Atenção à Saúde, Departamento de Atenção Básica. Envelhecimento e saúde da pessoa idosa. Brasília, DF; 2007 [citado 15 maio 2015]. (Série A, Normas e Manuais Técnicos) (Cadernos de Atenção Básica, 19). Available from: http://bvsms.saude.gov.br/bvs/publicacoes/abcad19.pdf
3. Onocko-Campos RT, Campos GWS, Ferrer AL, Corrêa CRS, Madureira PR, Gama CAP, et al. Avaliação de estratégias inovadoras na organização da Atenção Primária à Saúde. Rev Saude Publica. 2012;46(1):43-50. https://doi.org/10.1590/S0034-89102011005000083
4. Furtado JP, Vieira-da-Silva LM. A avaliação de programas e serviços de saúde no Brasil enquanto espaço de saberes e práticas. Cad Saude Publica. 2014;30(12):2643-55. https://doi.org/10.1590/0102-311X00187113
5. Oliveira EB, Bozzetti MC, Hauser L, Duncan BB, Harzheim E. Avaliação da qualidade do cuidado a idosos nos serviços da rede pública de atenção primária à saúde de Porto Alegre, RS, Brasil. Rev Bras Med Fam Comunidade. 2013;8(29):264-73. https://doi.org/10.5712/rbmfc8(29)826
6. Bara VMF, Paz EPA, Guimarães RM, Silva BF, Gama BBM, Moratelli L. Diagnóstico de utilização do instrumento de avaliação da atenção primária à saúde – PCATool-Brasil versão adulto – para população idosa. Cad Saude Coletiva. 2015;23(3):330-5. https://doi.org/10.1590/1414-462X201400080015
7. Araújo LUA, Gama ZAS, Nascimento FLA, Oliveira HFV, Azevedo WM, Almeida Júnior HJB. Avaliação da qualidade da atenção primária à saúde sob a perspectiva do idoso. Cienc Saude Coletiva. 2014;19(8):3521-32. https://doi.org/10.1590/1413-81232014198.21862013 8. Tracy SC, Bell SH, Nickell LA, Charles J, Upshur REG. The IMPACT clinic innovative model of
interprofessional primary care for elderly patients with complex health care needs. Can Fam Physician. 2013;59(3):148-55.
9. Ruikes FGH, Meys ARM, Wetering G, Akkermans RP, Gaal BG, Zuidema SU, et al. The CareWell-primary care program: design of a cluster controlled trial and process evaluation of a complex intervention targeting community-dwelling frail elderly. BMC Fam Pract. 2012;13:115. https://doi.org/10.1186/1471-2296-13-115
10. Fishman PA, Johnson EA, Coleman K, Larson EB, Hsu C, Ross TR, et al. Impact on seniors of the patient-centered medical home: evidence from a pilot study. Gerontologist. 2012;52(5):703-11. https://doi.og/10.1093/geront/gnr158
11. Placideli N, Castanheira ERL. Atenção à saúde da pessoa idosa e ao envelhecimento em uma rede de serviços de Atenção Primária. Kairós Gerontol. 2017;20(2):247-69. https://doi.org/10.23925/2176-901X.2017v20i2p247-269
12. Ministério da Saúde (BR). Cadastro Nacional de Estabelecimentos de Saúde. Brasília, DF; s.d. [citado 1 dez 2018]. Available from: http://cnes.datasus.gov.br/pages/estabelecimentos/consulta.jsp 13. Castanheira, ERL, Nemes MIB, Zarili TFT, Sanine PR, Corrente JE. Avaliação de serviços de
Atenção Básica em municípios de pequeno e médio porte no estado de São Paulo: resultados da primeira aplicação do instrumento QualiAB. Saude Debate. 2014;38(103): 679-91. https://doi.org/10.5935/0103-1104.20140063
14. Castanheira ERL. QualiAB: desenvolvimento e validação de uma metodologia de avaliação de serviços de atenção básica. Saude Soc. 2011;20(4):935-47. https://doi.org/10.1590/S0104-12902011000400011
15. Zarili TFT. Avaliação de serviços de atenção básica: atualização e validação do instrumento QualiAB [dissertação]. Botucatu: Faculdade de Medicina de Botucatu, Universidade Estadual Júlio de Mesquita Filho; 2015.
16. Ministério da Saúde (BR). Portaria Nº 2.436, de 21 de setembro de 2017. Aprova a Política Nacional de Atenção Básica, estabelecendo a revisão de diretrizes para a organização da Atenção Básica, no âmbito do Sistema Único de Saúde (SUS). Brasília (DF): 2017 [citado 1 dez 2018]. Available from: http://bvsms.saude.gov.br/bvs/saudelegis/gm/2017/prt2436_22_09_2017.html 17. Ramos NP. Avaliação da atenção à saúde da pessoa idosa e ao envelhecimento em serviços de
Atenção Primária [tese]. Botucatu: Faculdade de Medicina de Botucatu, Universidade Estadual Júlio de Mesquita Filho; 2018.
18. Ministério da Saúde (BR). Portaria Nº 2.528, de 19 de outubro de 2006. Aprova a Política Nacional de Saúde da Pessoa Idosa. Brasília, DF; 2006 [citado 15 maio 2015]. Available from: http://bvsms.saude.gov.br/bvs/saudelegis/gm/2006/prt2528_19_10_2006.html
19. Ministério da Saúde (BR), Secretaria de Vigilância em Saúde, Departamento de Análise de Situação de Saúde. Plano de ações estratégicas para o enfrentamento das doenças crônicas não transmissíveis (DCNT) no Brasil 2011-2022. Brasília, DF; 2011 [citado 15 maio 2015]. (Série B. Textos Básicos de Saúde). Available from: http://bvsms.saude.gov.br/bvs/publicacoes/plano_acoes_enfrent_dcnt_2011.pdf
20. Ministério da Saúde (BR), Secretaria de Atenção à Saúde, Departamento de Atenção Básica. Diretrizes para cuidados de pessoas com doenças crônicas nas redes de atenção à saúde e nas linhas de cuidados prioritárias. Brasília, DF; 2013 [citado 15 maio 2015]. Available from: http:// bvsms.saude.gov.br/bvs/publicacoes/diretrizes%20_cuidado_pessoas%20_doencas_cronicas.pdf
21. Tanaka OY, Drumond Júnior M, Cristo EB, Spedo SM, Pinto NRS. Uso da análise de clusters como ferramenta de apoio à gestão do SUS. Saude Soc. 2015;24(1):34-45. https://doi.org/10.1590/S0104-12902015000100003
22. Van Olmen J, Marie KG, Christian D, Clovis KJ, Emery B, Maurits VP, et al. Content, participants and outcomes of three diabetes care programmes in three low and middle income countries. Prim Care Diabetes. 2015;9(3):196-202. https://doi.org/10.1016/j.pcd.2014.09.001
23. Rabetti AC, Freitas SFT. Avaliação das ações em hipertensão arterial sistêmica na atenção básica. Rev Saude Publica. 2011;45(2):258-68. https://doi.org/10.1590/S0034-89102011005000007 24. Veras RP, Caldas CP, Cordeiro HA. Modelos de atenção á saúde do
idoso: repensando o sentido da prevenção. Physis. 2013;23(4):1189-213. https://doi.org/10.1590/S0103-73312013000400009
25. Ministério da Saúde (BR), Secretaria de Políticas de Saúde, Departamento de Ações Programáticas Estratégicas. Plano de reorganização da atenção a hipertensão arterial e ao diabetes mellitus: manual de hipertensão arterial e diabetes. Brasília, DF; 2002 [citado 15 maio 2015]. (Série C. Projetos, Progamas e Relatórios, 59). Disponível em: http://bvsms.saude.gov.br/bvs/publicacoes/miolo2002.pdf
26. Nasser MA, Nemes MIB, Andrade MC, Prado RR, Castanheira ERL. Avaliação na atenção primária paulista: ações incipientes em saúde sexual e reprodutiva. Rev Saude Publica. 2017;51:77. https://doi.org/10.11606/S1518-8787.2017051006711
27. Sanine PR, Zarili TFT, Nunes LO, Dias A, Castanheira ERL. Do preconizado à prática: oito anos de desafios para a saúde da criança em serviços de atenção primária no interior de São Paulo. Cad Saude Publica. 2018;34(6): e00094417. https://doi.org/10.1590/0102-311X00094417 28. Motta LB, Aguiar AC, Caldas CP. Estratégia Saúde da Família e a atenção ao idoso:
experiência em três municípios brasileiros. Cad Saude Publica. 2011;27(4):779-86. https://doi.org/10.1590/S0102-311X2011000400017
29. Costa MFBNA, Ciosak SI. Atenção integral na saúde do idoso no Programa Saúde da Família: visão dos profissionais de saúde. Rev Esc Enferm USP. 2010;44(2):437-44. https://doi.org/10.1590/S0080-62342010000200028
30. Veras RP, Caldas CP, Motta LB, Lima KC, et al. Integração e continuidade do cuidado em modelos de rede de atenção à saúde para idosos frágeis. Rev Saude Publica. 2014;48(2):357-65. https://doi.org/10.1590/S0034-8910.2014048004941
Funding: Conselho Nacional de Desenvolvimento Científico e Tecnológico (CNPq), process 485848/2012-0. Doctorate scholarship for NP (2014-2018) by Coordenação de Aperfeiçoamento de Pessoal de Nível Superior (CAPES). Authors’ Contribution: Study conception and planning: NP, ERLC. Data collection, analysis and interpretation: NP, ERLC, AD, JLFC, PRS, DFM, CSM, TFTZ, LON, JFCM. Manuscript development or revision: NP, ERLC, PSA, ZMAH, MIBN. Approval of the final version: NP, ERLC, MIBN. Public responsibility for the contents of the article: NP, ERLC.