Carlos Pestana Barros & Nicolas Peypoch
A Comparative Analysis of Productivity Change in Italian and
Portuguese Airports
WP 006/2007/DE
_________________________________________________________
Arcanjo, M., Bastos, A. , Nunes, F. and Passos, J.
How do work and public policies interact with
child poverty?
WP 14/2012/DE/SOCIUS/UECE/CEMAPRE
_________________________________________________________
Department of Economics
W
ORKINGP
APERS ISSN Nº 0874-4548School of Economics and Management
TECHNICAL UNIVERSITY OF LISBON1
How do work and public policies interact with child poverty?
Arcanjo, M.[1] , Bastos, A.[2] , Nunes, F.[3] and Passos, J.[4]
School of Economics and Management [ISEG] – Technical University of Lisbon
Outline
0. Abstract 1. Introduction
2. Child poverty trends
3. Government intervention: policies to ensure sufficient resources for families 4. Social transfers and poverty
5. Conclusions
[1] [email protected], Research Centre in Economic and Organizational Sociology (SOCIUS).
[2] [email protected], Centre for Applied Mathematics and Economics (CEMAPRE). Corresponding author [3] [email protected], Research Unit on Economics and Complexity (UECE).
2 Abstract
Child poverty is a problem firmly recognized in the industrialized world. In the EU nearly one in every five children was poor in 2008 (for the population as a whole the risk of poverty was around 17 per cent). The dimension of the problem and its consequences point out for the importance of knowing the processes behind it.
This paper aims to investigate how labour market issues and public policies have been impact on child poverty, over recent years. Based on microdata gathered by the European Union Statistics on Income and Living Conditions (EU_SILC) for the period 2004-08 we give a portrait of child income poverty in European Southern countries such as: Italy, Portugal and Spain and also in Poland. Moreover, we investigate the major changes in social policies that could impact on child poverty such benefits target on family and child allowances.
The international comparison will allow the identification of children’s poverty profile and pattern across the countries analysed and also design the different compositions between labour market elements / public policies in such countries. This exercise of comparison also enables a first test of the efficiency of these policies.
The methodological framework used varies from descriptive methods to econometric models in order to sustain the discussion of the subject under study.
Keywords: child poverty, income, cross-section, dynamics, social policies, labour market.
3 Introduction
Child poverty is a problem worldwide recognized and its reduction is a social priority1. According to the statistics of EUROSTAT, in the EU almost one in every five children is poor, which means deficits in material well-being for children and cost for the society as a whole2.
Despite the social policies that have been applied so far the problem of child poverty still stick out, questioning the design of the measures undertaken. The role of social transfers intended to reinforce family’s resources has been quite weak. Moreover, the importance of child poverty within non-working parents points out the importance of labour market issues on child poverty3.
In this paper we intend to analyze the impact of work and social transfers on child poverty in South-European countries, such as: Italy, Portugal and Spain and also in an emerge European economy – Poland, in order to investigate how different social policies designs and work conditions have been impact on child poverty in recent years. Based on data gathered by European Statistics on Income and Living Conditions – EU_SILC – for the period 2004-08, we assess the extent to which child poverty trends have been associated to social transfers and parent’s work conditions, during the period under study.
The paper is organized as follows: after this introductory section we analyze child poverty trends in section 2. Than we describe the government interventions in the four economies intended to ensure a minimum level of resources to families, in the third section. In section 4 we investigate the impact of social transfers on child poverty. Finally in the fifth section, we conclude by discussing the interactions between child poverty empirical results and government actions undertaken to protect families.
4 1. Child poverty trends
The definition and measurement of poverty has been widely discussed4 in terms of the concepts used - to define who is poor - and in terms of the indicators considered - to evaluate poverty. In this paper the definition of poverty used comes from the monetary approach to this problem. Upon the observation of household’s resources we define a poverty line that defines individuals as poor or non-poor. This methodology includes some important issues that need to be detailed.
The first issue to be specified is the resource variable used. Taking into account the statistical availability and accuracy of annual household income, this is the resource variable adopted. As our unit of analysis is the individual, in investigating child poverty we have to impute income to the child, which calls for the second issue to be discussed. In fact household income is strongly associated with children’s life conditions and, therefore, with child wellbeing. To impute income to the child we consider that household resources are equally shared within family members5. To take into account different household compositions we apply the OCDE modified equivalence scale which is the basis for calculating income per equivalent adult. The individual is the unit of observation and the household is the unit of measurement. The identification of the poor is based upon the calculation of a poverty line, defined as 60 per cent of median income per equivalent adult6.
Finally, the third issue concerns the quantification of poverty. Several authors consider that the measurement of poverty should give information about the incidence, the intensity and the inequality of the problem.7 In this paper we only consider the
head-5
count ratio, calculated with and without different types of social transfers, in order to analyse the effect of social policy on child poverty, one of the two aims of this paper. To go further in the analysis of child poverty, we explore the incidence of poverty according to demographic and social attributes. The demographic breakdowns considered are: sex, age and family composition. The social breakdowns adopted are: parent’s profession category, number of worked hours on the main activity, employment sector and type of contract. These desegregations capture the impact of work issues on child poverty, the other aim of this paper.
Finally and in order to design the profile of child poverty in each of the four countries analyzed we use logit models to: evaluate the impact of the different demographic and social attributes on child poverty odds and, to seek for inter-country differences. This methodology reinforces the empirical analysis and enables inferential purposes, giving important insights to policy design.
Data used comes from the European Statistics on Income and Living Conditions - EU_SILC – for the period 2004-08 for Italy, Portugal, Poland and Spain. These data enables a portrait of child poverty and a discussion of social policies in South European countries and also in a new state member – Poland.
Our empirical analysis includes three stages: first we investigate child poverty trends according to the demographic attributes considered, then we apply this analysis to the social breakdowns adopted and finally, we analyse the profile of child poverty in the four countries trough econometric techniques.
Demographic attributes
Globally speaking, women seem to be more affected by poverty than man, except in Poland where the difference between the poverty headcount by sex is meaningless (table
6
1A8). This is also the case for children (see table 2A), except in Portugal where the proportion of poor boys is 30 per cent higher than the corresponding for girls. Nevertheless, gender seems not having impact on poverty incidence which does not mean that this difference does not exist in particular subpopulations9.
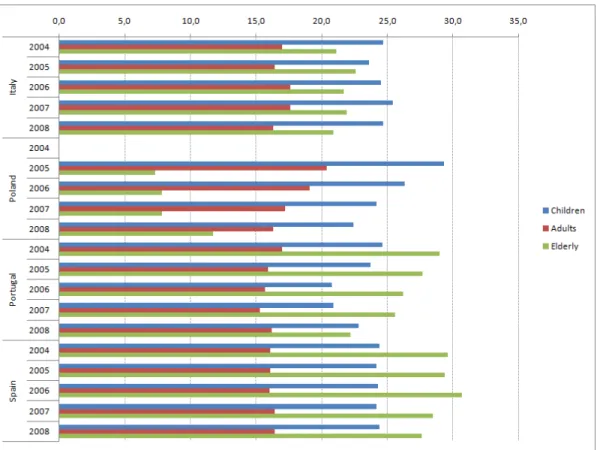
The analysis of poverty by age is very important in what concerns child poverty. In fact this analysis, by giving the relative position of children in terms of poverty, acts as the starting point in the investigation of the effect of work and public policies in poverty among children - the aim of this paper.
Figure 1 and table 2A, show important features of child poverty across the four countries under analysis, during the period 2004-08: children were particularly at risk in Poland, despite the positive evolution on child poverty rates, they were always the group with the highest incidence of poverty; this is also the case for Italy, despite the fact that incidence of child poverty did not vary significantly during this period; in Portugal and in Spain the elderly stand out, but in 2008 children were the most vulnerable group to poverty in Portugal, in line with the other two countries.
[figure 1, here]
Family dimension (see tables 1A and 2A) seems to be directly associated with poverty for all and especially for children, as the incidence of poverty grows with the number of individuals in the family. However one note should be made for one individual families: in all countries except in Poland they also experience significant rates of poverty which may suggest a different feature of this type of families in this countries compared to the South European analysed.
7
Concerning family composition, single parenthood families and families with two adults and three or more children stand out as the most vulnerable to poverty in all four countries. This is most significant within children which call for specific attention to these families in the context of child poverty.
Table 2A shows, on the one hand, that in 2005 this scenario was most significant un Poland than in the other three countries and, on the other hand, that in 2008 Spain was the country with the higher proportion of poor children in these typologies and also the country with the worst evolution of this indicator in these families.
Social attributes
According to the aims of this paper the social attributes considered are related to parent’s work context: profession’s category, number of worked hours, employment sector and type of contract. The first issue to be analyzed concerns the relation between unemployment and poverty in order to have a first glance on how social protection to unemployed persons was able to avoid poverty. As it would be expected the incidence of poverty is much higher within unemployment situations. However we should be aware for the fact that this is particularly truth for children in all the four countries. Although, with different magnitude.
Figure 2 and tables 3A and 4A clearly show two important findings: there had been a positive evolution of child poverty rates within families with unemployment problems in all the four countries despite the fact that in Italy and in Poland more than half of the children included in these families still poor in 2008. Does this mean that the social protection to unemployment is more effective in Portugal and in Spain? We will return to this question.
8 [figure 2, here]
With unemployment child poverty rates are high, but what happens in the opposite situations i.e. with full time employment? First, one important finding should be point out: the self-employed and in special the one without employees, show higher rates of poverty than the employee (tables 3A and 4A). This is particularly evident in Poland where the incidence of poverty of employees is less than half the corresponding for the self-employee. Is the importance of the public sector behind this result? Secondly it should be mentioned that being a full time employee seems to avoid less poverty for children as the incidence of child poverty is always higher than the corresponding for the whole population, especially in Spain. This result underlines the importance of employment in tackling the problem of child poverty.
If being employed is important in preventing poverty the number of working hours and the type of contract also matter (see tables 3A and 4A). Again this seems to be particularly important for children. In what concerns the number of working hours, the association with poverty rates is not linear. In fact, globally speaking, individuals with 45 or more working hours weekly show higher incidences of poverty, which may be explained by the kind of work and qualification level that they generally have. Nevertheless and in line with the previous conclusions within profession’s category, the common eight-hours-day-work seems to have the strongest impact in avoiding poverty which calls again for the importance of employment policies in combating poverty and, especially, child poverty.
Finally and also in line with the previous analysis, the type of contract also impacts on poverty incidence and, again, this is more important within children, in all the four
9
countries. Table 4A shows that temporary work is associated with higher rates in child poverty, especially in Poland and in Italy, despite the positive evolution of these rates between 2005 and 2008 which was not the case in Portugal and in Spain. May this trend be a signal of the economic crisis that deeply affects Portugal and Spain?
Child poverty profile
The first model estimated considers the pooled data for all years and all countries. This model gives a proxy of the covariates medium effects. The estimation results included in table5A show that there was no significant change in the model structure during the period observed, as the dummy variables associated to time are not statistically significant. According to coefficients and marginal effects estimates, child poverty probability odds are most strongly influenced by variables such as: parent’s profession category and family composition. Globally speaking children with full time employee parents are the less vulnerable to poverty. In this context it should be noted that children with unemployed parents are the most exposed to poverty. Concerning family composition the results obtain, in line with the descriptive analysis, found children in single parents families and families with two adults and three or more children as the most probably poor. Finally, one important finding should be underline, regarding country covariates: Spanish, Italian and Poland children have a smaller probability of being poor than Portuguese children. This is particularly true for Spain and than for Italy, and less significant for Poland.
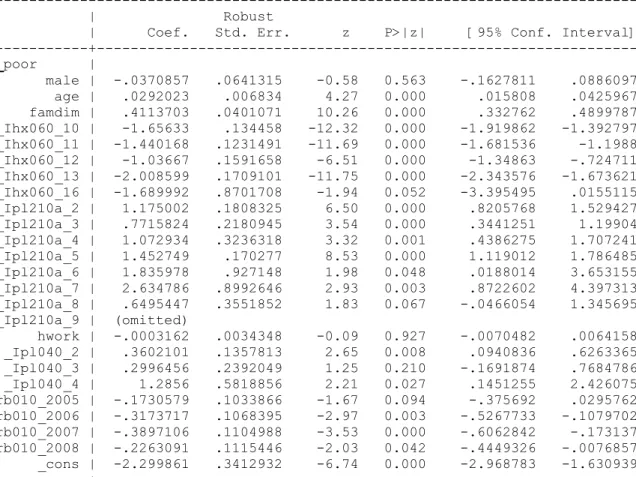
How do the demographic and social attributes act in the probability of a child to be poor in each country? Does their influence differ? To answer these questions we estimate logit models for each country and test coefficients equality. From the results in table6A
10
the strongest conclusion emerges that the impact of almost the covariates considered vary from country to country, which suggests an unequal profile of child poverty and, therefore, point out the need for different policies to tackle the problem.
The similarities are found for gender and age. In fact the hypothesis testing supports the equality of the coefficients for these variables in the four models, which suggest the same effect of them in child poverty odds for the countries analyzed.
The rule seems to be the differentiation of covariates impact. This is the case for the majority of variables included in the four models. We detail these differences for the following variables: (i) family dimension, (ii) family composition, (iii) parents profession’s category, (iv) parents working hours and (v) parents employment sector.
(i) Family dimension: the positive signal of the estimated coefficient is in line with the common conclusion about the direct relation between family dimension and child poverty. The estimated coefficients suggest a higher impact of this variable in Portugal and in Spain.
(ii) Family composition: in all the four countries single parent families and families with two adults and three or more children emerge as the most vulnerable to child poverty. However, according to the estimated models, in Italy and in Poland these two typologies seem not to be distinguished in terms of child poverty probabilities. Although this is not the case in Portugal and in Spain, the magnitude of the estimated coefficients also suggests a marginal differentiation for these typologies.
(iii) Parent’s profession category: in this context and globally speaking, unemployment seems to have one of the strongest impact on child poverty probability, especially in Italy and Poland. Working in partial time also seems
11
to have different effects on child poverty – in Poland we found the highest impact of this variable.
(iv) Number of working hours: despite the fact of non-statistical significance of this covariate in Portugal and in Italy, in the other two countries the magnitude of the corresponding coefficient suggests a marginal impact of this variable on the probability of a child to be poor.
(v) Employment sector: having family working parents seems to be a condition of child poverty vulnerability in all countries except in Italy. For the other sectors the effect on child poverty odds is in general not so high. In Poland, sectors as self-employed without employees and employee have the highest distinction to self-employed with employees in terms of child poverty probabilities which suggest a strongest protection from poverty for Polish children with such parents.
The coefficients differentiation might suggest a misleading picture of child poverty profile in the four countries. However it should be noted that the common model structure is in fact the most important result. The differences found in the impact of the covariates only derive from unequal policies compositions.
3. Government intervention: policies to ensure sufficient resources for families The current analysis is only focused on cash benefits which directly support household income, such as by providing income for those temporarily out of the market for example, unemployment and sickness benefits) or supplementing the income of households with children (universal or targeted benefits)10. As the data base, we used the Mutual Information System on Social Protection in the Member States of the
12
European Union (MISSOC)11. The information that is reported annually by the European Commission makes it possible to identify the main changes that have occurred in each county12.
Benefits target on family: maternity
The maternity benefit is granted by all coutries13. Some differences exist across countries in the way the benefit is design. Table 1 presents a summary of the institutional features and changes regarding qualifying conditions and amount of benefit.
[table 1, here]
Regarding eligibility and rate of benefit, we may conclude that protection granted by Poland is more generous over the period. The Spanish and Portuguese systems had shown a move towards a more restrictive protection.
Two means-tested benefits must be mentioned: a flat-rate benefit (maternity voucher) granted by the Italian system to non-working women and a prenatal allowance introduced in 2007, in Portugal, and open to pregnant women.
Benefits target on family: unemployment
Relating the institutional design of unemployment compensation, Portugal and Spain operated a dual system, i.e. a combination of an insurance scheme with an assistance scheme with means-tested while in Italy and Poland there is no special unemployment assistance scheme14.
13
In the insurance scheme, all coutries with the exception of Poland (means-tested and flat-rate benefit) use a replacement rate which is more generous in Spain15; in 2004, there was much diversity in the duration of payment, with Portugal having the most generous protection (from 12 to 30 months) and Italy and Poland the least (270 days and 6-12 months, respectively).
In the Portuguese and Spanish assistance schemes, the amount of benefits depends on the minimum wage. The rates of replacement (in 2004: 80 per cent and 75 per cent, respectively) were increased for the unemployed with dependants.
Over the period, some important changes have been introduced in three countries: i) the qualifying period has been reduced in Portugal (less restrictive eligibility); ii) the rates of replacement have been increased in Spain, specially for unemployed with dependant children (more generous entitlement) while the amount of benefits in the two assistance schemes became dependent on an indexing reference of social support instead of minimum wage (less generous entitlement); iii) the duration of payment has been increased in Poland and Portugal (more generous entitlement)16.
Benefits target on family: sickness
The four countries offer a compulsory social insurance scheme for employees with earnings-related benefits17.
With the exception of Poland (where the benefit corresponds to 80 per cent of the reference wage), the amount of the benefit is determined by applying variable percentages, depending on the length of incapacity, to the remuneration reference. In 2004, the Polish system had the most generous rate of replacement and Italy the least (50 per cent or 67 per cent).
14
Over the period, a new rate has been introduced in Portugal: 65 per cent (instead of 55-60 per cent) in case of incapacity period lower or equal to 90 days.
Benefits target on family: minimum income schemes
With the exception of Italy, all the countries have some form of minimum income schemes at a national level. The four countries can be divided into four groups (Frazier and Marlier, 2009): i) a relatively simple and comprehensive scheme open to all those with insufficient means to support themselves (Portugal); ii) a quite simple and categorical scheme with rather restricted eligibility and coverage of people in need of financial assistance (Poland); iii) a complex set of different, often categorical, schemes (Spain); iv) limited arrangements which is restricted to quite categories of people and not cover many of those in need (Italy)18.
Substantial differences exist across countries in the way minimum income schemes are design, namely the eligibility conditions, the indicator for establishing the level of payment, the amount of benefits and duration of payment (European Parliament, 2007, 2011; Frazier and Marlier, 2009)19. The large variation from country to country as well as the regional variations in Italy and Spain made quite impossible any cross-country comparison.
However, some assessment of the MI schemes can be made. Regarding coverage, the situation can be characterized as follows: fairly comprehensive in Portugal and Spain, partial in Poland and very limited in Italy (Frazer and Marlier, 2009:56). Additionally, the effectiveness of the four schemes on poverty reduction was very low in the beginning of the period (European Parliament, 2007). In Poland, this situation could
15
have been improved as a result of the social assistance reform of 2004 aimed to improve the income support throughout the amount and take-up of benefits.
In 2005, Portugal introduced two important changes in eligibility. First, the expansion of the right to benefits for individuals under 18 who are married or who have been living with a partner in situation comparable to marriage for at least one year. However, the availability for work become a more stringent requirement for all beneficiaries unemployed (before legislative change, the condition was only required for persons between 18 and 30).
Benefits target on children
During the period, new child allowances were implemented (Italy, Poland and Portugal). In the case of Poland, new regulations came into force in 2004 introducing means-tested benefits to replace universal child allowances. Table 2 identifies the benefits by country as well those that have been introduced over the period.
[table 2, here]
All the four countries provided a Child Benefit which is by far the most substantial cash benefit (EC, 2002). There some similar features, namely: i) with the exception of Portugal (16 years), the normal age limit is 18 years; ii) the existence of a ceiling income20. However, there are some differences related with the monthly amount and their variation with income (see table 3).
16
In Spain, Poland and Portugal, the monthly amount of allowance supplements for handicapped children and young people depends on the age of the children. There is no specific amount in Italy: the ceiling of the household income is increased if one member is disabled.
Another benefit is the birth grant, which is flat rate amount in Italy (for families with 3 children), Spain and Poland (per child). In Portugal there is no specific benefit: the household is entitled to the Child Benefit21.
With the exception of Spain, all the countries provide an allowance for single parents: in Poland, the amount per child varies according to the family’s income; in Italy and Portugal (granted since 2007), there is an increase in child benefits and related allowances.
Some countries provide other special allowances. In 2005, Italy introduced a Social Card: a flat rate benefit aimed to increase the purchasing power of persons with a dependent child of less than 3 years old, and whose annual income not exceed the amount fixed by law.
The Polish system provides also a child-raising benefit (flat rate amount paid during the parental leave, provided that monthly income per family member does not exceed 25 per cent of the average wage for the previous year) and a child-minding allowance (is a universal benefit paid to workers who have to stop working in order to look after a child).
Finally,Allowances for Studying are provided by Poland (universal benefits with fixed amount per child) and Portugal (ceiling income and fixed amount per child).
According to European Commission, an overall improvement in family welfare had been notice between 2004 and 2008. However, “the multitude of approaches makes it
17
harder to identify clear trends (EC, 2008b). Indeed, some countries (like Poland) improved the most important family benefits, while others (like Spain) were fundamentally restructuring and systematizing this field of protection. During the period, new benefits – target on family or child allowances - were implemented (Poland and Portugal). In the case of Poland, there was a move from universal child benefits towards target-specific benefit allocation, or means-tested allowances. In Portugal, the policy goal has been focused on economic support for vulnerable families.
4. Social transfers and poverty
At this stage we have already seen that children seem to be particularly at risk of poverty, no matter the four countries analyzed. What has been the impact of public policies, in particularly social transfers, on poverty? We will first analyze the effect of these transfers on poverty by country and then we carry on a comparative discussion of their relative performance.
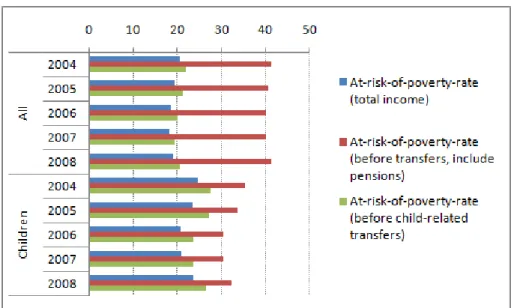
Italy
The first thing to be noticed is that social transfers have a smaller impact in reducing poverty within children than for all individuals, as figure 3 and table 7A show. Moreover, child-related transfers have a marginal effect in reducing child poverty incidence – around 15 per cent. This effect is quite the same during the period under study which may suggest a reduced effect of the policies undertaken to tackle child poverty.
18
Despite the different nature of pensions and, therefore, their expected higher impact in reducing poverty, the results obtained show that poverty rates after pensions decrease for around a half, which triples the effect of child-related transfers.
Taking into account that all transfers may impact on child poverty, the most outstanding result comes from the fact that, while poverty rates for all individuals fall around 60 per cent after social transfers, for children this decrease is only around 30 per cent. These results question the effectiveness of such transfers in child poverty, suggesting a review of the social policies carried on.
Poland
The results obtained for Poland concerning the incidence of poverty after social transfers, show an important effect of such transfers in reducing poverty. This reduction is around 62 per cent. However, this effect is smaller within children - it is situated around 42 per cent. Figure 4 and table 7A show that the impact of social transfers is almost the same in the period under study, which may suggest unchanging policies.
[figure 4, here]
The central question of analysis is: what was the effect of child-related transfers on child poverty? Table 7A shows that this effect was situated around 17 per cent in the last two years and around 11 per cent in the first two years, which means an
19
increase in this effect. Is this increase due to new policies? We will detail this next section.
Finally it is worth to note that pensions have an impact less than 50 per cent in decreasing poverty rates, which may be a consequence of their value.
Portugal
The first result to be mentioned concerns the fact that, despite the impact of social transfers in reducing poverty among all the age groups, it seems that this effect is relatively smaller for children (see figure 5 and table 7A). For them the reduction is around 30 per cent while for the whole population this proportion is situated around 50 per cent. This scenario applies to all years in the period under study which may suggest unchanged policies to tackle poverty.
[figure 5, here]
Child-related transfers allow a 10 per cent decrease in the risk of child poverty which is completely different from the effect of pensions, despite their different nature.
The results obtained point out the importance of developing specific programs to reduce child poverty, as the level and type of social transfers that have been applied so far seem to have a relatively effect in tackling this problem.
20
Spain
The most outstanding result from table 7A and figure 6 is the fact that child-related transfers have nearly no effect in reducing child poverty rates, all over the period under study. This result suggests total ineffectiveness of policies specifically developed to tackle child poverty. With almost one child in every four poor in the last two years, what policies were carried on?
Besides the previous result it should also be mentioned that in Spain as in the other three countries, social transfers have a bigger effect in reducing poverty rates for all the individuals than for children. In fact globally speaking social transfers promote a decrease of around 50 per cent on poverty incidence, value that is near 20 per cent in the case of children.
[figure 6, here]
Once again the results obtained question the policies undertaken to reduce child poverty rates and point out the need for a deep thinking about what has been done so far and what can be done to reduce child poverty.
The comparative analysis of the impact of social transfers on child poverty has two important similarities and two marginal differences.
The similarities: first, social transfers have a smaller effect on child poverty risk than on poverty risk for all individuals and secondly, the impact of child related transfers is less than one third of pension’s effect.
The differences: the most outstanding difference regards the importance of child related transfers on child poverty. In Poland these transfers allow a 17 per cent
21
reduction on child poverty rates in the last two years which is the greatest impact. In the opposite side is Spain where these transfers have almost no effect. Moreover Poland seems to have the more efficient package of social transfers.
5. Conclusions
In this concluding section we seek to discuss the interaction between the profile of child poverty in the four countries and the social policies undertaken to ensure sufficient resources for families, during the period of analysis. Throughout we endeavour to underline the importance of investigate the impact of social policy on child poverty, in order to optimize policies designed to tackle the problem.
The analysis of social transfers impact on child poverty carried on in the previous section showed that, globally speaking, the effect on poverty incidence for the whole population is higher than the corresponding for children. Moreover, child-related transfers seem to have a marginal effect in reducing child poverty rates.
In Poland these effects are strong, in line with the 2004 social assistance reform that improved the most important family benefits. This country has a more generous protection of maternity, of sickness and specific benefits targeted on children, such as child-raising benefit, child-minding allowance and allowances for studying.
Spain seems to appear on the opposite position: social transfers have the lowest effect in reducing poverty and, child-related transfers, have nearly no impact on child poverty. This situation is certainly a consequence of the reduced number / amount of family benefits referred in section 3.
The situation of Portugal in terms social transfers effectiveness is dual: the reductions of child poverty rates is not significant, in spite of the increasing of support for
families-at-22
risk. The analysis undertaken suggests the eligibility of target groups and the revision of the policies that have been used so far, despite the crisis that acts, by itself, as factor of poverty development.
Finally in Italy, the results obtained are in line with the other countries, showing a relative impact of social transfers on poverty rates. Is this result a consequence of a restrictive minimum income scheme, a small number / amount of family benefits, referred in section 3?
The estimated models point out the importance of labour market issues on child poverty odds. Italy and Poland showed the strongest impact of unemployment on these probabilities. The descriptive analysis showed that these countries have the highest incidence of child poverty within unemployment parents. These results are in line with the inexistence of specific unemployment assistance in these countries, as referred in section 3.
A more generous protection of unemployment and the reforms introduced in Portugal and in Spain during the period over study, discussed in section 3, are certainly the reasons for the lower rates of child poverty in the context of unemployment.
The results obtained point out the importance of designing measures to specific groups such as lone parent and large families and also to those with unemployment problems. For the later it should be noted that the existence of childcare infrastructures is also important. This was not tack into account in this paper because our analysis was strictly focused on social transfers.
The analysis undertaken in this paper is based on cross-section data. The use of longitudinal data would certainly improve this investigation and reinforce the conclusions. This constitutes our further step in this analysis.
23 Notes
1. In the EU reducing child poverty has been a target for all member states.Whiteford and Adema (2007:6) spread out this goal to OECD countries: “(…) in recent decades public policies in many OECD
countries have focused on the challenge of reducing child poverty.”
2. Griggs and Walker (2008) discuss these costs and point out the wider social implications of child poverty.
3.For a discussion on strategies to reduce child poverty see Whiteford and Adema (2007).
4. Sen (1999) and Townsend (1979) are important references concerning the definition and measurement of poverty.
5. For a discussion on this hypothesis, see Jenkins (2000). 6. This is also the threshold adopted by EUROSTAT.
7. The so-called three “i’s” of poverty. To a comprehensive discussion of this subject see, for example, Jenkins and Lambert (1998).
8. Tables with an “A” are in the Annex.
9. Bastos et al. (2009) investigate these differences for Portugal.
10. The universal benefits are granted to all families with children and often depend on the size of the family. The targeted benefits aimed to support the most vulnerable families (low income, lone parents, large families or families with disable children (EC, 2008a).
11. http://www.missoc.org.
12. This database was complemented by other sources (Eurostat, 2005, 2006, 2007, 2008; Baptista, 2007; Strati, 2007; Villagomez, 2007; Wóycicka, 2007)
13. A paternity benefit granted by all countries. The Portuguese system also provides employees and self-employed people with other four contributory benefits.
14. The accumulation with earnings from work is only possible in Spain: receiving total unemployment benefit is compatible with carrying out a part-time gainful activity as employee (assistance scheme: the earnings can not exceed 75 per cent of the minimum wage).
15. In Spain and Portugal, a maximum and a minimum amount are set; the Spanish system has a special feature, i.e. the minimum amount varies according to the number of dependent children.
16. In Portugal, the duration of payment has been only extended for older unemployed with longer contributory career.
24
17. In all countries, with the exception of Portugal, there is a statutory continuation of payment of wage by employers: i) Spain: 60 per cent of the wage from the 4th up to the 15th day of illness; ii) Italy: payment of wage for a maximum of 180 days per year; and iii) Poland: for the first 33 calendar days of illness in any calendar year the employer continues to pay 80 per cent of the reference wage per month.
18. Italy and Spain do not have a national minimum income scheme, but rather different regional arrangements.
19. The amount of benefit is usually analyzed throughout some specific issues, namely: the value of the minimum income for a single person, variations according to family composition.
20. The Italian system includes another condition: at least 70 per cent of the earnings must have its source in dependent
21. Over the period, Spain introduced a multiple birth grant which amount varies according to the number of children.
25 References
Baptista, I. (2007), Tackling child poverty and promoting the social inclusion of children. A study of National Policies: Portugal, Report on behalf of the European Commission
Eurostat (2008), Developments in Social Protection in 2007, MISSOC-INFO 01/2008, Luxembourg.
European Commission (2008a), “Thematic Study on policy measures concerning child poverty”, Policy Studies Findings – 10, Luxemburg.
European Commission (2008b), Child Poverty and Well-Being in the EU. Current status and way forward, Directorate-General for Employment, Social Affaires and Equal Opportunities, The Social Protection Committee.
Eurostat (2007), Evolution of the Social Protection in 2006, MISSOC-INFO 01/2007, Luxembourg.
Eurostat (2006), Evolution of the Social Protection in 2005, MISSOC-INFO 01/2006, Luxembourg.
Eurostat (2005), Evolution of the Social Protection in 2004, MISSOC-INFO 01/2005, Luxembourg.
European Commission (2002), “Family Benefits and Family Policies in Europe”, MISSOC –INFO 01/2001, Luxembourg.
European Parliament (2007, 2011), The role of the minimum income for social inclusion in the European Union, Directorate General for Internal Policies, Committee on Employment and Social Affaires, Brussels.
Frazer, H. and Marlier, E. (2009), Minimum Income Schemes across EU Member States, Synthesis Report, EU Network of National Independent Experts on Social Inclusion, on behalf of the European Commission.
26
Griggs, J. and Walker, R. (2008), The costs of child poverty for individuals and society. Joseph Rowntree Foundation.
Jenkins, S., Lambert, P. (1998), ‘Three ‘I's of poverty curves and poverty dominance: TIPs for poverty analysis’, Research on Economic Inequality, Vol. 8 pp.39 - 56. Sen, A. (1999), Development as Freedomm, New York: Random House.
Strati, F. (2007), Tackling child poverty and promoting the social inclusion of children. A study of National Policies: Italy, Report on behalf of the European Commission Townsend, P. (1979), Poverty in the United Kingdom: A Survey of Households
Resources and Standards of Living, Penguin Books, Harmondsworth.
Villagomez, E. (2007), Tackling child poverty and promoting the social inclusion of children. A study of National Policies: Spain, Report on behalf of the European Commission.
Whiteford, P. and Adema, Willem (2007); What Works Best in reducing Child Poverty? A Benefit or Work Strategie?, OECD Social, Employment and Migration Working Papers, n.51.
Wóycicka, I. (2007), Tackling child poverty and promoting the social inclusion of children. A study of National Policies: Poland, Report on behalf of the European Commission.
27 Figure 1. Incidence of child poverty by age
Source: EU_SILC (2004-2008)
Figure 2. Incidence of child poverty within unemployed parents
28
Figure 3. Incidence of poverty and social transfers - Italy
Source: EU_SILC (2004-2008).
Figure 4. Incidence of poverty and social transfers - Poland
29
Figure 5. Incidence of poverty and social transfers - Portugal
Source: EU_SILC (2004-2008).
Figure 6. Incidence of poverty and social transfers - Spain
30
Table 1. Maternity benefit: institutional changes over 2004-2008
Spain Italy Poland Portugal
Qualifying
conditions For workers over 26 years of age, the qualifying conditions (contributions paid for at least 6 months) have been restricted
No applicable No applicable Contributions paid for at least 6 months
Amount
of benefit No change (100% of reference wage) No change (80% of reference wage) No change (100% of reference wage) The amount (100% of reference wage) has been reduced (80%) when women opt for an extended leave.
Minimum amount: 50% of the minimum wage Source: MISSOC.
Table 2. Family Benefits 2004-2008
Spain Italy Poland Portugal
Child benefit
Allowances for children with disabilities Birth allowances
Allowance for single parents Since 2004 Since 2007 Child-raising and child-minding allowances
Allowances for studying Since 2004 Social Card Since 2005
Source: MISSOC.
Table 3: Child Benefit 2004 - 2008
Spain Italy Poland Portugal
Monthly amount
The amount depends on the age of child
The amount is in inverse function to the household income and in direct function to the family dimension
The amount become dependent on the age of child (in 2004, the amount was dependent on the number of children)
The amount depends on the reference income (based on income and family dimension) and the age of the child. Variation
with income
The ceiling is increased from the fourth child (in 2004: from the 2nd
child)
Yes No There are six earning
levels dependent on national minimum wage
31 Annex
Table 1A - Incidence of poverty by demographic attributes – all
(percentage)Indicators 2004 2005 2006 2007 2008 IT PL PT SP IT PL PT SP IT PL PT SP IT PL PT SP IT PL PT SP Sex Male 17.7 na 19.2 19.0 17.0 21.3 18.7 18.5 18.0 19.7 17.7 18.5 18.4 17.6 17.2 18.6 17.1 17.0 17.9 18.3 Female 20.5 na 21.6 20.8 20.5 19.9 20.1 20.9 21.1 18.5 19.1 21.2 21.2 17.1 19.0 20.9 20.1 16.7 19.0 21.0 Age group 0-17 (children) 24.7 na 24.6 24.4 23.6 29.3 23.7 24.2 24.5 26.3 20.8 24.3 25.4 24.2 20.9 24.2 24.7 22.4 22.8 24.4 18-64 (Adults) 17.0 na 17.0 16.1 16.4 20.4 15.9 16.1 17.6 19.1 15.7 16.0 17.6 17.2 15.3 16.4 16.3 16.3 16.2 16.4 +65 (Elderly) 21.1 na 29.0 29.6 22.6 7.3 27.7 29.4 21.7 7.8 26.2 30.7 21.9 7.8 25.6 28.5 20.9 11.7 22.2 27.6 Family dimension 1 individual 28.1 na 35.0 38.7 27.9 16.5 37.1 30.4 27.5 16.1 34.9 34.9 27.3 15.6 33.2 34.6 26.3 20.3 30.8 31.7 2 individuals 15.8 na 23.9 21.7 15.6 11.8 22.5 20.2 15.5 11.2 23.0 20.5 16.1 10.7 22.6 19.1 15.0 10.4 20.3 20.4 3 individuals 13.7 na 14.0 14.8 14.1 16.1 13.7 15.8 14.6 13.5 13.3 14.9 13.5 14.0 12.5 15.6 13.7 12.6 14.5 14.7 4 individuals 19.5 na 19.2 18.5 18.4 20.5 17.8 18.7 19.9 19.4 16.0 18.9 20.3 16.5 14.5 19.1 18.7 15.3 16.2 17.9 5 individuals 24.6 na 22.1 19.4 26.0 27.9 19.7 18.6 28.5 26.2 17.2 20.9 31.0 22.4 20.2 17.7 28.8 20.6 17.8 24.8 6 individuals 32.3 na 24.9 23.4 28.6 28.3 20.8 19.6 31.8 26.6 24.5 24.2 34.6 22.6 26.5 25.7 27.6 25.1 35.2 39.2 + 6 individuals 35.7 na 35.7 37.2 28.1 36.8 37.0 46.0 39.1 35.1 29.3 56.0 43.1 32.8 36.3 67.5 29.4 30.3 25.6 48.7 Family composition Single adult 28.1 na 35.0 38.7 27.9 16.4 37.1 34.0 27.5 16.0 34.9 34.9 27.3 15.6 33.2 34.6 26.3 20.3 30.8 31.7
Two adults without children, both < 65 11.8 na 16.2 12.4 9.7 13.5 15.2 10.6 11.3 13.7 18.3 10.3 11.0 12.0 17.6 11.3 10.6 11.2 16.5 12.1 Two adults without children (at least one adult > 65) 17.6 na 30.2 29.8 19.5 6.3 28.3 29.2 18.3 6.2 25.9 30.2 18.9 6.2 24.6 27.2 17.0 7.6 21.8 29.6 Other households without children 9.4 na 11.5 11.2 9.2 13.8 8.8 13.2 8.9 11.7 9.5 12.1 10.6 9.8 9.4 12.2 8.9 9.1 7.4 10.8 Single adult with 1+ children 35.8 na 34.8 40.3 35.4 40.1 31.5 37.3 31.9 31.6 41.2 37.6 31.2 31.0 33.6 34.1 35.6 30.2 38.9 38.2 Two adults with one single child 14.0 na 12.8 14.3 15.1 16.6 14.7 14.4 17.7 14.2 12.1 14.9 14.8 15.3 12.2 16.4 15.2 13.9 16.5 15.5 Two adults with 2 children 23.1 na 24.0 24.3 21.4 22.9 23.7 22.8 22.1 21.4 18.6 22.1 23.0 19.7 17.0 22.3 21.6 17.9 20.6 21.8 Two adults with 3+ children 35.7 na 41.0 38.2 34.5 44.8 42.0 35.9 40.8 37.7 37.8 41.8 41.2 36.2 43.3 36.8 37.7 34.4 31.9 44.4 Other households with 1+ children 20.5 na 17.5 21.0 21.1 22.5 14.9 18.4 23.0 23.6 15.8 20.4 23.1 19.5 16.5 20.0 20.2 19.8 17.8 21.6
32
Table 2A - Incidence of poverty by demographic attributes – Children
(percentage)Indicators 2004 2005 2006 2007 2008 IT PL PT SP IT PL PT SP IT PL PT SP IT PL PT SP IT PL PT SP Sex Male 24.3 na 22.9 25.8 22.8 28.6 22.7 24.7 24.2 25.3 20.7 23.9 25.7 22.3 21.6 23.8 24.9 21.8 25.6 23.5 Female 24.6 na 26.2 23.1 24.4 29.9 23.9 23.8 24.8 27.3 20.2 24.4 25.0 25.8 20.2 23.7 25.0 22.9 19.7 24.8 Family dimension 2 individuals 28.1 na 25.3 33.8 21.7 32.9 24.9 38.9 20.3 25.5 33.3 35.7 27.3 31.4 22.8 25.7 28.3 22.8 36.6 35.3 3 individuals 18.0 na 15.0 16.1 18.6 20.4 16.6 15.5 18.9 17.8 15.9 17.0 16.2 17.8 13.8 16.7 27.0 15.0 17.0 16.6 4 individuals 23.0 na 24.2 24.0 22.0 23.6 21.5 23.1 22.7 22.1 18.4 21.9 24.1 20.2 17.8 22.7 22.8 18.0 21.0 21.8 5 individuals 30.3 na 28.6 29.7 30.5 33.6 28.8 27.2 34.4 29.7 24.5 32.2 37.3 25.6 27.6 27.4 34.1 23.6 22.7 36.4 6 individuals 39.5 na 38.2 38.0 36.0 35.3 30.0 29.0 39.1 30.8 36.5 34.2 34.7 27.5 38.1 32.1 33.2 32.6 55.3 50.9 + 6 individuals 33.8 na 48.2 46.9 34.9 43.0 52.0 56.2 39.6 40.5 36.2 67.6 46.8 36.8 53.5 77.3 32.9 34.0 37.5 61.5 Family composition
Single adult with 1+ children 37.6 na 43.8 43.1 36.3 47.7 35.2 44.1 34.5 37.4 48.2 39.7 34.0 39.0 40.7 40.7 39.6 35.2 42.5 46.9 Two adults with one single child 14.4 na 11.8 13.3 14.7 17.2 14.0 12.9 16.9 15.6 11.8 14.5 13.9 15.2 11.4 14.8 16.3 12.9 14.3 14.6 Two adults with 2 children 23.0 na 24.9 24.2 21.5 23.1 22.6 22.9 21.8 21.7 17.9 21.7 23.5 19.8 17.3 22.2 22.0 17.9 20.2 21.6 Two adults with 3+ children 35.9 na 43.6 39.9 35.4 47.3 43.2 38.9 38.9 38.9 37.6 44.6 41.6 36.6 47.7 40.2 38.4 33.8 34.1 46.4 Other households with 1+ children 22.8 na 21.2 25.0 24.0 25.1 20.4 23.1 26.7 26.0 18.9 26.4 27.1 22.2 20.5 26.2 24.6 22.4 24.3 30.1
33
Table 3A - Incidence of poverty by social attributes – all
(percentage)Indicators 2004 2005 2006 2007 2008
IT PL PT SP IT PL PT SP IT PL PT SP IT PL PT SP IT PL PT SP Profession category
Employee (full time) 9.8 na 20.2 9.5 10.3 11.0 11.2 8.6 11.7 9.9 8.2 8.9 12.3 10.3 9.2 9.1 11.1 9.8 10.0 8.8
Employee (part time) 29.4 na 24.1 19.2 27.9 24.9 28.6 17.4 31.6 19.0 35.1 17.6 32.6 11.9 33.7 14.2 33.8 11.6 38.9 15.5
Self-employed (full-time) 21.8 na 21.3 36.4 19.9 34.0 27.3 35.1 21.4 32.8 25.7 31.1 20.3 28.9 18.6 34.8 18.7 29.4 28.2 35.5 Self-employed (part-time) 23.5 na 13.9 25.3 26.0 35.3 26.8 31.0 32.3 35.7 32.4 34.3 28.5 37.0 35.2 41.8 30.7 39.7 30.0 20.4
Unemployed 63.9 na 35.4 42.5 64.5 57.3 29.9 38.9 59.0 63.2 22.8 44.3 60.3 56.4 40.9 39.7 60.7 50.6 36.5 36.7
Retired 14.9 na 20.0 23.8 15.6 15.7 23.7 25.1 15.8 9.9. 46.1 24.6 15.4 8.0 33.4 31.9 14.6 10.8 20.5 20.9
Other inactive 34.4 na 19.5 29.8 35.8 39.7 42.5 29.3 34.9 28.8 43.4 32.7 38.7 28.5 43.0 33.4 36.5 30.3 41.1 34.5
Number of worked hours
until 10 hours 13.4 na 19.9 29.9 12.6 25.8 12.8 34.0 15.1 20.1 12.7 43.1 14.6 22.5 11.6 20.9 13.5 39.4 13.2 21.1
35 – 40 hours 12.8 na 17.4 11.6 13.3 14.5 15.8 11.3 12.3 12.6 10.9 10.2 14.0 13.2 11.1 10.9 13.1 13.2 12.1 10.6
40 – 45 hours 18.6 na 24.4 15.4 18.7 16.5 18.0 16.0 18.8 19.1 13.2 16.5 21.0 15.5 10.8 15. 18.8 13.8 14.4 13.9
Employment sector
self-employed with employees 19.4 na 18.6 32.8 15.4 19.4 23.6 31.2 18.7 17.0 20.0 31.1 16.2 18.4 14.7 30.8 16.8 16.5 18.6 37.0 self-employed without employees 27.5 na 20.2 35.1 29.5 35.5 32.6 35.1 28.9 35.1 35.0 30.5 29.0 30.0 32.3 32.9 27.0 31.0 34.8 31.3
employee 15.1 na 20.6 16.0 15.3 17.1 15.3 14.8 15.7 15.4 14.0 15.3 16.1 14.3 14.9 15.1 14.9 13.7 14.7 15.2
family worker 26.9 na 15.9 31.7 19.6 26.9 75.9 39.3 27.0 36.5 59.1 38.3 23.0 30.4 48.1 37.4 23.6 32.1 59.4 44.6
Type of contract
permanent job/work contract of unlimited duration 11.9 na 20.4 10.9 12.4 14.3 13.3 10.3 12.0 12.1 12.0 10.4 13.0 11.4 12.6 10.5 11.9 11.3 12.6 9.7 temporary job/work contract of limited duration 39.5 na 23.1 31.6 38.7 33.0 29.1 28.0 42.6 32.9 26.9 30.4 40.2 29.0 29.0 29.6 37.8 25.7 27.4 30.8
34
Table 4A - Incidence of poverty by social attributes – Children
(percentage)Indicators 2004 2005 2006 2007 2008
IT PL PT SP IT PL PT SP IT PL PT SP IT PL PT SP IT PL PT SP
Profession category
Employee (full time) 12.6 na 22.4 15.1 13.8 15.7 16.3 14.7 15.8 13.2 12.3 15.3 16.9 14.2 14.3 14.7 16.5 13.4 13.0 14.2
Employee (part time) 35.8 na 27.6 27.0 32.8 37.8 49.2 23.0 36.9 34.0 41.9 22.9 36.5 15.8 52.5 18.9 40.2 18.3 61.3 19.1
Self-employed (full-time) 30.4 na 24.2 45.1 25.0 40.9 35.6 44.1 27.6 40.5 30.9 40.0 27.3 33.6 17.2 40.6 25.6 35.2 36.3 46.3 Self-employed (part-time) 33.3 na 25.8 35.7 45.2 53.1 36.2 40.4 48.5 57.9 20.8 40.5 40.0 56.3 46.4 44.6 46.7 59.7 43.4 22.7
Unemployed 72.9 na 48.9 48.9 74.8 65.7 38.2 48.0 65.5 67.9 48.5 51.5 69.4 64.5 52.2 48.8 68.6 50.3 43.0 42.2
Retired 17.7 na 27.2 32.0 20.4 31.9 27.1 32.9 2.1 22.8 25.3 35.2 23.3 14.3 37.2 30.8 22.3 17.0 36.9 26.0
Other inactive 48.5 na 20.8 37.8 52.5 54.7 58.4 36.7 46.7 44.9 55.0 41.0 54.6 46.3 56.2 42.3 57.0 45.8 58.6 45.3
Number of worked hours
until 10 hours 17.9 na 22.8 39.8 17.1 39.6 18.5 40.3 19.3 53.7 17.4 49.4 20.3 41.6 15.6 28.1 19.4 77.2 18.2 32.6
35 – 40 hours 15.1 na 20.4 17.3 14.8 19.6 22.2 17.4 14.4 16.6 15.5 15.3 17.6 17.6 11.9 15.1 16.4 17.6 14.6 15.2
40 – 45 hours 24.4 na 28.4 23.9 23.8 21.0 21.2 24.9 22.3 22.5 14.9 31.3 25.4 20.2 10.5 24.4 25.2 16.0 15.0 17.3
Employment sector
self-employed with employees 24.9 na 23.6 38.9 20.6 26.3 27.2 42.1 24.6 23.2 18.8 34.6 20.3 24.5 14.7 35.5 21.1 20.3 20.5 49.6 self-employed without employees 36.8 na 23.0 46.4 35.5 45.6 39.1 41.3 34.2 46.8 38.9 39.9 36.2 37.7 29.7 38.9 35.1 39.9 45.4 40.4
employee 19.7 na 25.1 20.4 20.3 25.6 20.0 19.8 21.0 21.2 17.8 20.5 22.1 20.5 19.5 19.6 21.4 18.2 19.3 19.4
family worker 33.3 na 19.6 36.8 18.1 38.2 79.1 59.3 23.9 63.1 82.9 49.7 19.4 45.3 79.9 51.8 22.1 38.6 78.8 73.5
Type of contract
permanent job/work contract of unlimited duration 15.4 na 24.8 13.2 15.9 21.1 17.1 13.2 14.7 15.6 15.4 13.1 16.8 15.9 16.3 13.1 17.2 15.2 15.9 11.1 temporary job/work contract of limited duration 49.1 na 27.8 39.0 49.5 42.1 36.9 35.4 56.9 41.6 31.8 39.9 53.1 37.2 33.9 37.3 47.2 29.7 34.8 38.1
35
Table 5A – Estimation results and marginal effects (I)
Logistic regression Number of obs = 98660 Wald chi2(27) = 9894.22 Prob > chi2 = 0.0000 Log pseudolikelihood = -44728.515 Pseudo R2 = 0.1114 --- | Robust
poor | Coef. Std. Err. z P>|z| [95% Conf. Interval] ---+--- male | -.0311839 .0168131 -1.85 0.064 -.0641371 .0017692 age | .0185588 .0017706 10.48 0.000 .0150885 .022029 famdim | .2491685 .0104236 23.90 0.000 .2287386 .2695984 _Ihx060_10 | -1.07891 .039799 -27.11 0.000 -1.156914 -1.000905 _Ihx060_11 | -.7682355 .0357484 -21.49 0.000 -.838301 -.6981699 _Ihx060_12 | -.2593207 .0442129 -5.87 0.000 -.3459764 -.172665 _Ihx060_13 | -1.173652 .048958 -23.97 0.000 -1.269608 -1.077696 _Ihx060_16 | -.8722801 .1168368 -7.47 0.000 -1.101276 -.6432841 _Ipl210a_2 | 1.032018 .0419935 24.58 0.000 .9497123 1.114324 _Ipl210a_3 | .9707316 .0509258 19.06 0.000 .8709189 1.070544 _Ipl210a_4 | 1.5729 .0741296 21.22 0.000 1.427609 1.718192 _Ipl210a_5 | 2.010571 .040268 49.93 0.000 1.931647 2.089495 _Ipl210a_6 | .5990043 .1620523 3.70 0.000 .2813877 .9166208 _Ipl210a_7 | 1.397756 .324691 4.30 0.000 .7613729 2.034138 _Ipl210a_8 | 1.74526 .06028 28.95 0.000 1.627114 1.863407 _Ipl210a_9 | 1.806513 1.227883 1.47 0.141 -.6000929 4.21312 hwork | .0070141 .0008868 7.91 0.000 .005276 .0087522 _Ipl040_2 | .6388605 .033198 19.24 0.000 .5737936 .7039274 _Ipl040_3 | .3715601 .0564555 6.58 0.000 .2609094 .4822108 _Ipl040_4 | .5292176 .0863181 6.13 0.000 .3600371 .6983981 _Irb010_2005 | .0197185 .0287503 0.69 0.493 -.0366311 .0760681 _Irb010_2006 | .006806 .0292388 0.23 0.816 -.050501 .064113 _Irb010_2007 | -.0325119 .0296936 -1.09 0.274 -.0907104 .0256866 _Irb010_2008 | .0171938 .0296102 0.58 0.561 -.0408412 .0752288 _Irb020_2 | -.3328023 .0219556 -15.16 0.000 -.3758345 -.2897701 _Irb020_3 | -.1519088 .0240372 -6.32 0.000 -.1990208 -.1047967 _Irb020_4 | -.0364047 .0362916 -1.00 0.316 -.107535 .0347255 _cons | -2.839136 .0870164 -32.63 0.000 -3.009685 -2.668587 ---
36
Marginal effects after logit
y = Pr(poor) (predict) = .17945293
--- variable | dy/dx Std. Err. z P>|z| [ 95% C.I. ] X ---+--- male*| -.0045927 .00248 -1.85 0.064 -.009447 .000261 .509639 age | .0027328 .00026 10.50 0.000 .002223 .003243 8.28971 famdim | .03669 .00154 23.79 0.000 .033667 .039713 4.26589 _Ihx0~10*| -.127091 .00363 -35.01 0.000 -.134206 -.119976 .18057 _Ihx0~11*| -.109358 .00492 -22.21 0.000 -.119008 -.099708 .425147 _Ihx0~12*| -.0361675 .00583 -6.20 0.000 -.047594 -.024741 .17688 _Ihx0~13*| -.1328717 .00414 -32.09 0.000 -.140986 -.124757 .155818 _Ihx0~16*| -.0959974 .00905 -10.61 0.000 -.113728 -.078266 .004926 _Ipl21~2*| .1976035 .00963 20.52 0.000 .178732 .216475 .035871 _Ipl21~3*| .1678937 .01001 16.78 0.000 .148281 .187507 .220008 _Ipl21~4*| .3316271 .01838 18.04 0.000 .295595 .367659 .013055 _Ipl21~5*| .4349157 .00943 46.12 0.000 .416432 .4534 .03134 _Ipl21~6*| .1052132 .03296 3.19 0.001 .040621 .169805 .002281 _Ipl21~7*| .2899358 .08084 3.59 0.000 .131486 .448386 .000517 _Ipl21~8*| .3741523 .01478 25.31 0.000 .345178 .403126 .013937 _Ipl21~9*| .3916698 .30075 1.30 0.193 -.197795 .981135 .00003 hwork | .0010328 .00013 7.90 0.000 .000777 .001289 42.9509 _Ipl04~2*| .1073576 .00625 17.17 0.000 .095103 .119613 .159112 _Ipl04~3*| .051505 .00735 7.01 0.000 .037096 .065914 .752311 _Ipl04~4*| .0910742 .01697 5.37 0.000 .057813 .124336 .00824 _Ir~2005*| .0029135 .00426 0.68 0.494 -.005441 .011268 .229759 _Ir~2006*| .0010034 .00432 0.23 0.816 -.007456 .009463 .213268 _Ir~2007*| -.0047579 .00432 -1.10 0.271 -.013221 .003706 .203923 _Ir~2008*| .0025402 .00439 0.58 0.563 -.006062 .011143 .198378 _Irb02~2*| -.0479749 .00309 -15.55 0.000 -.054022 -.041928 .398307 _Irb02~3*| -.0218917 .00339 -6.46 0.000 -.028529 -.015254 .2791 _Irb02~4*| -.0053069 .00524 -1.01 0.311 -.01557 .004957 .069755 ---
37
Table 6A – Estimation results (II)
Simultaneous results for PT, ES, IT, PL
Number of obs = 98660 --- | Robust
| Coef. Std. Err. z P>|z| [95% Conf. Interval] ---+--- PT_poor | male | -.0370857 .0641315 -0.58 0.563 -.1627811 .0886097 age | .0292023 .006834 4.27 0.000 .015808 .0425967 famdim | .4113703 .0401071 10.26 0.000 .332762 .4899787 _Ihx060_10 | -1.65633 .134458 -12.32 0.000 -1.919862 -1.392797 _Ihx060_11 | -1.440168 .1231491 -11.69 0.000 -1.681536 -1.1988 _Ihx060_12 | -1.03667 .1591658 -6.51 0.000 -1.34863 -.724711 _Ihx060_13 | -2.008599 .1709101 -11.75 0.000 -2.343576 -1.673621 _Ihx060_16 | -1.689992 .8701708 -1.94 0.052 -3.395495 .0155115 _Ipl210a_2 | 1.175002 .1808325 6.50 0.000 .8205768 1.529427 _Ipl210a_3 | .7715824 .2180945 3.54 0.000 .3441251 1.19904 _Ipl210a_4 | 1.072934 .3236318 3.32 0.001 .4386275 1.707241 _Ipl210a_5 | 1.452749 .170277 8.53 0.000 1.119012 1.786485 _Ipl210a_6 | 1.835978 .927148 1.98 0.048 .0188014 3.653155 _Ipl210a_7 | 2.634786 .8992646 2.93 0.003 .8722602 4.397313 _Ipl210a_8 | .6495447 .3551852 1.83 0.067 -.0466054 1.345695 _Ipl210a_9 | (omitted) hwork | -.0003162 .0034348 -0.09 0.927 -.0070482 .0064158 _Ipl040_2 | .3602101 .1357813 2.65 0.008 .0940836 .6263365 _Ipl040_3 | .2996456 .2392049 1.25 0.210 -.1691874 .7684786 _Ipl040_4 | 1.2856 .5818856 2.21 0.027 .1451255 2.426075 _Irb010_2005 | -.1730579 .1033866 -1.67 0.094 -.375692 .0295762 _Irb010_2006 | -.3173717 .1068395 -2.97 0.003 -.5267733 -.1079702 _Irb010_2007 | -.3897106 .1104988 -3.53 0.000 -.6062842 -.173137 _Irb010_2008 | -.2263091 .1115446 -2.03 0.042 -.4449326 -.0076857 _cons | -2.299861 .3412932 -6.74 0.000 -2.968783 -1.630939 ---+---
38
--- | Robust
| Coef. Std. Err. z P>|z| [95% Conf. Interval] ---+--- ES_poor | male | .0114381 .0335132 0.34 0.733 -.0542465 .0771227 age | .0241305 .003572 6.76 0.000 .0171296 .0311315 famdim | .4807674 .0314972 15.26 0.000 .4190339 .5425008 _Ihx060_10 | -1.355222 .0817737 -16.57 0.000 -1.515495 -1.194948 _Ihx060_11 | -1.265784 .0773494 -16.36 0.000 -1.417386 -1.114181 _Ihx060_12 | -1.011248 .1068659 -9.46 0.000 -1.220702 -.801795 _Ihx060_13 | -1.809844 .1131304 -16.00 0.000 -2.031576 -1.588113 _Ihx060_16 | -2.550681 .3416688 -7.47 0.000 -3.22034 -1.881023 _Ipl210a_2 | .7924324 .0785528 10.09 0.000 .6384717 .946393 _Ipl210a_3 | 1.417274 .1209424 11.72 0.000 1.180231 1.654317 _Ipl210a_4 | 1.44932 .1840295 7.88 0.000 1.088629 1.810011 _Ipl210a_5 | 1.553527 .0751464 20.67 0.000 1.406243 1.700812 _Ipl210a_6 | .9403643 .8006741 1.17 0.240 -.6289281 2.509657 _Ipl210a_7 | -.1969672 .8783334 -0.22 0.823 -1.918469 1.524535 _Ipl210a_8 | 1.182713 .1400723 8.44 0.000 .9081763 1.45725 _Ipl210a_9 | (omitted) hwork | .0130123 .0017889 7.27 0.000 .0095062 .0165185 _Ipl040_2 | .3562414 .067935 5.24 0.000 .2230912 .4893916 _Ipl040_3 | .1087047 .1287083 0.84 0.398 -.1435589 .3609682 _Ipl040_4 | 1.266005 .2984647 4.24 0.000 .6810248 1.850985 _Irb010_2005 | -.0996429 .0511009 -1.95 0.051 -.1997989 .0005131 _Irb010_2006 | .0453313 .0518131 0.87 0.382 -.0562205 .1468831 _Irb010_2007 | -.0745382 .0533313 -1.40 0.162 -.1790656 .0299891 _Irb010_2008 | -.0259296 .0529518 -0.49 0.624 -.1297133 .0778541 _cons | -3.433336 .1977507 -17.36 0.000 -3.820921 -3.045752 ---+---
39
--- | Robust
| Coef. Std. Err. z P>|z| [95% Conf. Interval] ---+--- IT_poor | male | -.0132918 .0279562 -0.48 0.634 -.0680849 .0415013 age | .0152988 .0029592 5.17 0.000 .0094988 .0210988 famdim | .1588771 .0247545 6.42 0.000 .1103593 .207395 _Ihx060_10 | -.9876554 .0621254 -15.90 0.000 -1.109419 -.8658919 _Ihx060_11 | -.5334186 .0610542 -8.74 0.000 -.6530827 -.4137545 _Ihx060_12 | .0769224 .0833927 0.92 0.356 -.0865243 .2403692 _Ihx060_13 | -.634718 .0922376 -6.88 0.000 -.8155005 -.4539356 _Ihx060_16 | (omitted) _Ipl210a_2 | 1.24015 .0636508 19.48 0.000 1.115397 1.364903 _Ipl210a_3 | .7719956 .0808785 9.55 0.000 .6134768 .9305145 _Ipl210a_4 | 1.247505 .130215 9.58 0.000 .9922879 1.502721 _Ipl210a_5 | 2.498159 .0795373 31.41 0.000 2.342269 2.654049 _Ipl210a_6 | .8972793 .3262742 2.75 0.006 .2577937 1.536765 _Ipl210a_7 | 3.276674 .6411001 5.11 0.000 2.02014 4.533207 _Ipl210a_8 | 2.001163 .0872802 22.93 0.000 1.830097 2.172229 _Ipl210a_9 | (omitted) hwork | .0018664 .0016042 1.16 0.245 -.0012778 .0050105 _Ipl040_2 | .6931329 .0512182 13.53 0.000 .592747 .7935188 _Ipl040_3 | .43658 .08887 4.91 0.000 .262398 .610762 _Ipl040_4 | .3142345 .1392243 2.26 0.024 .0413598 .5871092 _Irb010_2005 | .0512585 .04372 1.17 0.241 -.0344311 .1369481 _Irb010_2006 | .0539124 .0438544 1.23 0.219 -.0320405 .1398654 _Irb010_2007 | .0861212 .0437904 1.97 0.049 .0002935 .1719488 _Irb010_2008 | .1059197 .0436718 2.43 0.015 .0203245 .1915149 _cons | -2.875609 .1470695 -19.55 0.000 -3.16386 -2.587358 ---+---
40
--- | Robust
| Coef. Std. Err. z P>|z| [95% Conf. Interval] ---+--- PL_poor | male | -.0910232 .0306427 -2.97 0.003 -.1510818 -.0309645 age | .0112903 .0032142 3.51 0.000 .0049906 .0175899 famdim | .2115151 .013848 15.27 0.000 .1843736 .2386567 _Ihx060_10 | -.6920433 .0821145 -8.43 0.000 -.8529848 -.5311019 _Ihx060_11 | -.4789113 .0719322 -6.66 0.000 -.6198959 -.3379268 _Ihx060_12 | .0112507 .0799559 0.14 0.888 -.1454599 .1679613 _Ihx060_13 | -1.088214 .0855824 -12.72 0.000 -1.255952 -.9204751 _Ihx060_16 | -.3027823 .1475032 -2.05 0.040 -.5918832 -.0136814 _Ipl210a_2 | 1.039004 .0962157 10.80 0.000 .8504248 1.227584 _Ipl210a_3 | 1.232145 .0878029 14.03 0.000 1.060055 1.404236 _Ipl210a_4 | 2.056136 .119096 17.26 0.000 1.822713 2.28956 _Ipl210a_5 | 2.14853 .0642126 33.46 0.000 2.022675 2.274384 _Ipl210a_6 | .6382943 .1927514 3.31 0.001 .2605084 1.01608 _Ipl210a_7 | 1.047532 .4936751 2.12 0.034 .079947 2.015118 _Ipl210a_8 | 1.850331 .1124009 16.46 0.000 1.630029 2.070633 _Ipl210a_9 | 1.670456 1.173542 1.42 0.155 -.629644 3.970555 hwork | .0073172 .0015351 4.77 0.000 .0043084 .0103259 _Ipl040_2 | .9823698 .0736193 13.34 0.000 .8380786 1.126661 _Ipl040_3 | .8403594 .1062301 7.91 0.000 .6321523 1.048567 _Ipl040_4 | 1.040615 .1456888 7.14 0.000 .7550702 1.32616 _Irb010_2005 | .0483745 .0430901 1.12 0.262 -.0360805 .1328295 _Irb010_2006 | -.0359051 .0443476 -0.81 0.418 -.1228249 .0510147 _Irb010_2007 | -.0823181 .0460329 -1.79 0.074 -.172541 .0079048 _Irb010_2008 | (omitted) _cons | -3.443455 .1525781 -22.57 0.000 -3.742502 -3.144407 Variables description:
. sex – Male=1 . age . famdim – family dimension . Ihx060- family composition
. Ipl210a – parent’s profession category . hwork- number of worked hours in the main activity
41
Table 7A - At-Risk-of-Poverty Rates after and before social transfers: Whole population and Children
(percentage)
Indicators 2004 2005 2006 2007 2008
IT PL PT SP IT PL PT SP IT PL PT SP IT PL PT SP IT PL PT SP
Average Equivalized Disposable Income
(modified OECD scale) 15810 na 8853 10292 16664 3039 9377 11881 16638 3704 9522 12609 17213 4149 9886 12966 18088 4938 10173 14535
Poverty line (as 60%of the EDI national
median) 8119 na 4147 5169 8607 1520 4312 6143 8712 1867 4378 6652 9003 2101 4519 6800 9583 2942 4827 7753
ALL (percentage)
At-risk-of-poverty-rate (total
income) 19.1 na 20.5 20.4 18.8 20.6 19.4 20.5 19.6 19.1 18.6 20.4 19.8 17.3 18.1 19.9 18.2 16.9 19.1 19.6
At-risk-of-poverty-rate (before
transfers, include pensions) 42.7 na 41.4 38.8 42.8 50.8 40.7 38.7 42.2 49.1 40.3 38.4 43.4 47.1 40.1 40.4 43.3 44.1 41.3 38.3
At-risk-of-poverty-rate (before
transfers, except pensions) 23.6 na 26.5 24.5 23.4 29.8 25.7 24.7 24.0 28.6 25.4 24.3 24.1 26.5 24.3 24.0 22.6 25.1 24.6 24.1
At-risk-of-poverty-rate (before child-related transfers) 21.0 na 21.9 20.8 20.8 22.9 21.1 20.6 21.7 21.6 20.0 20.5 21.6 20.3 19.4 20.0 19.8 19.7 20.6 19.9 CHILDREN (percentage) At-risk-of-poverty-rate (total income) 24.5 na 24.5 21.9 23.5 29.2 23.3 23.8 24.5 26.3 20.8 23.9 25.4 24.0 20.9 24.2 22.6 22.3 23.5 24.1 At-risk-of-poverty-rate (before
transfers, include pensions) 33.1 na 35.5 28.6 32.6 45.5 33.7 31.1 33.7 43.0 30.4 29.9 34.2 41.2 30.3 31.2 31.6 38.0 32.2 30.1
At-risk-of-poverty-rate (before
ransfers, except pensions) 30.7 na 31.7 26.2 30.7 38.8 30.5 28.1 31.8 36.3 27.7 28.0 32.3 34.3 27.3 28.3 29.1 32.4 29.3 28.6
At-risk-of-poverty-rate (before
child-related transfers) 28.6 na 27.5 22.8 27.9 33.9 27.1 24.1 29.4 31.8 23.6 24.1 29.7 30.6 23.5 24.5 26.2 28.8 26.5 24.6