ISSN 1722-4667
Vulnerability to Poverty in select Central Asian
Countries
*Raghbendra Jha, Tu Dang
The Arndt-Corden Division of Economics, RSPAS, College of Asia and the Pacific, ANU
Abstract
In the extant literature either income or consumption expenditures as measured over short periods of time have been regarded as a proxy for the material well-being of households. However, economists have long recognized that a household’s sense of well-being depends not just on its average income or expenditures, but also on the risks it faces and its ability to deal with these risks. Hence vulnerability is a more satisfactory measure of welfare. In this study we used the concept of vulnerability as expected poverty to assess the household vulnerability to poverty in four Central Asian countries: Azerbaijan, Kazakhstan, Kyrgyzstan, and Tajikistan. Except for Tajikistan, headcount poverty and vulnerability rates are significantly different. We also find that vulnerability differs significantly across households by location and selected household characteristics. In this paper we use a simple empirical measurement that allows estimating the headcount vulnerability to poverty using cross-section data. This measurement is based on the strong assumption that households have the same conditional distribution of consumption in a stationary environment. While this approach cannot capture all dimensions of vulnerability, it at least begins to raise the policy issue that vulnerability should be considered alongside poverty.
JEL codes: C21, C23, I32, O57
Keywords: Poverty, Vulnerability, Cross-section data, Central Asia
1. Introduction
In the extant literature either income or consumption expenditures, as measured over short periods of time (say a year), has been regarded as a proxy for the material well-being of households. However, economists have long recognized that, under the assumption that a household is risk averse, its sense of well-being depends not just on its average income or expenditures, but also on the risks it faces. Thus the concept of vulnerability extends the notion of poverty to include idiosyncratic as well as aggregate risks. It is defined as the probability or risk today of being in poverty or to fall deeper into poverty in the future.
Although they are different concepts, Holzmann and Jørgensen (2001) argue that poverty and vulnerability are closely related due to two established facts: (i) the poor are typically most exposed to diverse risks, and (ii) the poor have the fewest instruments to deal with these risks. However, we should be concerned about vulnerability because if policymakers design poverty alleviation policies in the current year on the basis of a poverty threshold of income or consumption in the previous year, ‘the poor’ who receive income support may have already escaped from poverty and ‘the non-poor’ who do not receive such support may have slipped into poverty due to various unanticipated shocks (e.g. increase in the relative price of food, or an illness incapacitating the main bread winner). Therefore, assessing vulnerability helps to distinguish between ex-ante poverty prevention interventions and ex-post poverty alleviation interventions. Moreover, analysing vulnerability allows us to investigate the sources and forms of risks households face, which helps to design appropriate safety net programs to reduce or mitigate risk, hence vulnerability to poverty. To deal with temporary poverty we can give poor households aid but to address vulnerability we need strategies like prevention, mitigation and coping arrangements (informal, market-based, and public).1
Because poverty is normally defined as income or consumption being below a given level, income or consumption dynamics and variability can be proxies for vulnerability. This suggests three measurements of vulnerability: vulnerability as expected poverty (VEP), vulnerability as expected utility (VEU) and vulnerability as inability to insure consumptions. The main purpose of this paper is to assess VEP in the Central Asian region. Because data for other countries in this region were not available we study four countries: Azerbaijan, Kazakhstan, Kyrgyzstan and Tajikistan. Interest in economic conditions in Central Asian countries has recently grown for at least three reasons (Dowling and Wignaraja, 2006). First, the Central Asian region is rich in natural resources. Second, it has a strategic geographic position between Europe and Asia. Third, the Central Asian countries are former Soviet republics which followed socialist-oriented economic policies and are now reforming towards market-socialist-oriented policies. This last reason is particularly relevant in the context of poverty and vulnerability analysis because the transition process in Central Asian countries from centrally planned to market economies has exacerbated the incidence of poverty and income inequality (Heller and Keller, 2001, Bandara et al. 2004/05).
Vulnerability in developing countries in general, and transition ones in particular, would differ from that of developed countries because of several reasons. First, financial markets in developing and transition countries are considered to be less efficient than those in developed countries so the poor in developing/transition countries have fewer market-based instruments like insurance to handle idiosyncratic risks. Second, social insurance programs such as those relating to unemployment, old-age, work injury, disability, widowhood, and sickness are hardly established in developing/transition countries. Third, empirical vulnerability assessment ideally requires panel data which is rarely available in developing/transition countries.
The plan of this paper is as follows. Section II discusses some definitional and measurement issues relating to vulnerability. Section III lays out strategies to measure vulnerability as expected poverty for the Central Asian countries using cross-section data is available. Section IV briefly reviews the economic and poverty situation in these
countries. Section V analyses estimation results for assessing vulnerability to poverty. Section VI concludes the paper.
2. Measurements of vulnerability
Different measures of vulnerability have different data requirements. We review these below.
2.1 Vulnerability as expected poverty (VEP)
As expected, poverty vulnerability is measured as that probability that consumption (or income) will fall or remain below the poverty line (Christiaensen, 2000, Chaudhuri et al. 2002).2 This measure is particularly useful when, as in the case of the
four countries being considered here, only cross-section data are available. Vulnerability as expected poverty (VEP) of household (or individual) i at time t is defined by
i t z i t i t i t c c f z c VEP 1 0 1 1 d ) ( ) ) Pr( + + +
∫
= ≤ = (1) where i tc+1
is the per capita consumption (or income) of household i at time 1
+
t , f is consumption distribution of the household and z is the per capita expenditure (or income) requirement defined as the poverty line. A household (or individual) is then considered as vulnerable to poverty if its VEP is larger than a probability threshold level p:
⎩ ⎨ ⎧ ≤ > = p VEP p VEP V i i i if 0 if 1
where, Vi is a binary variable indicating whether household i is vulnerable or not. So, while VEP is a probability (between zero and one), being vulnerable is a state indicating the probability that the household’s consumption is below the poverty line. In practice, the most common threshold for VEP is 0.5 which indicates that a household whose VEP exceeds 50% is more likely than not to end up being poor and can thus be considered to be vulnerable to poverty. This threshold has the advantage that if a household is just at the poverty line and expects a mean zero shock it has vulnerability to poverty of 0.5 (Pritchett et al., 2000).
who are currently poor and those who are permanently poor and so ‘could help by preventative measures before adverse events are realized’ (Kamanou and Morduch, 2005, p. 164).
2.2 Vulnerability as expected utility (VEU)
The VEU measurement takes into account the fact that individuals are risk-averse so that expected utility falls as the uncertainty of income increases. Thus, vulnerability is defined by Ligon and Schechter (2003) as the utility lost due to risk, as the difference between the expected household consumption and the certainty-equivalent consumption.3 With this approach, the utility function can be decomposed into two
distinct components measuring vulnerability: poverty and risk (aggregate and idiosyncratic risk). Thus, analysis of vulnerability helps to investigate sources and forms of risks households face. This helps to design appropriate safety net programs to reduce or mitigate risk, hence vulnerability.
However, for this measurement the data requirements are too high to be of much practical use here. Not only are utility function unobservable, but there are just a handful of longitudinal data sets from low-income countries with an adequate time dimension to yield precise measures of household-specific consumption variability. (Kamanou and Morduch, 2004, p. 162)
2.3 Vulnerability as inability to insure consumption
Vulnerability can also be defined as the households’ inability to smooth (insure) consumption, while preserving a minimum level of assets, when faced with income shocks. Under this approach, vulnerability is tantamount to consumption volatility. More precisely, household vulnerability is the conditional covariance between changes in household consumption and changes in income, subject to an asset constraint (Holzmann et al., 2003, Holzman and Jørgensen, 1999). In this context Gaiha and Imai (2006) study three India villages and consider a household to be more vulnerable if the effect of income shocks (idiosyncratic and covariate shocks) on consumption is greater. Like the VEU, this measurement also requires panel data to determine factors that underlie consumption variability.
3. Empirical strategy toward measuring VEP
Ideally, for VEP measurement, with a panel data of sufficient length we can directly estimate the distribution f of the household’s consumption in (1). However, panel data are typically not available, especially in developing countries like the Central Asian countries being studied here. In practice, cross-sectional data can be used to estimate vulnerability, as a second-best solution (Chaudhuri, 2003; Chaudhuri et al., 2002). Using the cross-section data for estimating vulnerability is based on the strong assumption that the environment is stationary so that the current cross-sectional variance can be used to estimate the variance in the future. While the current
sectional variance can explain the part of future variance due to idiosyncratic shocks, the impact of aggregate shocks will be missed. Therefore, the model can produce good estimates of vulnerability only for situations where the distributions of risks, and the risk-management instruments, are similar from one period to another.
Chaudhuri (2003) and Chaudhuri et al. (2002) assume further that the household’s consumption is conditionally log-normally distributed.4 Thus, vulnerability of household
i at time t is estimated by
⎟⎟ ⎠ ⎞ ⎜⎜ ⎝ ⎛ − Φ = + i i t i t c z VEP σ 1 ln ln
where Φ is the cumulative log-normal distribution function. Log-normal distributions are completed determined by two parameters: mean and variance. The conditional mean and variance of a household’s future consumption can be estimated by the following heteroscedasticity regressions:
i i i i i i e X X c + = + = θ σ ε β ε2 ln } (2)
where Xi presents a bundle of observed house household characteristics, such as
the number of household members or the proportion of children. ‘So if we are able to generate predicted probabilities of poverty for households with different sets of characteristics (which some but not all poverty assessments attempt), we will have, in effect, estimates of the vulnerability of these households’ (Chaudhuri et al., 2002, p. 3)
4. Economic and poverty situation in the Central Asian countries
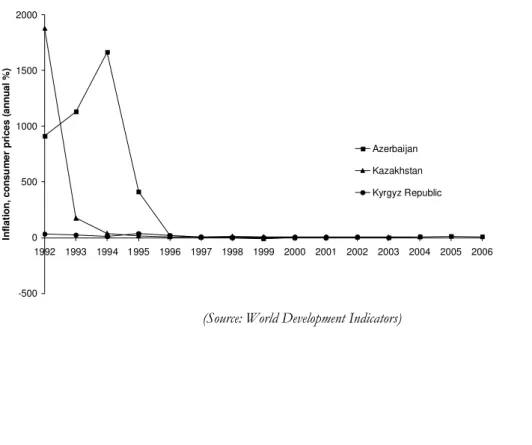
After gaining independence in 1991, the Central Asian countries initiated a transition to market economies resulting in severe economic hardships for most of the population. The sharp output declines along with hyper-inflation resulting from price liberalization and the monetization of large fiscal deficits led to significant increases in poverty (Bandara et al., 2004/05). Since 1995, the Central Asian countries have pursued anti-inflation policies and initiated macroeconomic reforms which led to economic recovery and greater price stability (see Table 1 and Figures 1 and 2). As a result, the incidence of poverty in Central Asia decreased, especially in Kazakhstan. The incidence of poverty reached 68% in Armenia in 1995, 35% in Kazakhstan in 1996, 48% in Kyrgyzstan in 2001, and 75% in Tajikistan in 1999. The poverty rates then decreased to
50% in Azerbaijan in 2001, 15% in Kazakhstan in 2002, 43% in Kyrgyzstan in 2005 and 62% in Tajikistan in 2005 (Table 2).
Table 1: Select development indicators in four countries of Central Asia, 2006
GDP per capita (constant 2000 US$)
GDP growth (annual %)
Life expectancy at birth (years)
Population growth (annual %)
Urban population (% of total)
Azerbaijan 1,571 34.5 72.3 1.1 51.6
Kazakhstan 2,166 10.7 66.2 1.1 57.6
Kyrgyz
Republic 326 2.7 67.7 0.9 36.0
Tajikistan 247 7.0 66.5 1.4 24.6
Source: World Development Indicators (The World Bank)
Table 2: Percentage of the population below the national poverty line
in select countries of Central Asia, 1995–2005
1995 1996 1999 2001 2002 2003 2005
Azerbaijan 68 .. .. 50 .. .. ..
Kazakhstan .. 35 .. 18 15 .. ..
Kyrgyz Republic .. .. .. 48 .. 50 43
Tajikistan .. .. 75 .. .. 64* 62**
Figure 1: GDP growth in select countries of Central Asia, 1986–2006 -40 -30 -20 -10 0 10 20 30 40
1986 1987 1988 1989 1990 1991 1992 1993 1994 1995 1996 1997 1998 1999 2000 2001 2002 2003 2004 2005 2006
G D P gr ow th ( a nnu al % ) Azerbaijan Kazakhstan Kyrgyz Republic Tajikistan
(Source: World Development Indicators)
Figure 2: Inflation in select countries of Central Asia, 1986–2006
-500 0 500 1000 1500 2000
1992 1993 1994 1995 1996 1997 1998 1999 2000 2001 2002 2003 2004 2005 2006
Inf la ti on , c ons u m e r pr ic e s ( a nnua l % ) Azerbaijan Kazakhstan Kyrgyz Republic
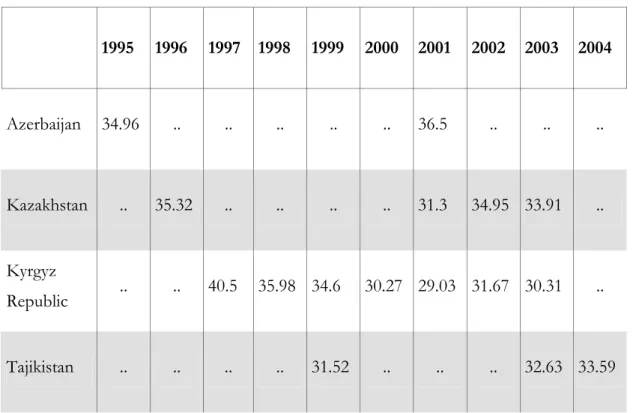
However, the transition to a market economy also increased income inequality within these countries. The Gini coefficients increased from their 1995 levels in all countries except Kyrgyzstan (Table 3). In Azerbaijan, for instance, the value of the Gini coefficient increased from 34.96 in 1995 to 36.5 in 2001. In Kazakhstan, the Gini coefficient was 35.32 in 1996 and came down to 31.3 in 2001 but it went up to 34.95 in 2000 and 33.91 in 2003. In Tajikistan, the Gini coefficient went up to 33.59 in 2004 from only 31.52 in 1999. Obviously, worsening income equality had a negative impact on the poverty situation in these countries.
Table 3: Gini coefficient in select countries of Central Asia, 1995–2004
1995 1996 1997 1998 1999 2000 2001 2002 2003 2004
Azerbaijan 34.96 .. .. .. .. .. 36.5 .. .. ..
Kazakhstan .. 35.32 .. .. .. .. 31.3 34.95 33.91 ..
Kyrgyz
Republic .. .. 40.5 35.98 34.6 30.27 29.03 31.67 30.31 ..
Tajikistan .. .. .. .. 31.52 .. .. .. 32.63 33.59
Source: World Development Indicators (The World Bank)
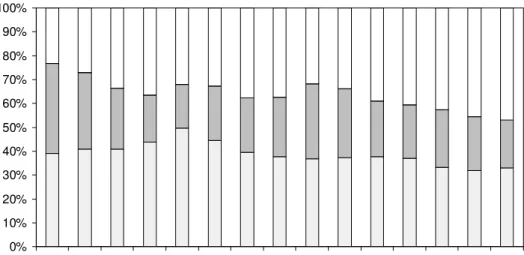
Figure 3: Economic structure of countries of Central Asia, 1992–2006
Azerbaijan
0% 20% 40% 60% 80% 100%
1992 1993 1994 1995 1996 1997 1998 1999 2000 2001 2002 2003 2004 2005 2006 Agriculture Industry Services
Kazakhstan
0% 20% 40% 60% 80% 100%
Figure 3: Economic structure of countries of Central Asia, 1992–2006
Kyzykstan
0% 10% 20% 30% 40% 50% 60% 70% 80% 90% 100%
1992 1993 1994 1995 1996 1997 1998 1999 2000 2001 2002 2003 2004 2005 2006 Agriculture Industry Services
Tajikistan
0% 20% 40% 60% 80% 100%
5. Estimation results
5.1 Data
5.1.1 Data for Azerbaijan
The data for Azerbaijan are from the 1995 Azerbaijan Survey of Living Conditions (ASLC). This survey applies many of the features of LSMS surveys, developed by the World Bank, to provide data for assessing poverty. It covers all of the topics covered in most LSMS surveys but contains far fewer questions, and therefore, less detail. The survey includes questionnaires at the individual, household and population point (community) levels.
The survey covered a sample of 2016 households. Three separate populations were covered: households in Baku (capital), households outside of Baku and households of Internally Displaced Persons (IDPs). The sample design included 408 households in Baku, 1200 households outside of Baku, and 408 households among IDP. Within each of those populations, the sample was chosen in such a manner that each household had an equal probability of being selected. Weighting factors are provided to account for the difference between the population and sample distributions. The regional areas covered by the sample included: i) South west from Baku, site of many displaced persons camps; ii) Far northwest; iii) Center north; iv) Naxichevan autonomous region, separated from the rest of Azerbaijan the southwest; v) The far south coastal area along the Caspian and Iranian border, vi) The area in the near northwest of Baku; vii) The central region near the occupied territory; and viii) The Apsheron peninsula and other large urban areas.
The poverty line is not available but the food-only poverty line is. The food-only poverty line used was developed by the government, based on an average daily intake of 2,360 calories (adjusted for age and gender). Thus, our analysis is based on food expenditure only.
5.1.2 Data for Kazakhstan
The 1996 Kazakhstan Living Standard Measurement Survey of the World Bank (Kazakhstan LSMS) covered a sample of 1995 households. The survey presents five regions: the central, the southern, the western, the northern, and the eastern; and three types of location: urban, poselki (villages of a city type) and rural. The poverty rate in 1996 was 34.6% at a government-defined subsistence minimum of Tenge (T) 2,861 per capita per month.
5.1.3 Data for Kyrgyzstan
including home production, as well as economic activities in agricultural and non-agricultural sectors. For each household member, individual level data on health, education, migration and labour was collected using household questionnaires. Community questionnaires were used to collect price data and the presence of social services and infrastructure in the community (population point) where the sampled household is located.
5.1.4 Data for Tajikistan
The data for Tajikistan are from the 2000 Tajikistan Living Standards Survey (TLSS) which was conducted jointly by the State Statistical Agency, the Center for Strategic Studies, the United Nations Development Programme (UNDP) and the World Bank (WB). The purpose of the survey is to provide data at the individual, household and community level for investigating issues of welfare and living standards of the population of the Republic of Tajikistan in 1999.
The 2000 TLSS contained 2,000 households with 14,142 individuals. Households were randomly selected over 125 population points, which were stratified across urban and rural areas within oblasts, to ensure a nationally representative sample. In the first stage 125 primary sample units (PSU) were selected with the probability of selection within strata being proportional to size. At the second stage, 16 households were selected within each PSU, with each household in the area having the same probability of being chosen. The two-stage procedure has the advantage that it provides a self-weighted sample.
5.2 Determinants of vulnerability
Based on the empirical strategy described in Section 3, we estimated the coefficients on the different determinants of the ex ante mean and variance of future consumption (per capita) as specified by (2). The estimated results, i.e. the relative importance of different factors to vulnerability, are presented in Table 4 for all countries. In Table 4 we include a set of common explanatory variables for expectation and variance of consumption for all four countries. Tables 5 and 6 present results for Azerbaijan and Kazakhstan5 respectively. Tables 7 and 8 present results on Kyrgyzstan
and Tajikistan respectively.
Except for Kazakhstan, urban households tend to have significantly higher expectation of future consumption compared with rural households. However, there is no clear indication of whether households in urban or rural areas have the higher variance of consumption.
Controlling for all other determinants, large household size tends to reduce the future consumption of the household, thereby increasing household vulnerability. It is well-known that, ceteris paribus, households with many children are on average poorer than households with fewer children. However, this negative effect weakens with the household size because the coefficient on size squared is positive and significant. Except
in Kazakhstan, larger household size is also associated with a significant decrease in the variance of consumption (see Christiaensen and Subbarao, 2005 and Christansen and Boisvert, 2002 for possible reasons for this result).
Table 4 also shows that the variable head of household has an important role in determining household vulnerability in these countries. Indeed, after controlling for all other characteristics, male headed households are associated with significantly higher means of future consumption. This can be explained by the fact men engage in more wage-generating activities and also get paid more than women. We don’t find a clear effect of age of household head on household vulnerability. For instance, in Azerbaijan and Kazakhstan a household with an older head tends to have a significantly lower expectation of future consumption. In contrast, in Kyrgyzstan, a household with an older head has a significant and higher expectation of future income and food consumption. However, this effect is not significant for total consumption in Kyrgyzstan and Tajikistan. Our results also confirm that enhanced education of household head significantly reduces the household’s vulnerability by increasing expectation of future consumption, but its effect on the variability of consumption is not statically significant.
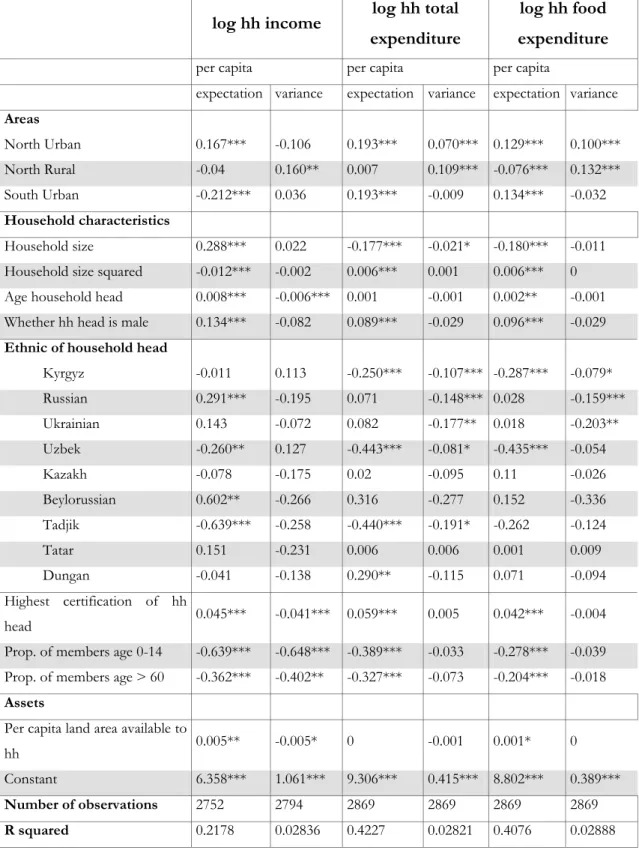
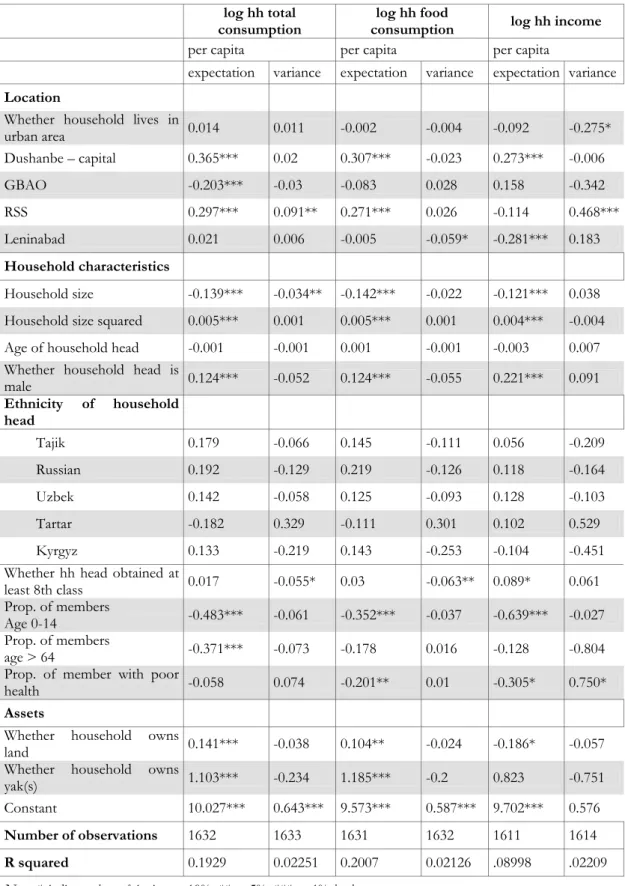
We also model the effect of ethnicity of household head on household vulnerability in Kyrgyzstan. In Kyrgyzstan, households which are headed by a person of Russian ethnicity have a significantly higher expectation of income and lower variance of total and food consumption and households with heads who are Kyrgyz have significantly lower expectation of total and food expenditure. However, we don’t find a significant evidence of the impact of ethnicity on consumption and income in Tajikistan.
In general, we find that the larger the dependency ratio (defined as the proportion of household members who are (typically) younger than 16 or older than 60) the larger is the household’s vulnerability, as manifested by a significantly lower expectation of future consumption.
Although over the past several years the Central Asia countries have enjoyed strong economic growth, they still have high unemployment (ESCAP, 2004). Indeed, we find that in Azerbaijan households the higher the proportion of income earners in the household the higher the expectation of future consumption. Unemployment in Central Asia may be due to the slow speed of privatization and creation of small and medium enterprises (SMEs), as well as the lack of industrial reform and dynamism in the agricultural sector. The problems of unemployment were compounded by low unemployment benefits and inadequate employment and training services.
Obviously, possession of assets leads to an increase in the expectation of future consumption. First, assets like land or agriculture properties provide a means for households to obtain income, thereby increasing consumption, on average. In addition, assets provide a secure source of income in the face of negative shocks to income. In Azerbaijan, Kazakhstan, and Tajikistan, ownership of land has a significant and sizable effect on mean of future consumption. However, we don’t find significant impact of house ownership on vulnerability in Kazakhstan. This may be due to the fact that a household cannot sell their house, at least in the short run, to reduce income shocks but can sell land and other properties. In Kyrgyzstan, the larger the per capita landholding the (significantly) higher the household mean of future income and food expenditure.
Kazakhstan, value of durables also has a positive and significant effect on mean and negative effect on variance of future consumption, thus reducing household’s vulnerability. In Tajikistan, the possession of yaks also enhances future consumptions (total and food).
For Kazakhstan, our results confirm that the availability of public transport reduces household vulnerability by increasing average consumption. A reason for this is that public transport helps farmers deliver their goods to urban markets better.
Table 4: Determinants of expectation and variance of consumption
in select Central Asian countries
Azerbaijan Kazakhstan Kyrgyzstan Tajikistan
Variable Expectation Variance Expectation Variance Expectation Variance Expectation Variance
Rural - (*) + +
(***) +
(*) - (***) us - -
Household Size - (***) - (**) - (***) + - (***) - (*) - (***) -
(**)
Household size squared + (***) + (**) +
(***) -
+ (***) +
+
(***) +
Whether hh head is male + (***) + + (*) - +
(***) -
+ (***) -
Age of hh head - (***) 0 - (***) - + - - -
Education of hh head + (*) + +
(***) -
+
(***) + + - (*)
Dependence ratio - (***) + - (***) us - (***) - - (***) - Whether hh owns (uses)
land + (***) -
+
(***) - 0 -
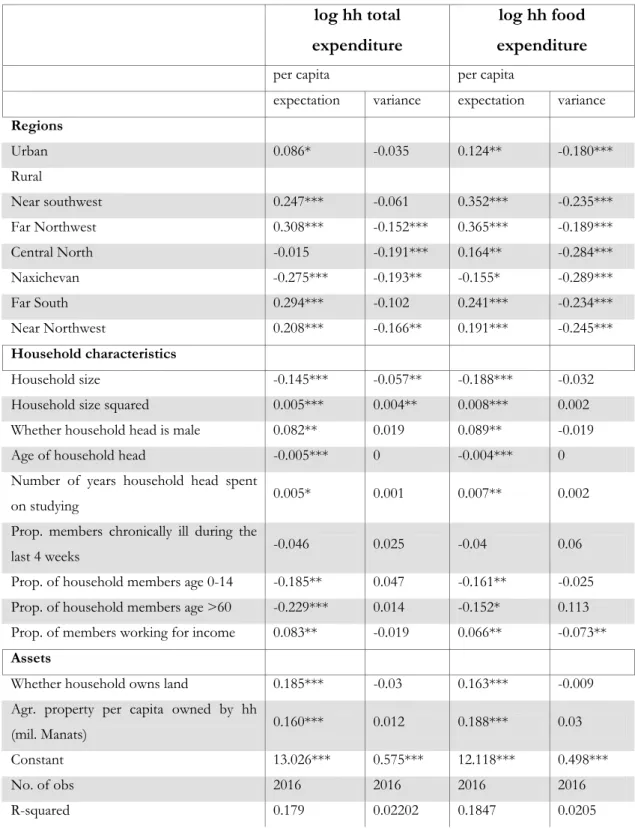
Table 5: Determinants of vulnerability in Azerbaijan
log hh total expenditure
log hh food expenditure
per capita per capita
expectation variance expectation variance Regions
Urban 0.086* -0.035 0.124** -0.180***
Rural
Near southwest 0.247*** -0.061 0.352*** -0.235***
Far Northwest 0.308*** -0.152*** 0.365*** -0.189***
Central North -0.015 -0.191*** 0.164** -0.284***
Naxichevan -0.275*** -0.193** -0.155* -0.289***
Far South 0.294*** -0.102 0.241*** -0.234***
Near Northwest 0.208*** -0.166** 0.191*** -0.245***
Household characteristics
Household size -0.145*** -0.057** -0.188*** -0.032
Household size squared 0.005*** 0.004** 0.008*** 0.002
Whether household head is male 0.082** 0.019 0.089** -0.019
Age of household head -0.005*** 0 -0.004*** 0
Number of years household head spent
on studying 0.005* 0.001 0.007** 0.002
Prop. members chronically ill during the
last 4 weeks -0.046 0.025 -0.04 0.06
Prop. of household members age 0-14 -0.185** 0.047 -0.161** -0.025 Prop. of household members age >60 -0.229*** 0.014 -0.152* 0.113
Prop. of members working for income 0.083** -0.019 0.066** -0.073** Assets
Whether household owns land 0.185*** -0.03 0.163*** -0.009
Agr. property per capita owned by hh
(mil. Manats) 0.160*** 0.012 0.188*** 0.03
Constant 13.026*** 0.575*** 12.118*** 0.498***
No. of obs 2016 2016 2016 2016
R-squared 0.179 0.02202 0.1847 0.0205
Table 6: Determinants of vulnerability in Kazakhstan
Log total consumption per capita
expectation variance
Areas
Urban -0.129*** -0.047*
Poselki -0.168*** -0.086**
Regions
Central -0.042 0.084***
Southern -0.420*** 0.019
Western 0.099** 0.040
Northern 0.254*** -0.048
Household characteristics
Household size -0.223*** 0.009 Household size squared 0.011*** -0.003 Age of household head -0.004*** -0.001 Whether household head is male 0.051* -0.016 Education degree of household head 0.024*** -0.006 Prop. of children (<=15) -0.360*** 0.080 Prop. of old (>=60) -0.206*** -0.014 Prop. of members who have good or normal health 0.078* 0.004
Assets
Whether household owns house 0.037 -0.048 Log total value of durables in the household 0.030*** -0.016*** Whether household has the use of any private plot 0.272*** -0.030
Community
Whether public transport goes through 0.127*** 0.004 Constant 11.052*** 0.561***
Number of observations 1940 1941
R-squared 0.3625 0.03483
Table 7: Determinants of vulnerability in Kyrgyzstan
log hh income log hh total expenditure
log hh food expenditure
per capita per capita per capita
expectation variance expectation variance expectation variance
Areas
North Urban 0.167*** -0.106 0.193*** 0.070*** 0.129*** 0.100*** North Rural -0.04 0.160** 0.007 0.109*** -0.076*** 0.132***
South Urban -0.212*** 0.036 0.193*** -0.009 0.134*** -0.032
Household characteristics
Household size 0.288*** 0.022 -0.177*** -0.021* -0.180*** -0.011 Household size squared -0.012*** -0.002 0.006*** 0.001 0.006*** 0 Age household head 0.008*** -0.006*** 0.001 -0.001 0.002** -0.001 Whether hh head is male 0.134*** -0.082 0.089*** -0.029 0.096*** -0.029 Ethnic of household head
Kyrgyz -0.011 0.113 -0.250*** -0.107*** -0.287*** -0.079*
Russian 0.291*** -0.195 0.071 -0.148*** 0.028 -0.159***
Ukrainian 0.143 -0.072 0.082 -0.177** 0.018 -0.203**
Uzbek -0.260** 0.127 -0.443*** -0.081* -0.435*** -0.054
Kazakh -0.078 -0.175 0.02 -0.095 0.11 -0.026
Beylorussian 0.602** -0.266 0.316 -0.277 0.152 -0.336
Tadjik -0.639*** -0.258 -0.440*** -0.191* -0.262 -0.124
Tatar 0.151 -0.231 0.006 0.006 0.001 0.009
Dungan -0.041 -0.138 0.290** -0.115 0.071 -0.094
Highest certification of hh
head 0.045*** -0.041*** 0.059*** 0.005 0.042*** -0.004
Prop. of members age 0-14 -0.639*** -0.648*** -0.389*** -0.033 -0.278*** -0.039 Prop. of members age > 60 -0.362*** -0.402** -0.327*** -0.073 -0.204*** -0.018 Assets
Per capita land area available to
hh 0.005** -0.005* 0 -0.001 0.001* 0
Constant 6.358*** 1.061*** 9.306*** 0.415*** 8.802*** 0.389***
Number of observations 2752 2794 2869 2869 2869 2869
R squared 0.2178 0.02836 0.4227 0.02821 0.4076 0.02888
Table 8: Determinants of vulnerability in Tajikistan
log hh total consumption
log hh food
consumption log hh income
per capita per capita per capita
expectation variance expectation variance expectation variance Location
Whether household lives in
urban area 0.014 0.011 -0.002 -0.004 -0.092 -0.275*
Dushanbe – capital 0.365*** 0.02 0.307*** -0.023 0.273*** -0.006
GBAO -0.203*** -0.03 -0.083 0.028 0.158 -0.342
RSS 0.297*** 0.091** 0.271*** 0.026 -0.114 0.468***
Leninabad 0.021 0.006 -0.005 -0.059* -0.281*** 0.183
Household characteristics
Household size -0.139*** -0.034** -0.142*** -0.022 -0.121*** 0.038 Household size squared 0.005*** 0.001 0.005*** 0.001 0.004*** -0.004
Age of household head -0.001 -0.001 0.001 -0.001 -0.003 0.007
Whether household head is
male 0.124*** -0.052 0.124*** -0.055 0.221*** 0.091
Ethnicity of household head
Tajik 0.179 -0.066 0.145 -0.111 0.056 -0.209
Russian 0.192 -0.129 0.219 -0.126 0.118 -0.164
Uzbek 0.142 -0.058 0.125 -0.093 0.128 -0.103
Tartar -0.182 0.329 -0.111 0.301 0.102 0.529
Kyrgyz 0.133 -0.219 0.143 -0.253 -0.104 -0.451
Whether hh head obtained at
least 8th class 0.017 -0.055* 0.03 -0.063** 0.089* 0.061
Prop. of members
Age 0-14 -0.483*** -0.061 -0.352*** -0.037 -0.639*** -0.027 Prop. of members
age > 64 -0.371*** -0.073 -0.178 0.016 -0.128 -0.804
Prop. of member with poor
health -0.058 0.074 -0.201** 0.01 -0.305* 0.750*
Assets Whether household owns
land 0.141*** -0.038 0.104** -0.024 -0.186* -0.057
Whether household owns
yak(s) 1.103*** -0.234 1.185*** -0.2 0.823 -0.751
Constant 10.027*** 0.643*** 9.573*** 0.587*** 9.702*** 0.576
Number of observations 1632 1633 1631 1632 1611 1614
R squared 0.1929 0.02251 0.2007 0.02126 .08998 .02209
5.3 Estimating the level of vulnerability
Our assessment of vulnerability in the Central Asian countries is based on the probability of future consumption as estimated. This estimation used past realizations of consumption expenditures, assuming that the environment is stationary. It is worth noticing that the target of policy in this paper is a population of households, not individuals, simply because the data on consumption expenditures are obtained from the countries’ household surveys. This means that if we consider a household as poor or vulnerable every member in this household is deemed equally poor or vulnerable.
5.3.1 Vulnerability at the aggregate level
Table 9 describes the distribution of vulnerability at the aggregate level in the countries being studied. Tajikistan is not only the poorest but also the most vulnerable to poverty among these countries. Almost all households in Tajikistan are expected to continue to be poor in the future. Although the observed incidence of poverty of 56.3% in Kyrgyzstan is significantly lower than that of 67.7% in Azerbaijan, there is a risk that Kyrgyzstan poverty rate could rise up to 62.6%, which is very close to the current poverty rate in Azerbaijan.
Table 9: Cross-distribution between poverty and vulnerability in Central Asia
Non-vulnerable Vulnerable
Azerbaijan 15.8 84.2 100
Non-poor 29.5 70.5 32.3
Poor 9.2 90.8 67.7
Kazakhstan 71.8 28.2 100
Non-poor 86.6 13.4 65.0
Poor 44.3 55.7 35.0
Kyrgyzstan 37.4 62.6 100
Non-poor 53.9 46.1 43.7
Poor 24.5 75.5 56.3
Kyrgyzstan* 41.1 58.9 100
Non-poor 57.0 43.0 45.1
Poor 28.0 72.0 54.9
Kyrgyzstan** 41.0 59.0 100
Non-poor 57.0 43.0 45.1
Poor 27.9 72.1 54.9
Tajikistan 0.2 99.8 100
Non-poor 3.2 96.8 5.1
Poor 0.0 100.0 94.9
Except for Kazakhstan, the poverty rate underestimates the fraction of the population vulnerable to poverty. For example, in Azerbaijan, while 67.7% of the population is observed to be poor, up to 84.2% of the population is estimated to be vulnerable to poverty. However, for Kazakhstan, the poverty rate overestimates the fraction of population vulnerable. While 35% of the Kazakhstan population is poor, only 28.2% are expected to be poor in the future. Hence, vulnerability measures differ from measures of static poverty. Given the information that measures of vulnerability provide these should be estimated alongside measures of static poverty.
A sizable fraction of non-poor are vulnerable to poverty in these countries. For example, in Kazakhstan, of the 65% of the population observed to be non-poor, 13.4% are estimated to be vulnerable to poverty. Similarly, in Kyrgyzstan, of the 43.7% of the population observed to be non-poor, 46.1% are estimated to be vulnerable to poverty. Thus there are differences in the size of the population that is vulnerable as compared to the size of the population that is poor. Azerbaijan is the country which has the highest proportion of the non-poor vulnerable to poverty. In this country, up to 70.5% of the non-poor are estimated to be vulnerable to poverty. Thus, these people while not poor based on the data for the current period are likely to become poor in the future. These estimates support the claim that while poverty and vulnerability are closely related concepts, there remain important distinctions between the two and neither notion nests the other. Thus poverty reduction strategies in Central Asia need to incorporate not just alleviation efforts but also prevention. However, programs that aim to reduce vulnerability in the population need to be targeted differently from those aimed at poverty alleviation.
Figure 4: Estimated incidences of vulnerability to poverty for poor and non-poor in Kazakhstan
5.3.2 Vulnerability by selected segments of the population
We now analyse the distribution of vulnerability (along with poverty) over locations and selected household and community characteristics. This is shown in Tables 10 to13. Except Tajikistan, of which nearly 100% of the population are poor and vulnerable, we find some interesting patterns of poverty and vulnerability distribution over selected segments of the population in these countries.
1. By and large, vulnerability (and poverty) in these countries are rural phenomena. In all countries studied (except Azerbaijan) rural households are over-represented among the poor and the vulnerable relative to their share in the population (Tables 9 to 12). For instance, in Kazakhstan, while 42.4% of the population live in rural areas, 48.8% of the poor and 53.2% of the vulnerable are rural. Similarly, in Kyrgyzstan, while 74.5% of the population are rural, 80.5% of the poor live in rural areas as do 82.9% of those we estimate to be vulnerable.
The disproportionate distribution of rural households to overall poverty and vulnerability leads to the higher poverty and vulnerability rates in rural areas. In Kazakhstan, 40.3% and 35.5% of the rural population are poor and vulnerable, whereas in urban areas, the poverty and vulnerability rates are only 30.3% and 20.3% respectively. Similarly, in Kyrgyzstan, the poverty and vulnerability rates in rural areas are 60.8% and 69.7% respectively, compared with only 43.2% and 42.1% respectively in urban areas. This means that, while the poverty rate underestimates the fraction of population vulnerable in Kyrgyzstan rural areas, it overestimates the vulnerable fraction
0 .2 .4
.6
.8 1
F
racti
on
ab
ov
e t
h
e thr
esh
ol
d
0 2 .4 .6 .8 1
Vulnerability threshold
in urban areas. This again supports the necessity of distinguishing between the poverty and vulnerability measures.
One reason why poverty and vulnerability in rural areas are more serious than in urban areas could be the presence of high inequality. While inequality in rural areas is roughly comparable to that for urban areas in Azerbaijan and Tajikistan, the Lorenz curves for Kazakhstan (Figures 5 and 6) show that inequality in rural areas in these countries is more severe than in urban areas. However, inequality is not a reason for poverty and vulnerability in Kyrgyz rural areas. The Lorenz curve for this country (Figure 7) shows that inequality in urban areas is more severe than in rural areas. Inequality in rural areas is roughly comparable to that in urban areas (Figure 8).
Figure 5: Lorenz food expenditure curves by area in Azerbaijan
0 .2 .4 .6 .8
1
Lore
nz f
ood
e
xp
endi
tu
re
(b
y ar
ea)
0 .2 .4 .6 .8 1
Figure 6: Lorenz consumption curves by areas in Kazakhstan
Figure 8: Lorenz total expenditure curves by area in Tajikistan
2. We now discuss the contribution of rural and urban areas to overall poverty and vulnerability in Kazakhstan at the regional level. In this country, inter-regional differences in vulnerability rates are more obvious than the inter-regional disparities in poverty rates. In Table 11, the fraction of population that is poor ranges from a low of 9.2% in the northern region to a high of 69.1% in the southern region. Concurrently, the fraction of population vulnerable to poverty ranges from a low of 0.9% in the northern region to a high of 83.1% in the southern region.
Figure 9: Poverty and vulnerability rates for oblasts of Kazakhstan
0 0.1 0.2 0.3 0.4 0.5 0.6 0.7 0.8 0.9 1
0 0.1 0.2 0.3 0.4 0.5 0.6 0.7 0.8 0.9 1
Oblast poverty rate
O
b
la
s
t vu
ln
er
a
b
il
it
y
ra
te
3. In Azerbaijan and Kyrgyzstan poverty and vulnerability rise with household size. For instance, in Azerbaijan, of the 22.6% of the population that live in households with 5 members — the latter accounting for 22.5% of the poor and 24.3% of the vulnerable — 67.2% are poor and 90.7% are vulnerable to poverty. Even worse, of the 47.6% of the population that live in households with 6 members or more, and account for 55% of the poor and vulnerable, 78.1% are poor and nearly 100% are vulnerable to poverty.
Similarly, in Kazakhstan, of the 23% of the population which lives in households with more than 5 members, the latter accounting for up to 40.7% of the poor and 55.1% of the vulnerable, 62% are poor and 67.7% are vulnerable to poverty. Large household size is one reason for the imbalances in the contributions of rural and urban areas to overall poverty and vulnerability because about 66% of households with more than 5 members live in rural areas.
In Kyrgyzstan, strikingly, poverty and vulnerability seem to decrease with larger household size. For example, of the 1.3% of the population who live in households with only one member, the latter accounting for 2.2% of the poor and 2.1% of the vulnerable, 94.2% are poor and 100% are vulnerable to poverty. Concurrently, of the 55.1% of the population which live in households with 6 or more members, the latter accounting for 52.1% of the poor and 48.4% of the vulnerable, only about half are poor and vulnerable to poverty.
woman live in urban areas which are less poor and vulnerable than rural areas. Further, we don’t find an association between poverty and vulnerability and gender of heads of households in Azerbaijan.
5. In general, people who live in households headed by individuals with less education are poorer and more vulnerable to poverty. In Kazakhstan, of the 28% of the population who live in households headed by individuals with no training (except school) — comprising 36.4% of the poor and 42.5% of the vulnerable — about 45% are poor and 43% are vulnerable to poverty. Further, of the 17.2% of the population who live in households headed by individuals with at most occupational course 38.5% are poor and 30.4% are vulnerable, slightly lower than that of the previous group. The poverty and vulnerability rates are improved moderately for the population that live in households headed by individuals with higher than occupational training. However, the drop in the incidence of vulnerability is not clear among the group headed by individuals with higher than occupational training.
Similarly, in Kyrgyzstan, of the 28% of the population that lives in households headed by individuals with no diploma or certificate — who comprise 12.3% of the poor and 15% of the vulnerable — about 64% are poor and 87% are vulnerable to poverty. Meanwhile, of the 14.3% of the population that lives in households headed by individuals with higher education diploma only 34% are poor and 29.9% are vulnerable.
Table 10: Distribution of poverty and vulnerability in Azerbaijan
Share of population
Share of poor
Share of vulnerable
Poverty rate
Vulnerability rate
Overall 100 100 100 67.7 84.2
By areas and regions
Rural 62.6 60.5 59.7 65.4 80.4
Near southwest 8.8 7.3 7.6 56.1 72.3
Far Northwest 15.3 13.0 11.7 57.6 64.3
Central North 7.4 6.9 7.0 62.8 80.0
Naxichevan 4.3 5.7 4.9 89.5 95.9
Far South 7.4 6.9 7.2 63.0 81.4
Near Northwest 7.2 7.1 7.2 66.8 84.9
Central 12.2 13.6 14.2 75.6 97.6
Urban 37.4 39.5 40.3 71.5 90.7
By household size
1 1.1 0.5 0.1 32.3 7.1
2 3.7 1.9 0.7 34.1 16.2
3 7.7 5.1 4.4 44.8 48.7
4 17.3 15.1 15.4 59.1 74.9
5 22.6 22.5 24.3 67.2 90.7
6 and more 47.6 55.0 55.0 78.1 97.4
By gender of household head
Female 18.0 18.1 17.8 68.3 83.5
Male 82.0 81.9 82.2 67.5 84.4
By possession of land
Owns no land 49.1 52.5 53.2 72.3 91.2
Table 11: Distributions of poverty and vulnerability in Kazakhstan
Population share
Share of poor
Share of vulnerable
Poverty rate
Vulnerability rate
Overall 100 100 100 35.0 28.2
By areas
Urban 49.5 42.8 35.6 30.3 20.3
Poselki 8.1 8.4 11.2 36.3 39.1
Rural 42.4 48.8 53.2 40.3 35.5
By regions
Central 16.8 13.0 10.3 27.1 17.3
Southern 21.1 41.5 62.0 69.1 83.1
Western 14.0 15.4 10.9 38.4 22.0
Northern 20.6 5.4 0.7 9.2 0.9
Eastern 27.5 24.7 16.1 31.5 16.6
By household size
1 2.6 0.9 0.4 12.6 3.8
2 10.6 6.2 2.1 20.5 5.7
3 17.1 11.1 5.9 22.9 9.8
4 27.4 18.4 14.0 23.5 14.4
5 19.4 22.6 22.5 41.0 32.8
6 and more 23.0 40.7 55.1 62.0 67.7
By gender of household head
Female 30.9 24.8 23.3 28.1 21.3
Male 69.1 75.2 76.7 38.1 31.3
By education of household head
No training 28.0 36.4 42.5 45.4 42.8 Occupational courses 17.2 18.9 18.5 38.5 30.4 PTU, FSO without sec.
classes 5.6 5.3 4.1 33.1 20.8
PTU with sec. classes 9.8 8.5 7.8 30.6 22.5 Technical colleges 21.6 18.5 13.9 30.1 18.1 University 17.6 12.2 13.0 24.3 20.9
Post-graduate 0.3 0.2 0.2 31.6 21.1
By possession of house
Owns no house 10.0 11.9 12.2 41.5 34.4 Owns house 90.0 88.1 87.8 34.3 27.5
By possession of land
Table 12: Distributions of poverty and vulnerability in Kyrgyzstan
Share of population
Share of poor
Share of vulnerable
Poverty rate
Vulnerabi-lity rate
Overall 100 100 100 56.3 62.6
By areas
Rural 74.5 80.5 82.9 60.8 69.7
Urban 25.5 19.5 17.1 43.2 42.1
By household size
1 1.3 2.2 2.1 94.2 100.0
2 4.6 6.0 6.9 72.8 92.9
3 7.3 7.7 9.0 59.1 76.6
4 13.6 13.3 13.2 55.0 60.9
5 18.1 18.8 20.5 58.6 71.1
6 and more 55.1 52.1 48.4 53.3 55.0
By gender of household head
Female 21.8 24.5 26.1 63.3 74.9
Male 77.3 74.7 72.5 54.5 58.7
By age of household head
<20 0.3 0.5 0.4 87.5 90.0
20-40 36.1 38.2 41.4 59.6 71.8
40-60 39.5 34.0 30.9 48.5 49.0
>60 24.1 27.4 27.3 63.9 70.8
By ethnicity of household head
Kyrgyz 72.3 76.0 78.7 59.2 68.2
Russian 13.1 9.9 7.7 42.5 36.9
Ukrainian 1.1 0.9 0.7 44.7 38.2
Uzbek 7.1 8.2 9.5 65.3 84.7
Kazakh 0.8 0.5 0.1 36.6 8.0
Beylorussian 0.1 0.0 0.0 15.4 15.4
Tadjik 0.4 0.5 0.5 68.6 88.2
Tatar 0.9 0.6 0.5 38.0 31.4
Dungan 0.8 0.2 0.0 16.8 0.0
Others 2.5 1.2 49.2 27.0
By education of household head
No diploma or certificate 10.8 12.3 15.0 64.3 87.2 Incomplete secondary 14.5 15.9 15.7 61.7 68.1 Complete secondary 37.4 42.2 44.7 63.6 74.7 Prof-tech school 6.8 7.0 6.8 57.8 61.8
Technikum 14.9 12.7 10.6 47.9 44.8 Higher ed. diploma 14.3 8.6 6.8 34.0 29.9
Table 13: Distributions of poverty and vulnerability in Tajikistan
Share of population
Share of poor
Share of vulnerable
Poverty rate
Vulnerability rate
By areas
Rural 69.8 70.7 69.9 96.1 99.9 Urban 30.2 29.3 30.1 92.2 99.6
By regions
Dushanbe 9.3 8.4 9.2 85.4 98.7
GBAO 4.9 5.2 4.9 100.0 100.0
RSS 28.0 27.4 28.0 92.6 99.8
Leninabad 35.6 36.1 35.7 96.3 100.0
Khatlon 22.1 23.0 22.2 98.4 100.0
By household size
1 0.3 0.2 0.3 80.0 100.0
2 1.3 1.0 1.2 76.4 90.9
3 3.3 2.7 3.3 77.9 100.0 4 7.1 6.8 7.1 90.8 100.0 5 14.5 14.3 14.5 94.0 100.0 6 and more 73.5 74.9 73.6 96.6 99.9
By gender of household head
Female 17.6 17.5 17.6 94.4 100.0
Male 82.4 82.5 82.4 95.0 99.8
By ethnicity of household head
Tajik 68.2 68.7 68.2 95.5 99.8
Russian 1.2 0.9 1.2 70.9 100.0
Uzbek 28.5 28.4 28.5 94.6 99.8
Tartar 0.5 0.5 0.5 88.6 100.0
Kyrgyz 1.1 1.2 1.1 100.0 100.0
Others 0.4 0.4 0.4 78.9 100.0
By qualification of household head
None 38.2 38.2 38.2 94.7 99.8
8th (9th) class 11.7 11.8 11.7 96.2 100.0 Secondary school 32.9 32.8 32.9 94.7 99.9 Prof-tech. school 6.8 6.8 6.8 95.2 99.7 Spec tech school 4.6 4.5 4.5 94.6 99.5 Higher ed institute 5.3 5.2 5.3 93.7 99.6 Cand. of science 0.1 0.1 0.1 100.0 100.0 Others 0.5 0.5 0.5 100.0 100.0
By possession of land
5.4. Robustness check
Lastly, we check the robustness of vulnerability estimations. The scope for doing this was limited by the data. In the case of Kyrgyzstan, however, we were able to distinguish between households according to whether they used electricity. To check for the sensitivity of results we added a dummy for whether the household uses electricity to the original specification for the case of Kyrgyzstan. The results of this augmented and restricted estimation are reported in the Appendix Tables and the cross-section distribution between poverty and vulnerability at the aggregate level is shown in Table 9. From Table 9, we can see the change in model specification doesn’t change the original results much. The poverty rate still underestimates the fraction of the population vulnerable to poverty. While 54.9% of the population are observed to be poor, up to 58.9% of the population are estimated to be vulnerable to poverty. There is still a sizable fraction of non-poor which are vulnerable to poverty in Kyrgyzstan. Of the 45.1% of the population observed to be non-poor, 43% are estimated to be vulnerable to poverty. We also consider the risk of omission by eliminating the variable of per capita land areas available to household from the original model for Kyrgyzstan. Results from alternative specifications are depicted in the Appendix tables. Further, Table 9 shows the cross-section distribution between poverty and vulnerability obtained from the restricted model. Table 9 reveals that the change in model specification doesn’t alter the original results much.
6. Conclusions
In their transition to market-based economies since independence, the Central Asian countries studied in this paper initiated macroeconomic reforms. This led to economic recovery and greater price stability. However, these countries are still challenged by poverty and vulnerability to poverty. In this paper, vulnerability was considered alongside static poverty for these countries because the current poverty level may not necessarily be a good guide to expected poverty in the future. We used the expected poverty approach to assess the vulnerability.
Because panel data are typically not available, especially in developing countries like the Central Asian countries, we estimated vulnerability with cross-sectional data as the second-best solution. This necessitated our making the strong assumption that the environment is stationary so the cross-sectional variance can be used to estimate the inter-temporal variance. While cross-sectional variance will indeed be able to explain a part of intertemporal variance (the one due to idiosyncratic or cluster-specific shocks), the impact of inter-temporal or aggregate (household invariant but time variant) shocks will be missed. In other words, the model is likely to produce good estimates of vulnerability for the situations where the distributions of risks, and the risk-management instruments, are similar from one period to another.
strategies in these Central Asia countries need to incorporate not just alleviation efforts but also prevention. Of course, programs that aim to reduce the vulnerability in the population need to be targeted differently from those aimed at poverty alleviation.
References
Bandara, A., Malik, M. and Gherman, E. (2004), ‘Poverty in Countries of Central Asia’, Bulletin
on Asia-Pacific Perspectives, 05, 117–129.
Chaudhuri, S., (2003), ‘Assessing Vulnerability to Poverty: Concepts, Empirical Methods and
Illustrative Examples’, mimeo, Columbia University.
Chaudhuri, S., Jalan, J., Suryahadi, A. (2002), ‘Assessing Household Vulnerability to Poverty
from Cross-Sectional Data: A methodology and estimates from Indonesia’, Economics
Department Discussion Papers, Columbia University, v. 0102–52.
Christiaensen, L., (2000), ‘Measuring Vulnerability and Food Security: Case on Measuring
Household Food Vulnerability: Case evidence from Northern Mali’, Working Paper, Cornell
University.
Christiaensen, L. and Boisvert, R. N. (2002), ‘On Measuring Household Food Vulnerability:
Case evidence from Northern Mali’, Working Paper, Cornell University.
Christiaensen, L. and Subbarao, K. (2005), ‘Toward an Understanding of Household
Vulnerability in Rural Kenya’, Journal of African Economies, 14(4), 520–558.
Dowling, J. and Wignaraja G. (2006) ‘Central Asia’s Transition After Fifteen Years’, Working
Paper on Regional Economic Integration, 3, Asian Development Bank.
ESCAP (2004), Economic and Social Survey of Asia and the Pacific 2004, United Nations.
Heller, P. and Keller, C. (2001), ‘Social Sector Reform in Transition Countries’, IMF Working
Paper, WP/01/35.
Holzmann, R. and Jørgensen, S. (1999), ‘Social Risk Management: Conceptual Underpinnings
for the Social Protection Sector Strategy Paper’, Social Protection Discussion Paper Series, The
World Bank, 529–556.
Holzmann, R., and Jørgensen, S. (2001), ‘Social Risk Management: A New Conceptual
Framework for Social Protection, and Beyond’, International Tax and Public Finance, 8(2), 529–
556.
Holzmann, R., Sherburne-Benz, L. and Tesliuc, E. (2003), Social risk management: The World
Kamanou, G. and Morduch, J. (2005), ‘Measuring Vulnerability to Poverty’, in Dercon, S. (ed.)
Insurance Against Poverty, New York: Oxford University Press.
Ligon, E. and Schechter, L. (2004), ‘Evaluating Different Approaches to Estimating
Vulnerability’, Social Protection Discussion Paper, The World Bank.
Ligon, E. and Schechter, L. (2003), ‘Measuring Vulnerability’, The Economic Journal, 113(486):
C95–C102.
Scaramozzino, P., (2006), ‘Measuring Vulnerability to Food Insecurity’, ESA Working Paper.
The World Bank (2009), Measuring Vulnerability’, Wired at
Appendix
Determinants of vulnerability in Kyrgyzstan – augmented estimation
log hh income log hh total expenditure
log hh food expenditure per capita per capita per capita
expectation variance expectation variance expectation variance
Areas
North Urban 0.055 0.005 0.127*** 0.114*** 0.067* 0.141*** North Rural -0.034 0.157** 0.011 0.108*** -0.071*** 0.130*** South Urban -0.258*** 0.068 0.167*** -0.003 0.103** -0.028
Household characteristics
Household size 0.303*** 0.011 -0.174*** -0.023* -0.178*** -0.012 Household size squared -0.012*** -0.002 0.006*** 0.001 0.006*** 0
Age household head 0.007*** -0.006*** 0.001 -0.001 0.002** -0.001 Whether hh head is male 0.173*** -0.093 0.097*** -0.031 0.106*** -0.032
Ethnic of household head
Kyrgyz 0.059 0.126 -0.235*** -0.114*** -0.276*** -0.081* Russian 0.341*** -0.157 0.072 -0.150*** 0.026 -0.155*** Ukrainian 0.185 -0.053 0.091 -0.180** 0.026 -0.204** Uzbek -0.181* 0.146 -0.424*** -0.085* -0.414*** -0.054
Kazakh -0.065 -0.150 0.043 -0.118 0.129 -0.043 Beylorussian 0.552* -0.169 0.281 -0.257 0.125 -0.315 Tadjik -0.551** -0.271 -0.415*** -0.199*** -0.234 -0.123 Tatar 0.160 -0.209 0.011 -0.004 0.005 -0.004
Dungan 0.055 -0.146 0.319** -0.141* 0.095 -0.114
Highest certification of
hh head 0.042*** -0.036** 0.057*** 0.005 0.040*** -0.004 Prop. of members
age 0-14 -0.642*** -0.632*** -0.380*** -0.039 -0.270*** -0.044 Prop. of members
age > 60 -0.253*** -0.415** -0.324*** -0.073 -0.200*** -0.016
Assets
Per capita land area
available to hh 0.006** -0.006* 0.001 -0.001 0.002** 0 Whether uses electricity
for dwelling 0.278*** -0.249*** 0.134*** -0.082*** 0.130*** -0.075*** Constant 5.926*** 1.267*** 9.084*** 0.498*** 8.571*** 0.467*** Number of observations 2742 2794 2869 2869 2869 2869 R squared 0.2287 0.03216 0.4278 0.03065 0.4141 0.03011
Table 2: Determinants of vulnerability in Kyrgyzstan — restricted estimation
log hh income log hh total expenditure
log hh food expenditure
per capita per capita per capita
expectation variance expectation variance expectation variance
Areas
North Urban 0.143*** -0.042 0.188*** 0.082*** 0.124*** 0.112*** North Rural -0.062 0.180*** 0.009 0.114*** -0.079*** 0.135*** South Urban -0.226*** 0.045 0.190*** -0.007 0.129*** -0.029
Household characteristics
Household size 0.283*** 0.021 -0.179*** -0.018 -0.184*** -0.009 Household size
squared -0.012*** -0.002 0.006*** 0.001 0.006*** 0 Age household
head 0.008*** -0.006*** 0.001 -0.001 0.002** -0.001 Whether hh head is
male 0.144*** -0.059 0.094*** -0.028 0.098*** -0.028
Ethnic of household head
Kyrgyz -0.008 0.130 -0.254*** -0.104** -0.287*** -0.075 Russian 0.307 -0.205 0.058 -0.148*** 0.017 -0.155**
Ukrainian 0.105 -0.084 0.075 -0.172** 0.013 -0.198** Uzbek -0.249** 0.139 -0.437*** -0.078* -0.428*** -0.051
Kazakh -0.077 -0.183 0.020 -0.099 0.111 -0.028 Beylorussian 0.612** -0.274 0.320 -0.278 0.146 -0.332
Tadjik -0.711*** -0.187 -0.436*** -0.207** -0.284* -0.130 Tatar 0.207 -0.227 -0.002 -0.013 -0.010 -0.010
Dungan -0.031 -0.142 0.286** -0.118 0.071 -0.095 Highest
certification of hh head
0.050*** -0.046*** 0.059*** 0.004 0.042*** -0.005
Prop. of members
age 0-14 -0.608*** -0.666*** -0.394*** -0.029 -0.289*** -0.030 Prop. of members
age > 60 -0.300*** -0.442** -0.327*** -0.073 -0.289*** -0.030 Constant 6.078*** 1.192*** 9.141*** 0.455*** 8.638*** 0.428*** Number of
observations 2808 2855 2931 2931 2931 2931 R squared 0.213 0.02741 0.4244 0.02637 0.4108 0.02743