SYSTEMS-LEVEL QUALITY IMPROVEMENT
The Predictive Factors on Extended Hospital Length of Stay
in Patients with AMI: Laboratory and Administrative Data
Teresa Magalhães1&Sílvia Lopes1&João Gomes2&Filipe Seixo3
Received: 26 April 2015 / Accepted: 30 September 2015
#Springer Science+Business Media New York 2015
Abstract The length of hospital stay (LOS) is an important measure of efficiency in the use of hospital resources. Acute Myocardial Infarction (AMI), as one of the diseases with higher mortality and LOS variability in the OECD countries, has been studied with predominant use of administrative data, particularly on mortality risk adjustment, failing investigation in the resource planning and specifically in LOS. This paper presents results of a predictive model for extended LOS (LOSE - above 75th percentile of LOS) using both adminis-trative and clinical data, namely laboratory data, in order to develop a decision support system. Laboratory and adminis-trative data of a Portuguese hospital were included, using lo-gistic regression to develop this predictive model. A model with three laboratory data and seven administrative data var-iables (six comorbidities and age≥69 years), with excellent discriminative ability and a good calibration, was obtained. The model validation shows also good results. Comorbidities were relevant predictors, mainly diabetes with complications, showing the highest odds of LOSE (OR=37,83;p=0,001). AMI patients with comorbidities (diabetes with complica-tions, cerebrovascular disease, shock, respiratory infeccomplica-tions, pulmonary oedema), with pO2 above level, aged 69 years or
older, with cardiac dysrhythmia, neutrophils above level, pO2 below level, and prothrombin time above level, showed in-creased risk of extended LOS. Our findings are consistent with studies that refer these variables as predictors of in-creased risk.
Keywords Decision support system . Acute myocardial infarction . Length of hospital stay . Efficiency . Laboratory data . Predictive model
Introduction
The appropriate use of hospital resources is important for con-trolling spending and improving health care outcomes [1,2]. For that aim, it is necessary to balance the interests of the different stakeholders: patients, health organizations and payer [3]. Length of hospital stay (LOS) is commonly considered as a measure of efficiency and a resource consumption proxy [4]. Much research has been done to improve efficiency; however, it refers to the possibility to act on the cases identified as problematic only at a later stage. Intensive care units are an exception, since research is being done to predict patient risk and LOS at the time of admission, with good results for re-source planning [4,5].
The global aim of this study is to investigate how Informa-tion Systems (IS) and the already available data in the hospital databases can contribute to a better management of health care resources, namely by knowing which resources are used, their appropriateness and the results obtained, providing tools to support decisions of those responsible for care management and delivery. This work is part of a larger study, whose major objective is to develop a decision support system (DSS) for LOS management integrating the information residing in the hospital databases. The choice of Acute Myocardial Infarction This article is part of the Topical Collection onSystems-Level Quality
Improvement.
* Teresa Magalhães
1
Public Health Research Center, Department of Health Systems Policy and Management, National School of Public Health, Universidade Nova de Lisboa, Lisbon, Portugal
2 Centro de Matemática e Aplicações Fundamentais, Faculdade de
Ciências da Universidade de Lisboa, Lisbon, Portugal
3
(AMI) was based on the fact that cardiovascular diseases are the leading cause of death in Portugal and in OECD countries [6,7], in line with Mathers and Loncar projections [8], with a relevant LOS variability among them (min 3,9 in Denmark and max 11,6 in Korea in 2011). In recent decades, new treat-ment technologies have been introduced in this area and guidelines were defined, with a major impact on mortality rates and LOS. However, according to the OECD [6], not all patients receive the guidelines recommended treatment and this leads to variations in resource use and LOS in particular. AMI is also pointed as a proxy for cardiac quality care in the hospitals that treat this illness [9].
The aim of this paper is to present preliminary results on the development of a LOS predictive model for patients with AMI at the time of admission, based on the identification of patients with extended LOS (LOSE). In AMI, much research has been done in the mortality risk adjustment and inherent predictive models, included in the AMI treatment guidelines [10,11], but it lacks investigation in the resource planning and specifically in LOS. The approved AMI treatment guidelines refer that for low risk patients the LOS guideline is 3 days and the instruments are PAMI-II criteria and Zwolle primary PCI Index, mainly dependent on the patient diagnosis by the health professionals [12,13].
Methods
Data
This study used laboratory data (LD) and administrative data (AD) from an NHS hospital in Portugal (approx. 400 beds) in 2010–11. Laboratory data include blood test results, laborato-ry type (routine or emergency), date and time of test.
Administrative data was extracted from national minimum basic dataset and includes patient’s gender, age, principal di-agnosis (reason for admission), and secondary diagnoses (oth-er conditions present) for discharged patients. The participat-ing hospital and the Portuguese National Commission for Da-ta Protection approved the daDa-ta collection.
Study population
The identification of AMI patients was based on International Classification of Diseases, Ninth Version, Clinical Modifica-tion (ICD-9-CM) codes recorded on principal diagnosis. Cases with code 410 (AMI) were included, except those where it was not the initial episode (codes 41002, 41072) [14, 15]. Also excluded were the patients under 18 years, without emergency department laboratory data, the deceased and those transferred to/from another hospital. The total study population included 439 cases.
Variables
Hospital LOS is a significant cost driver. To promptly identify patients at higher risk of prolonged hospitalization, LOSE was the outcome variable, identifying patients having an adverse result or excessive LOS (value:1). Patients with LOS above 75th percentile (≥7 days) were considered as having extended LOS [5,16]. LOS was defined as the time in days between admission and discharge to the inpatient hospital setting.
The study combined risk factors recorded in the adminis-trative database (gender, age, type of treatment, type of AMI, and comorbidities) and laboratory database (blood test re-sults). Gender (male or female) [2,17], age [2,18], type of treatment (medical or surgical) [11] and type of AMI (STEMI anterior, STEMI other, NSTEMI) [19,20], are relevant risk factors for prolonged LOS on AMI patients and were extract-ed from AD. Age was considerextract-ed as a categorical value (1:age≥69) due to lack of linearity on the logit scale.
Comorbidities, diseases not related in etiology or causality with the principal diagnosis [21], are important predictors of increased resource consumption [2, 14, 15, 22]. Relevant comorbidities for AMI were selected according to the litera-ture [2,14,15] and those included in the study were: acute renal failure (584.x; 403.x; 404.x; 996.7); anaemia (280x– 285x); cancer (140.0; 2090x-2097x); cardiac dysrhythmia (4270x-4279); cerebrovascular disease (430–437); chronic renal failure (V4511; 5851–5859); congestive heart failure (4280); diabetes with complications (2501x–2509x); diabetes without complications (2500x); ischaemic heart disease (41401); pulmonary oedema (518.4; 514.x; 4281); respirato-ry infections (480x–488x; 5198; 466x); and shock (78551; 78552) [2, 14, 15]. The list of ICD-9-CM codes has been validated by a cardiologist coding expert and, when recorded in secondary diagnoses in AD, it indicated the presence of comorbidity. Dichotomous variables indicating the presence of each of those comorbidities were included in the model (1:comorbidity present).
Risk factors based on laboratory data improve the predic-tion of health outcomes [23,24].
Patients had several values for LD during treatment, so only LD referring to the moment of admission were consid-ered. The missing values of LD in each episode were coded with the respective reference values [4,25].
Statistical analysis
We estimated the probability of each of the individuals in the sample having a LOS≥7 days using multiple logistic regres-sion. Initial variables were chosen based on results from sim-ple logistic regression with a statistical significance ofp<0, 25 [27]. Stepwise forward and stepwise backward [26] were used as variable selection methods. The best model (stepwise forward) was selected based in Akaike Information Criterion (AIC), where the best model shows the lowest AIC [27].
To validate the model, sensitivity and specificity measures were used. The cut-off point is the value that maximizes the two values simultaneously. To assess discrimination, the area under the ROC (Receiver Operating Characteristic) curve was used (1:perfect discrimination). As for model calibration, the Hosmer & Lemeshow statistic [27] was used as it relates to the agreement between observed and predicted LOSE (p-value~ 1:perfect calibration).
Given the limited number of cases included in the study, the model was developed with all available cases (439) [28] and the model validation was carried out in a total of 117 episodes, selected from AMI patients discharged in first half of 2014.
Results
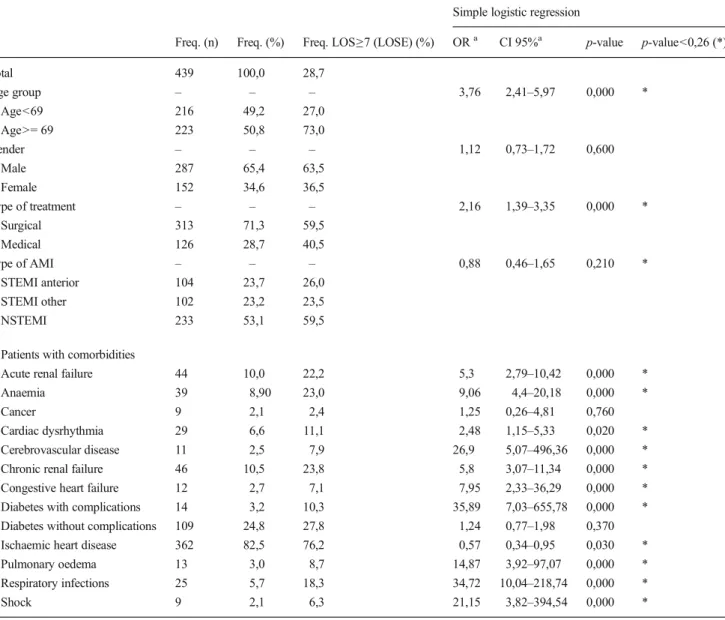
A total of 439 episodes in year 2010-11 met the criteria for inclusion in the study, where 126 patients (28,7 %) had an LOS≥7 days (Table 1). Patients with age≥69 (50,8 %;73, 0 %), male patients (65,4 %;63,5 %), patients with surgical treatment (71,3 %;59,5 %) and patients with NSTEMI (53, 1 %;59,5 %) were more frequent in the total population and also in patients with LOS≥7 days. The most frequent comor-bidities in total AMI patients and in AMI patients with LOSE were ischaemic heart disease (82,5 %;76,2 %) and diabetes without complications (24,8 %;27,8 %).
For LD variables (Table 2), patients with AMI fre-quently presented abnormal levels of RDW-CV (70,6 % above level) and troponin I (88,6 % above level). In patients with LOS≥7 days, the more frequent abnormal levels were in PO2 (above level) (73,9 %) and in TCO2 (below level) (73,3 %).
Based on the results from a simple logistic regression, all AD variables, with the exception of gender, cancer and diabe-tes without complications achieved statistical significance of p<0,25 and were included as potential covariates. In the LD variables group, a group of 28 variables showedp<0,25 (al-bumin; ALT; BE; calcium; cefalin time; CK; chlorine; C-reactive protein; creatinine; eosinophils; erythrocytes; HCO3a; haematocrit; haemoglobin; HGM; INR; LDH; lym-phocytes; CKMB mass; MPV; neutrophils; pO2; RDW-CV; sO2; TCO2; prothrombin time; troponinI; urea). Variable
BRDW-CV^(p-value=0,25) was also included, due to its clin-ical relevance.
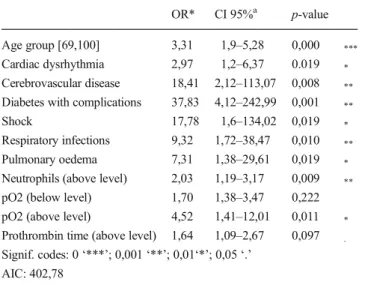
The results of the multiple logistic regression model are summarized in Table 3, with variables that have shown to significantly predict LOSE. Comorbidities were relevant pre-dictors, mainly diabetes with complications, showing the highest odds of LOSE (OR = 37,83;p= 0,001). Following were cerebrovascular disease (OR=18,41;p=0,008), shock (OR=17,78;p=0,019), respiratory infections (OR=9,32;p= 0,010), and pulmonary oedema (OR=7,31;p=0,019). Re-maining variables included in the model were pO2 (above normal) (OR=4,52;p=0,011); age group [69,100] (OR=3, 31;p= 0,000); cardiac dysrhythmia (OR = 2,97;p= 0,019); and neutrophils (above normal) (OR=2,03;p=0,009).
The model showed reasonable sensitivity (72 %) and spec-ificity (75 %) with a cut-off of 0,24, and an excellent discrim-inating capacity (area under ROC curve: 0,828). The model had a good calibration with the Hosmer & Lemeshow test with a p-value of 0,995.
The validation of the model with the 2014 sample, with 117 episodes, also showed good results (sensitivity, 73 %; speci-ficity, 72 %; area under the ROC Curve: 0,798).
Discussion
AMI patients with comorbidities (diabetes with complica-tions, cerebrovascular disease, shock, respiratory infeccomplica-tions, pulmonary oedema), with pO2 (above level), aged 69 years or older, with cardiac dysrhythmia, neutrophils (above level), pO2 (below level), and prothrombin time (above level) showed increased risk of extended LOS.
The predictive model included laboratory and administrative data and was a good predictor of LOSE. This is in line with other studies, that found that the introduction of clinical data in risk adjustment led to significant improvements [23,24].
Our findings are consistent with studies that refer these variables as predictors of increased risk. Comorbidities (name-ly diabetes) and age have been found to predict higher LOS in AMI patients [2,15]. The AMI guidelines indicate that low risk patients tend to stay less time in hospital [10,11] and the value of neutrophils is associated with impaired microvascular reperfusion and poor functional recovery after primary coro-nary angioplasty [29]. Khan and others found that prothrom-bin time above or below level increased patient risk of worse outcomes [30]. Moradkhan and Sinoway, refers that high PO2 values could potentially lead to worse outcomes [31] and this was corroborated by a recent study from Stub and others [32]. This is an interesting finding because it could be related to therapeutic measures, mainly in the emergency setting before the inpatient admission.
population (AMI patients discharged in first half of 2014) that provided good results and indicate stability of the model. As for comorbidities, we part on the assumption that they are present at time of admission, but this may not be true in some cases for diseases other than chronic diseases. For this inves-tigation, deceased patients were excluded. Further work is being done on this subject, refining the model to include the deceased patients, with a special focus on those with very short stays.
This model has the advantage of being based on real patient data entered during the treatment by health professionals, avoiding several problems related to data quality [2,26]. This question is relevant because some review models for assessing LOS efficiency [33,34] suffer from this limitation: they access
and process administrative data, which is important in a con-text of accountability of the various actors but can be misguiding, given the limitations of using coded information (namely ICD-9-CM) to describe patient’s condition.
However, some inconsistencies on the laboratory database were detected, mainly on data results and on reference values, affected by different calibrations of the equipments. Another difficulty is the current absence of rules for file construction and data registration. As mentioned by some authors, the cost and time required to collect clinical data is significant and for that reason these datae are not always applied in risk adjust-ment models [14]. Therefore, a question on data quality arises, concerning the capacity of existing IS to provide the necessary quality data to feed both research and future DSS.
Table 1 Descriptive statistics of AMI population–administrative data
Simple logistic regression
Freq. (n) Freq. (%) Freq. LOS≥7 (LOSE) (%) ORa CI 95%a p-value p-value<0,26 (*)
Total 439 100,0 28,7
Age group – – – 3,76 2,41–5,97 0,000 *
Age<69 216 49,2 27,0
Age>= 69 223 50,8 73,0
Gender – – – 1,12 0,73–1,72 0,600
Male 287 65,4 63,5
Female 152 34,6 36,5
Type of treatment – – – 2,16 1,39–3,35 0,000 *
Surgical 313 71,3 59,5
Medical 126 28,7 40,5
Type of AMI – – – 0,88 0,46–1,65 0,210 *
STEMI anterior 104 23,7 26,0
STEMI other 102 23,2 23,5
NSTEMI 233 53,1 59,5
Patients with comorbidities
Acute renal failure 44 10,0 22,2 5,3 2,79–10,42 0,000 *
Anaemia 39 8,90 23,0 9,06 4,4–20,18 0,000 *
Cancer 9 2,1 2,4 1,25 0,26–4,81 0,760
Cardiac dysrhythmia 29 6,6 11,1 2,48 1,15–5,33 0,020 *
Cerebrovascular disease 11 2,5 7,9 26,9 5,07–496,36 0,000 *
Chronic renal failure 46 10,5 23,8 5,8 3,07–11,34 0,000 *
Congestive heart failure 12 2,7 7,1 7,95 2,33–36,29 0,000 *
Diabetes with complications 14 3,2 10,3 35,89 7,03–655,78 0,000 * Diabetes without complications 109 24,8 27,8 1,24 0,77–1,98 0,370
Ischaemic heart disease 362 82,5 76,2 0,57 0,34–0,95 0,030 *
Pulmonary oedema 13 3,0 8,7 14,87 3,92–97,07 0,000 *
Respiratory infections 25 5,7 18,3 34,72 10,04–218,74 0,000 *
Shock 9 2,1 6,3 21,15 3,82–394,54 0,000 *
a
ORodds ratio,CIOR confidence interval
Barbini and others, says that when it is difficult to standardize local practices and patient populations differ, model customization is essential [5]. The generalization of a model requires attention to several factors that could limit the application of the LOSE prediction model to other settings. First, the different population that other
settings involve may be similar or not. This could be addressed by different means: the model adapts with the same coefficients and variables; the model is rebuilt with the same model covariates; the model is redone with all variables [35]. Second, this model requires access to data stored in different databases: administrative database, Table 2 Descriptive statistics of AMI population–laboratory data
Below level results Above level results Simple logistic regression
Freq. (n) Freq. (%) Freq. LOS≥7 (LOSE) (%)
Freq. (n) Freq. (%) Freq. LOS≥7 (LOSE) (%)
ORa CI 95%a p-value p-value <0,26 (*)
Albumin 42 9,6 64,3 – – – 0,18 0,09–0,36 0,000 *
ALT 10 2,3 20,0 115 26,2 34,8 1,46 0,36–9,81 0,220 *
AST – – – 238 54,2 29,8 1,13 0,75–1,72 0,570
BE 23 5,2 69,6 25 5,7 56,0 0,14 0,05–0,34 0,000 *
C-Reactive protein – – – 215 49,0 32,1 1,38 0,92–2,1 0,120 *
Calcium 42 9,6 50,0 – – – 0,36 0,19–0,69 0,000 *
Cefalin Time 49 11,2 40,8 75 17,1 30,7 0,52 0,28-–0,98 0,120 *
CHGM 31 7,1 38,7 43 9,8 27,9 0,61 0,29–1,34 0,460
Chlorine 14 3,2 50,0 82 18,7 34,1 0,36 0,12–1,08 0,090 *
CK 7 1,6 57,1 245 55,8 26,5 0,33 0,06–1,54 0,190 *
CK-MB – – – 278 63,3 27,3 0,84 0,55–1,28 0,410
Creatinine 7 1,6 14,3 62 14,1 59,7 4,79 2,75–8,47 0,000 *
Eosinophils 144 32,8 36,1 – – – 0,59 0,39–0,91 0,020 *
Erythrocytes 176 40,1 35,8 – – – 0,57 0,37–0,86 0,010 *
Glucose – – – 195 44,4 29,2 1,05 0,69–1,59 0,830
Haematocrit 200 45,6 37,0 – – – 0,47 0,31–0,72 0,000 *
Haemoglobin 152 34,6 40,1 – – – 0,44 0,28–0,67 0,000 *
HCO3a 23 5,2 69,6 34 7,7 58,8 0,13 0,05–0,33 0,000 *
HGM 30 6,8 30,0 66 15,0 19,7 1,02 0,46–2,4 0,190 *
INR – – – 43 9,8 44,2 2,14 1,12–4,05 0,020 *
LDH – – – 137 31,2 32,8 1,33 0,86–2,06 0,200 *
Lymphocytes 222 50,6 33,8 – – – 0,6 0,39–0,91 0,020 *
Magnesium – – – 91 20,7 31,9 1,21 0,73–1,98 0,460
CKMB Mass – – – 48 10,9 37,5 1,57 0,83–2,91 0,160 *
MPV 92 21,0 18,5 17 3,9 11,8 2,12 1,22–3,87 0,010 *
Neutrophils – – – 157 35,8 36,3 1,76 1,15–2,69 0,010 *
Platelets 20 4,6 35,0 20 4,6 20,0 0,75 0,3–2,05 0,560
pO2 42 9,6 57,1 23 5,2 73,9 0,22 0,11–0,42 0,000 *
Potassium 38 8,7 36,8 15 3,4 40,0 0,65 0,33–1,33 0,310
Prothrombin Time – – – 99 22,6 42,4 2,25 1,4–3,59 0,000 *
RDW-CV – – – 310 70,6 27,1 0,77 0,49–1,21 0,250 *
sO2 38 8,7 60,5 – – – 0,23 0,11–0,44 0,000 *
Sodium 89 20,3 31,5 – – – 0,85 0,52–1,42 0,520
TCO2 15 3,4 73,3 42 9,6 52,4 0,12 0,03–0,35 0,000 *
TroponinI – – – 389 88,6 27,0 0,51 0,28–0,94 0,030 *
Urea – – – 161 36,7 45,3 3,52 2,3–5,44 0,000 *
aORodds ratio,CIOR confidence interval
patient diagnostics and laboratory database. Van Walraven and others, refers as a limitation to model generalization that some hospitals do not have all the information avail-able, are unable to easily link the various tables, or do not have the expertise required to merge and analyse the data [35]. They tried the generalization of their model after launching it in production in their own settings and achieved good results. In the present investigation the difficulties are identical with the additional problem of LD data, because the equipments are differently calibrat-ed, thus leading to different reference values.
As the aim of this research is to incorporate a DSS in the medical IS, providing information in real time, with relevance to everyday practice for providers and managers, the model will be first installed and live tested in the hospital setting. An approach to generalization will follow, starting with AMI pa-tients and then expanded to all cardiac papa-tients, given the already mentioned fact that AMI is a proxy for quality care in the hospitals that treat this illness [9].
The steps defined in the creation and validation of the al-gorithm are means to ensure the quality of the model prior to its integration in the medical IS in place, as part of operational support systems.
Acknowledgments We want to thank to Centro Hospitalar de Setúbal, EPE and Fundação para a Ciência e a Tecnologia (UID/MAT/04561/ 2013) for their support.
Compliance with ethical standards
Conflicts of interest There are no conflicts of interest.
Consent The participating hospital and the Portuguese National Com-mission for Data Protection approved the data collection.
References
1. Kulinskaya, E., Kornbrot, D., and Gao, H., Length of stay as a performance indicator: robust statistical methodology. IMA J. Manag. Math.16:369–381, 2005.
2. Park, S., et al., Quality of care and in-hospital resource use in acute myocardial infarction: evidence from Japan.Health Policy111: 264–272, 2013.
3. Kaplan, R. M., and Babad, Y. M., Balancing influence between actors in healthcare decision making.BMC Health Serv. Res.11: 85, 2011.
4. Meyfroidt, G., et al., Computerized prediction of intensive care unit discharge after cardiac surgery: development and validation of a Gaussian processes model.BMC Med. Inform. Decis. Mak.11: 64, 2011.
5. Barbini, P., Barbini, E., Furini, S., and Cevenini, G., A straightfor-ward approach to designing a scoring system for predicting length-of-stay of cardiac surgery patients.BMC Med. Inform. Decis. Mak.
14:89, 2014.
6. OECD (2013) Health at a Glance 2013: OECD Indicators, OECD Publishing. http://dx.doi.org/10.1787/health_glance-2013-en. Accessed 28 September 2014
7. DGS (2014) Portugal: Doenças Cérebro-Cardiovasculares em números 2014. Direção-Geral da Saúde.http://www.dgs.pt/ estatisticas-de-saude/estatisticas-de-saude/publicacoes/portugal-doencas-cerebro-cardiovasculares-em-numeros-2014.aspx. Accessed 20 November 2014
8. Mathers, C. D., and Loncar, D., Projections of global mortality and burden of disease from 2002 to 2030.PLoS Med.3(11):e442, 2006. 9. Chevreul, K., et al., Does lay media ranking of hospitals reflect lower mortality in treating acute myocardial infarction? Arch. Cardiovasc. Dis.105(10):489–498, 2012.
10. Hamm, C. W., et al., ESC guidelines for the management of acute coronary syndromes in patients presenting without persistent ST-segment elevation.Eur. Heart J.32:2999–3054, 2011.
11. Steg, G., et al., ESC guidelines for the management of acute myo-cardial infarction in patients presenting with ST-segment elevation.
Eur. Heart J.33:2569–2619, 2012.
12. Grines, C.L., et al, Safety and cost-effectiveness of early discharge after primary angioplasty in low risk patients with acute myocardial infarction. PAMI-II Investigators. Primary Angioplasty in Myocardial Infarction. J Am Coll Cardiol. 31,5:967–972, 1998. 13. Kotowycz, M., Syal, R. P., Afzal, R., and Natarajan, M. K., Can we
improve length of hospitalization in ST elevation myocardial infarc-tion patients treated with primary percutaneous coronary interven-tion?Can. J. Cardiol.25(10):585–588, 2009.
14. Tu, J. V., Austin, P. C., Walld, R., Roos, L., Agras, J., and McDonald, K. M., Development and validation of the Ontario acute myocardial infarction mortality prediction rules.J. Am. Coll. Cardiol.37:992–997, 2001.
15. Stargardt, T., Schreyogg, J., and Kondofersky, I., Measuring the relationship between costs and outcomes: the example of acute myocardial infarction in German hospitals. Hamburg center for health economics.Health Econ.23:653–669, 2014.
16. Wright, S. P., et al., Factors influencing the length of hospital stay of patients with heart failure.Eur. J. Heart Fail.5(2):201–209, 2003. 17. Paulus, J. K., Shah, N. D., and Kent, D. M., Cardiovascular per-spective: all else being equal. Men and women are still not the same: using risk models to understand gender disparities in care.
Circ. Cardiovasc. Qual. Outcomes8:317–320, 2015.
18. Qi Fan, G., et al., A medical costs study of older patients with acute myocardial infarction and metabolic syndrome in hospital.Clin. Interv. Aging10:329–337, 2015.
Table 3 Variables in predictive model of LOSE
OR* CI 95%a p-value
Age group [69,100] 3,31 1,9–5,28 0,000 ***
Cardiac dysrhythmia 2,97 1,2–6,37 0.019 *
Cerebrovascular disease 18,41 2,12–113,07 0,008 **
Diabetes with complications 37,83 4,12–242,99 0,001 **
Shock 17,78 1,6–134,02 0,019 *
Respiratory infections 9,32 1,72–38,47 0,010 **
Pulmonary oedema 7,31 1,38–29,61 0,019 *
Neutrophils (above level) 2,03 1,19–3,17 0,009 **
pO2 (below level) 1,70 1,38–3,47 0,222 pO2 (above level) 4,52 1,41–12,01 0,011 *
Prothrombin time (above level) 1,64 1,09–2,67 0,097 .
Signif. codes: 0‘***’; 0,001‘**’; 0,01‘*’; 0,05‘.’ AIC: 402,78
a
19. Steyerberg, E. W., Eijkemans, M. J. C., Boersma, E., and Habbema, J. D. F., Applicability of clinical prediction models in acute myo-cardial infarction: a comparison of traditional and empirical Bayes adjustment methods.Am. Heart J.150(5):11–17, 2005.
20. Saczynski, J. S., et al., Declining length of stay for patients hospi-talized with AMI: impact on mortality and readmissions.Am. J. Med.11:1007–1015, 2010.
21. Iezzoni, L. I., Risk Adjustment for Measuring Healthcare Outcomes, 2nd edition. Health Administration Press, Chicago, 1997. ISBN 1-56793-054-9.
22. Bertomeu, V., et al., In-hospital Mortality due to acute myocardial infarction. relevance of type of hospital and care provided. RECALCAR study.Rev. Esp. Cardiol. (Engl. Ed.)66(12):935– 942, 2013.
23. McCullough, E., et al., Challenges and benefits of adding laborato-ry data to a mortality risk adjustment method.Qual. Manag.Health Care20(4):253–262, 2011.
24. Park, H. K., Comparison of risk-adjustment models using adminis-trative or clinical data for outcome prediction in patients after myo-cardial infarction or coronary bypass surgery in Korea.Int. J. Clin. Pract.61(7):1086–1090, 2007.
25. Tanuja, S., Acharya, U. D., and Shailesh, K. R., Comparison of different data mining techniques to predict hospital length of stay.
J. Pharm. Biom. Sci.7:1–4, 2011.
26. Asadollahi, K., Hastings, I. M., Gill, G. V., and Beeching, N. J., Prediction of hospital mortality from admission laboratory data and patient age: a simple model. Emerg. Med. Australas. 23: 354–363, 2011.
27. Hosmer, D. W., Jr., Lemeshow, S., and Sturdivant, R. X.,Applied Logistic Regression, 3rd edition. Wiley, Hoboken, 2013. 28. Faraway, J. J.,Does Data Splitting Improve Prediction?Cornell
University Library, Ithaca, 2013.
29. Takahashi, T., et al., Relation between neutrophil counts on admis-sion, microvascular injury, and left ventricular functional recovery in patients with an anterior wall first acute myocardial infarction treated with primary coronary angioplasty.Am. J. Cardiol.100(1): 35–40, 2007.
30. Khan, H. A., Alhomida, A. S., Rammah, T. Y. A., Sobki, S. H., and Ola, M. S., Alterations in prothrombin time and activated partial thromboplastin time in patients with acute myocardial infarction.
Int. J. Clin. Exp. Med.6(4):294–297, 2013.
31. Moradkhan, R., and Sinoway, L. I., Revisiting the role of oxygen therapy in cardiac patients.J. Am. Coll. Cardiol.56(13):1013– 1016, 2010.
32. Stub, D., et al., Air versus oxygen in ST-segment elevation myo-cardial infarction.Circulation131:2143–2150, 2015.
33. Fontainea, P., et al., Assessing the causes inducing lengthening of hospital stays by means of the appropriateness evaluation protocol.
Health Policy99:66–71, 2011.
34. Geissler, A., Kreinsen, D. S., and Quentin, W., Do diagnoses-related groups appropriately explain variations in costs and length of stay of hip replacement? A comparative assessment of DRG systems across 10 European countries.Health Econ.21:103–115, 2012.