49 The European Journal of Management
Studies is a publication of ISEG, Universidade de Lisboa. The mission of EJMS is to significantly influence the domain of management studies by publishing innovative research articles. EJMS aspires to provide a platform for thought leadership and outreach.
Editors-in-Chief: Luís M. de Castro, PhD
ISEG - Lisbon School of Economics and Management, Universidade de Lisboa, Portugal
Gurpreet Dhillon, PhD
Virginia Commonwealth University, USA Tiago Cardão-Pito, PhD
ISEG - Lisbon School of Economics and Management, Universidade de Lisboa, Portugal
Managing Editor: Mark Crathorne, MA
ISEG - Lisbon School of Economics and Management, Universidade de Lisboa, Portugal
ISSN: 2183-4172 Volume 21, Issue 1
www.european-jms.com
SHORT-TERMISM IN EURONEXT
LISBON: AN EMPIRICAL ANALYSIS
Pedro Verga Matos and Miguel Coelho
ISEG – Lisbon School of Economics and
Management, Universidade de Lisboa, Portugal
Abstract
For several years, there has been an ongoing debate about one inefficiency of markets, namely, stock market myopic behavior or stock market short-termism. This inefficiency is described as being a situation where investors overvalue short-term earnings and undervalue long-term earnings. This study examines whether the Portuguese stock market exhibits such preference for short-term earnings for the period between 2000 and 2008, using the Abarbanell and Bernard (2000) accounting-based valuation model, which generates predictions about how prices should relate to book value, as well as expected short-term and long-term earnings. Empirical analysis is not conclusive. In fact the evidence collected for this period based on Abarbanell and Bernard’s (2000) cross-section analysis favours market efficiency and therefore we reject the claim of market myopia. According to this result, the Portuguese stock market assigns the same weight for all the value components of listed companies. Based on an innovative panel data analysis, we collected evidence on which market assumes a particular form of short-termism, as investors value efficiently book value and short-term earnings, but undervalue long-term earnings. This paper contributes with quantitative evidence for the rising public policy debate regarding the scale of short-termism in capital markets.
50
Introduction
The extent to which stock markets are efficient has been much discussed in the literature. According to Fama (1970), a market is considered efficient if prices always fully reflect available information.1 This paper examines one specific inefficiency of markets, which is described as being
the preference of capital markets for short-term earnings at the expense of long-term earnings (see,e.g., Miles, 1993 and 1995; Cuthbertson et al. 1997; Bushee, 2001; Abarbanell and Bernard, 2000).
The debate about the preference of capital markets for short-term dates back at least to the 1980s. By that time, starting in the United States of America (USA), a large number of mergers and acquisitions were motivated largely by financial engineering reasons, rather than for any strategic reason. Japanese and German firms were seen as being more competitive than their North American counterparts at the time, as they planned and followed long term strategies and had not entered the escalating cycle of mergers and acquisitions that had occurred in the USA, which lasted until the early 1990s (Tonello, 2005). The USA model was criticized for not having only a short time horizon (Poterba and Summers, 1995), but also an ineffective system of corporate governance2
and a high cost of capital. The priority was to maximize stock prices in the short-term, at the expense of the future performance of the business (Jacobs, 1991; Porter, 1992). Later, the crisis at Enron and the rise of executive compensation faster than earnings together with a reduction in the security of employment for most workers and the financial crisis brought the topic to the centre stage (Tricker, 2012). In recent, years this debate moved from the academic point-of-view to one about politics and regulatory analysis (e.g. CED, 2007; European Commission, 2011; Jackson and Petraki, 2011; Kay, 2012; Strand, 2015).
The current perception is that a short-term culture is installed. According to Moore and Walker‐ Arnott (2014), the short-termism approach is a behavioural and cultural paradigm which is spread among investors and is the consequence of an excessive pressure on listed companies to generate immediate financial returns for shareholders (and managers), penalizing the long term performance of companies. In fact, both the stock market bubble of 2000 and, more recently, the deep crisis and economic uncertainty raised questions about the lack of a long-term view for companies and investors alike. Davies and colleagues (2014) reported a survey of members of the Investment Managers Association which found that a third of members believe that their mandates encourage
1
The author has defined three levels of efficiency: 1st - prices reflect all information about historical prices (weak form); 2nd - prices reflect not only their past behaviour, as well as all other published information (semi-strong form); 3rd
- additionally prices reflect information that is public information, which can be obtained through a detailed analysis of business and the economy (strong form). The efficient capital markets hypothesis asserts that the current market prices of any security is reflective of all materially relevant information.
2
51
short-termism. The focus on quarterly results, the maximization of short-term earnings, the failure to pursue strategies that create value in the future, and the decrease of firms’ performance in a wider horizon are all interpreted as being features of a term culture. Summing up, short-termism involves a relative preference for strategies and investments that add less value, but has an earlier payback relative to strategies and investments that would create more value in the long run (Jackson and Petraki, 2011). At company level, this culture can increase the cost of capital and, at an aggregated level, it leads to a decrease in long-term investments and a loss of competitiveness (Jacobs, 1991). Davies et al., (2014) also reported the same perspective. Taken to a national level, a regular choice for short term investments will lead to a sub-optimal level of long term investments and a reduction in national competitiveness and economic growth (Dore, 2000).
In the literature, this phenomenon is called myopia and it is divided into two types: management myopia and market myopia. This study will focus on the latter and seeks to test whether, in fact, capital markets do overvalue short-term earnings. If markets overestimate short-term earnings, then they may cause myopic behaviour in managers, as they may be induced to focus on immediate results to avoid the risk of a takeover (Stein, 1988). That is also the perspective of Jackson and Petraki (2011), who mention a self-reinforcing shortening of time-horizons, caused by the relationship of investors and managers incentives. Thus, the study of market short-termism could also help provide some answers for the study of management myopia.
Despite not being a recent subject, the study of markets’ preference for the short term is limited to a few empirical studies, focussed mainly on the United Kingdom (UK) and USA capital markets. In these studies, some evidence is presented which supports the hypothesis of short-termism in both these capital markets. However, in general, the empirical evidence of all these studies is scarce, or even controversial.
The empirical analysis of market myopia can be demonstrated in two ways: by testing if markets systematically underestimate cash flows for more distant horizons, and by testing if markets apply higher discount rates to expected long-term cash flows.3 This paper tests the preference of
Portuguese capital markets (Euronext Lisbon) for the short-term, examining whether this underestimates (overestimates) expected cash flows over the long term (short term). The analysis provides a contribution to the existing literature (e.g. Jacobs, 1991; Porter, 1992; Laverty, 1996) by studying the capital market of a small southern European country, where, in spite of the European Single Capital Market, the Latin model of corporate governance (La Porta et al, 2000) is still dominant.
52
The test will be carried out under the null hypothesis of market efficiency, relying on an accounting-based valuation model used by Abarbanell and Bernard (2000), which is an adaptation of the Ohlson (1995) and Feltham and Ohlson (1995) model.
In Section 2, we present a review of the existing literature on the subject. Section 3, contains a description of the valuation model and methodology. We describe our data and data sources in Section 4, and Section 5 presents the empirical results. The conclusions are provided in Section 6.
Literature Review
The existence of economic short-termism has been accepted by some researchers, regulators and policy makers. However, this question has not been consensual and has generated debate. Critics argue that the efficiency of markets and its ability to optimize the relation between short-term performance and long-term investment (e.g., Fama, 1970 and 1998; Jensen, 1986) eliminates this perspective.
Some evidence of stock market myopia
Up until now, direct evidence of short-termism has been limited and empirical studies tend to focus on UK and US data. For example, Miles (1993) found evidence that discount rates applied to long-term cash flows are twice the rates applied to short-long-term cash flows in the UK stock market. In line with this work, and also based on the UK stock market, Cuthbertson et al. (1997) found that agents give too little weight to future dividends and returns.
Abarbanell and Bernard (2000) rely on an accounting-based valuation model which led to conflicting results. In a first test4, the authors found evidence that investors underprice long-term earnings.
Through a second test of trading strategies which exploit mispricing caused by market myopia, they conclude that measurement error is the likely explanation for the observed values of the coefficients and thus stock prices do not generally exhibit myopic behaviour.
Focussing on institutional investors, and using the same methodology as Abarbanell and Bernard (idem), Bushee (2001), found that for the US stock market, the ownership level by institutions with short-term horizons (“transient” institutions), as opposed to institutions that held stringent fiduciary standards (bank trusts), is positively associated with the amount of firm value in near-term earnings and is negatively associated with the portion of value in long-term earnings. The results also indicated that a considerable degree of ownership held by "transient" institutions is associated with a significant overstating of short-term earnings.
In a more global perspective, Black and Fraser (2002) tested whether the stock markets of Australia, Germany, the US, Japan, and the UK overweight short-term cash flows. The main results
4Regressions of actual stock prices against book values and near-term and long-term expected earnings – empirical
53
show that, by considering a time horizon of five years for cash flows and a risk premium variable over time, there is indeed some degree of myopia in the markets studied, although to a lesser extent in Germany, the USA and Japan, when compared with Australia and the UK. For an infinite time horizon, the authors conclude that the degree of myopia in the US market is now closer to the level of Australia and the UK. However, the degree of persistent under-valuation of future cash flows is far higher in the UK.
Explanations for Market Short-termism
The preference of the stock markets for immediate earnings has been attributed by some for causing myopic behaviour in the economy in general and for management in particular. However a question arises: what are the causes for the shortsightedness of markets?
For Vives (1995), this focus on the short-term may arise from investors’ liquidity needs, together with incentives associated with short term performance indicators for investment fund managers and difficulties in financing long term projects derived from the imperfections of capital markets. Others point out as influencing factors the following: structure and ownership, the characteristics of financial systems, the nature and content of information disclosed by companies, the role of financial analysts, and information asymmetry.
Porter (1992) argued that the loss of competitiveness of the US economy and the underinvestment in long-term projects is the result of its system for allocating investment capital. According to Porter (idem), US funds provided by investors move quickly from firm to firm, based on perceptions of opportunities for short-term gains ("fluid capital"). The main players are institutional investors that have gained more weight in the markets. This type of investor, with their highly diversified portfolio and high turnover, only has financial objectives, and, as their managers are evaluated by their performance for the immediate timeframe, understandably the focus is on the short-term pay-back of their investments. In contrast, the major shareholders in Germany and Japan are banks and other firms, both of which have significant levels of ownership, for long periods of time ("dedicated capital"), and as such, they have the incentives and ability to engage in the business of the firms in which they invest. Consequently, their main concerns are twofold: the future sustainability of the firm and its growth in the long-term5.
Similarly, Charkham (1995) refers to the fact that the German and Japanese system are characterized by cross shareholding between firms and banks, and that they play a central role in business financing and in promoting partnerships based on the long-term. Inversely, in the US, both individual and institutional investors play a major role, being more oriented for the short-term. Individual investors, except very wealthy ones or those with substantial levels of ownership, face
5Segelod (2000), comparing US and Swedish top executives shows that the Swedish fell less pressure from the capital
54
the “free rider problem” and have no “voice” (Hirschan (1970) in the company. Institutional investors are more concerned with the annual profitability of their investments, and thus unprofitable firms will be sold, and even if they want to exert some influence on firms, this is constrained by their highly diversified investment portfolios.
Institutional investors have been mentioned as being one of the main elements responsible for this short term perspective. Whereas some institutional investors (pension funds or insurance companies) are engaged in actively monitoring firms and in holding shares for a long term perspective (Bushee (1998), Gaspar et al. (2005), Callen and Fang (2013), others (investment funds or hedge funds, for example) are short term oriented. For example Keasey et al. (1997) mention that agency problems between fund managers and clients (savers) can lead to a demand for short-term earnings. However, having this type of investor as a reference role in developed stock markets, the adoption of a strategy of greater shareholder activism with long-term positions reduces the volume of transactions and causes liquidity problems with a corresponding large impact on market efficiency (Keasey et al., 1997). We are therefore facing a choice between market liquidity and greater shareholder activism. Bhide (1993) argues that the liquidity of the market favours a climate of myopia. The US policies introduced to protect small shareholders have restricted the role of financial intermediaries in corporate governance and has encouraged the fragmentation of their investment portfolios. Thus, with increasing shareholder fragmentation, the liquidity of the market will increase, but the monitoring of firms by shareholders will be lower.
55
performance and collectively, together with the management, they express their concerns (the “Wall Street rule”).That is the option proposed by Hirschman (1970), between exit/sell shares, or voice/participate in the General Meeting of shareholders. More recently, Gigler and colleagues (2014) analyzed the frequency of financial reporting, concluding that increased frequency increases the probability of managerial short-termism. The conventional perspective is that “more information is preferred to less”, which reduces informative asymmetry across investors and other stakeholders and also creates more frequent price pressure, which encourages managers to adopt myopic strategies (Moore and Walker-Arnott (2014) follow this approach).
Short-Termism Consequences
If short-termism exists, what are the consequences? What is it impact on the economy and society in general and on business in particular?
Concerning the business scenario, several authors argue that myopic investors lead to myopic managers. A preference for immediate gains on the stock markets is partly caused by the fact that executive compensation is linked to the short-term performance (Bolton et al., 2006; Walker, 2010; Rappaport, 2005). The results of this causality include the sacrifice of long-term value and investments and also the inefficiency of investments and earnings management (earnings management, according to Bergstresser e Philippon (2006), is the use of accruals to achieve the desired earnings/returns). Bushee (1998) and Graham et al. (2005) found that executives are willing to sacrifice value, in order to achieve market expectations for short-term earnings. Bergstresser and Philippon (2006) stated that earnings management is higher in firms where the CEO's compensation package is very close to, or is sensitive to the stock price.
Corporate governance is another area where investors’ time horizons may have an impact. As mentioned by Gaspar et al. (2005), it is expected that investors with short time horizons have little incentive to expend resources in monitoring managers, since shareholders will not be around long enough to appreciate the benefit of such monitoring. In the case of firms with weak monitoring, it is more likely that their managers put their own interests before those of shareholders (from a survey by Dallas (2011)).
56
Finally, in a more global perspective, Martin (2010) divides modern capitalism into two phases: firstly, managerial capitalism, from 1933 to 1976, brought about by the advent of the professional manager, separate from the owners of capital (see the important work of Berle and Means (1932); and then, secondly, shareholder value capitalism, from 1976 up until the present (conceptual framework based on Jensen and Meckling’s (1976) paper): For Martin (idem), the severe economic and financial crisis showed that the ideas inherent in this last phase are now exhausted. The implication of this culture is clear: managers are focused on maximizing share value for shareholders. This value is translated into the stock price, based on the expectations of future cash flows of the firm. As expectations about future performance cannot be increased infinitely, and as they are often cyclical, managers have adopted short-term strategies. Therefore investors began to be addicted to the short-term, rather than to future sustainability and the value of their firms (according to Strine (2011). Companies cannot therefore be managed for the long term, unless their stakeholders are also focused on the long term). This logic ended up as a prisoner of short-term earnings and was responsible for the constant fluctuations in stock prices and is based on purely financial businesses. Martin (2010) argues that it is time to make room for a third type of capitalism: customer capitalism. Firms should focus on maximizing customer satisfaction and on recovering the ideas of Peter Drucker, in which the primary objective of business should be winning and retaining customers. But could this be managed?
Firm Fundamental Value – Valuation Model
Stock Price
Following the accounting-based valuation model developed by Abarbanell and Bernard (2000), the value of a firm’s equity can be expressed as the sum of its discounted expected dividends:
1
(
1
)
)
(
i
i i t t t
r
d
E
P
(1)
where
P
t = value of firm’s equity (or stock price, if expressed in per-share terms),E
t(
d
ti)
isthe expected future dividends for period t+i conditional on information available at time t, and r is the discount rate.
Adopting the valuation model of Ohlson (1995) and Feltham and Ohlson (1995), we can rewrite Eq. (1) in terms of accounting numbers. The only prerequisite for this transformation is that firm’s earnings and book value are forecasted in a manner consistent with Clean Surplus Accounting:6
6Clean surplus accounting means that all those changes in shareholder equity that do not result from transactions with
57
dt
xt
bt
bt
1
(2)where
b
tis the book value at time t andx
t is earnings for the period from t-1 to t.Combining the clean surplus relation in Eq. (2) with the dividend discounting model in Eq. (1) yields:
1 1)
1
(
)
(
i i i t i t i t t tr
b
x
b
E
P
(3)Algebraic manipulation allows Eq. (3) to be rewritten as
)
1
(
)
(
)
1
(
)
(
1 1r
b
E
r
rb
x
E
b
P
t ti i i t i t t t t (4)
The last term in Eq. (4) is assumed to be zero, so the stock price can be expressed by
1 1)
1
(
)
(
i i i t i t t t tr
rb
x
E
b
P
(5)Eq. (5) is the residual income version of the dividend-discounting model and splits the equity value into two components: an accounting measure of the capital invested (bt), and the present value of
future residual income or abnormal earnings (Frankel e Lee, 1998). This equation has two major advantages: first, it creates a relationship between accounting figures (and perspective) and firm value (Frankel e Lee, 1998), and; second, it allows for the definition of the value of a firm in terms of forecasted earnings, which is the variable that investors are supposed to consider myopically (Abarbanell e Bernard, 2000). Each of these advantages has led to several empirical approaches from the residual income model of Feltham and Ohlson (1995).7
Estimating the Model for a Test of Market Myopia
Eq. (5) expresses firm value within an infinite time horizon, but this is not practical for an empirical approach. A residual value beyond the forecast period (e.g., up 3 or 4 years) is therefore necessary. Therefore we followed the approach of Frankel and Lee (1998), and expand Eq. (5) to T terms, and then take the next term (T+1) in the expansion as being perpetuity:
r
r
rb
x
E
r
rb
x
E
b
P
t T T TT i i i t i t t t t
)
1
(
)
(
)
1
(
)
(
1 1 1
(6)58
For testing market myopia purposes Eq. (6) has, according to Abarbanell and Bernard (2000), the advantage of decomposing equity value into earnings which need to be reported at different points on the forecast horizon, with a near-term defined by period T, and a long-term represented by years beyond T.
Although the definition of what is short and long-term is not widely accepted (e.g., short-term could be next year, or during the next two years), and as such a definition could influence the results on the assumption of shortsightedness, in this paper we have adopted Abarbanell and Bernardis’ (2000) definition of short-term as being abnormal earnings for next year, and long-term abnormal earnings being for years t+2 and t+3, plus the residual value. Later on we execute tests of sensitivity, using another definition of short and long-term.
The present definition of short and long-term is not the only issue that arises in the empirical application of this model. Another question regards the time horizon to be considered in the study: what is the horizon for the forecasts of book value and earnings which best allows for obtaining an accurate value of the firm? Bernard (1995) argued that the answer to this question lies in the "quality" of the accounting system, with high quality systems reflecting value over a shorter forecast horizon. By means of an empirical verification, the author proves that a timeframe of four years can accurately explain the stock price through the estimates of both book value and earnings for that period of time. This evidence supports the timeframe we used for this study - four years. Moreover, in our analysis, the fourth year is considered to be in perpetuity, which also reflects the residual value of the equity value or stock price.
We are now able to present a framework applicable to our analysis. Using the same assumptions as Abarbanell and Bernard (2000), where the expectations of future earnings and future book value are efficient with respect to information available to the market at time t will be discounted at a rate required in an efficient market, then Eq.(6) reflects the price in an efficient market. For the purposes of our test, from Eq. (6) we can build the following cross-sectional regression (subscript
j represents the firm):
jt t j t j t i i t j i t j t t j t j t jt jt
r
r
rb
x
E
r
rb
x
E
r
rb
x
E
b
P
i
31 4 , 4 , 1 , , 3 1 1 , 1 , 2 1 0
)
1
(
)
(
)
1
(
)
(
)
1
(
)
(
3 2 (7)Market efficiency predicts that β0 = 0 e β1 =β2 =β3 = 1 (null hypothesis). If there is some form of
market myopia then β1 > 1, β2 > 1 e β3 <1 (alternative hypothesis).
Data
59
The myopia test is carried out for the Portuguese stock market, specifically for the PSI20 index (which is composed of the 20 largest listed companies, by market capitalization, on Euronext Lisbon), over the period of 2000 - 20088 (period prior to the financial crisis). Therefore nine
cross-sectional regressions will be made, one for each year, using the data of the companies that comprise the index. In fact, the 20 companies in the PSI20 index represent half of the listed companies in Euronext Lisbon, and, in each year of the period, more than 60% of its turnover and 80% of market capitalization. Consequently, we analyze a representative sample of the Portuguese capital market.
For the purpose of a market myopia test, we will use values expressed in per-share terms. The stock prices come from the Bloomberg database and refer to the last trading day of the first semester of each year. For book value, we will use the actual values and the forecasts. Actual values were obtained from the Bloomberg database and refer to the beginning of each year. The forecasts are based on a consensus analyst derived from the I/B/E/S database.9 Furthermore, forecasts of
earnings per-share are obtained from I/B/E/S, and are the consensus analyst.
For each year, an estimation of regression (7) is made with reference to the closing price of the stock on the last day of the first semester. The book value (actual value) corresponds to the beginning of the reporting year and the forecasts used for earnings per share and book value are issued in the I/B/E/S Statistical Period10 immediately preceding the date of the price (normally a few
days before the last trading day of June). This ensures that all price variables are already known at the time of listing.11
Given the first definition above of short-term that we aim to test, we exemplify below the use of each measure: for year 2000 the reference price used was the closing of June 30th (the last trading
day of 1st semester), the book value is the actual value at the date of January 1st; the forecasts for
short-term earnings are those issued in June 2000 and for the fiscal period ending on December 31st of 2000 (FY1)12; earnings forecasts two-years-ahead (FY2) are those issued in June 2000 and
for the fiscal period ending on December 31st of 2001; for three-years-ahead (FY3) we used the
earnings forecasts issued in June 2000 referring to December 31st of 2002; earnings for
8Listed firms adopted IAS/IFRS in 2005. However, since Preto Costa and Teixeira Lopes (2010) work concluded that the
implementation of IFAS, do not had statistically significant effects on the book value of companies in the PSI 20 (but in some other items of the financial statements), which is the only accounting variable of Abarbanell and Bernard (2000) model, we do not control for this accounting change.
9
I/B/E/S database provides estimates up to 5 years, 8 quarters, or four semesters for various financial and accounting variables and (book value, earnings, dividends, sales, cash flow, etc.). For some of these metrics also provides an estimate of the long-term growth. I/B/E/S contains the historical estimates for the USA since 1976 and since 1987 for other world markets.
10
I/B/E/S Statistical Period is the date on which the summary statistics (mean estimate of earnings per share, mean estimate of book value per share, or other) was calculated and published in the database.
11
Sometimes there was no published forecast in June by I/B/ E/S, and in these cases we used either the last estimate published before the reference price, or, if it did not exist, we then used the estimate made up until two months after the date of the reference price. According to Frankel and Lee (1998), forecasts of analysts are already public long before they are integrated and published in the I/B/E/S.
12I/B/E/S notation for the estimates for the year immediately following that for which actual results are already public. FY2
60
ahead are the forecasts issued in June 2000 regarding December 31st of 2003 (FY4). Sometimes
there is no I/B/E/S earnings estimate for FY4 and in these cases we apply the estimated long-term growth rate (Ltg) for earnings per share to FY3 in order to calculate FY4. When there is no estimate for FY4 cumulatively in the I/B/E/S, then for the long-term growth rate we used the earnings growth rate recorded between FY2 and FY3 (Frankel and Lee, 1998).
For the forecasts of book value we followed the same reasoning described for earnings per share, the difference being that this is not necessary for the long-term growth rate.
By following this framework it was not always possible to integrate into the model all the 20 companies of the index, as, for some companies and in some years, no forecasts were available, or they existed, but were issued on much later dates (more than 2 months) than those that report to the stock price. Due to this, our sample size was, on average, 14 firms per year, for a total sample size of 125 firms.
For the empirical application of the model it is necessary to calculate the discount rate. This rate is the cost of equity capital (re), which reflects the premium demanded by equity investors to invest in a firm or project of comparable risk. To calculate the cost of equity capital, we use the CAPM (Capital Asset Pricing Model) model of asset valuation of Sharpe (1964), Lintner (1965) and Mossin (1966):
)
(
r
r
r
r
e
f
m
f (8)where, rf is the risk free rate, β is the measure of volatility or systematic risk of the stock, and rm –rf isthe market premium or risk premium.
As a proxy for the risk free rate (rf), we use the yield to maturity on Portuguese government bonds
which was, for the period of 1999 – 2008, 4.5% (CMVM (2008)). The β used were firm specific and for each year – 2000 to 2008. These were obtained from the Bloomberg database. Finally, the risk premium (rm–rf) that is used is based on the existing literature on this subject for the Portuguese
market (Duque et al (2008)). For Eq. (8), using the above mentioned parameters, we determined a discount rate (re) for each year and firm. These are the rates at which abnormal earnings are
discounted.
Empirical Results
61
Short-term analysis (Model A)
T
ab
le 1
–
Stoc
k
P
ri
c
es
r
eg
res
si
o
n
f
o
r eac
h
y
ear
(Sh
o
rt
-t
erm
=
1
y
62
Table 1 reports the estimations for parameters that can be used to analyze short termism as described above by Ed. (7). Using the Durbin-Watson (d) statistic, as showed in Table 1, we concluded that there were no first-order autocorrelation in the annual series, and by using White’s test for heteroscedasticity, we found that the disturbance variance is constant across observations for each year (Wooldridge (2009). By the VIF (Variance Inflation Factor) test we can state that there are no multicollinearity in our model (tolerance near zero and VIF<10).
In our estimate of Eq. (7), year by year we found that a large proportion of the total variation of stock price is explained by its linear relationship with the explanatory variables – the average of the adjusted R2 is 0.66 (Max adjR2=0.80, 2004; min adjR2=0.51, 2008). As for the statistical relevance
of the coefficients of the explanatory variables, only the book value at the beginning of the year is statistically significant (at a level of 5%) for all the years, except for year 2000. Caution is required when making statistical inferences for each coefficient, and also in drawing conclusions from the model, due to the small size of the sample.
Given these limitations, and also bearing in mind the potential extent of bias that would result, we proceeded to test the myopia in each of the annual series, based on the results of Table 1: H0:
β1=β2=β3=1 vs. H1: β1>1; β2>1 e β3<1. The null hypothesis represents market efficiency, and the
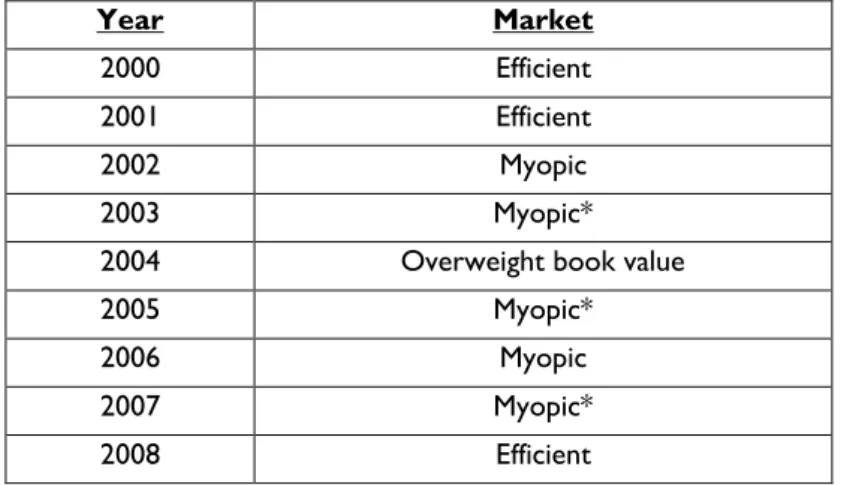
alternative hypothesis is the form of market myopia. Table 2 presents the characteristics of the market for each year, based on statistical tests carried out at a significance level of 5%.
Table 2 – Annual characteristics of the market (Short-term = 1 year)
As we can see, the Portuguese stock market has myopic characteristics in 2002, 2003, 2005, 2006 and 2007 – for the years 2003, 2005 and 2007 assumes a particular characteristic (*), whereby investors overweigh the book value (β1 > 1), whose weight efficiently forecasted abnormal earnings
for the coming year (β2 = 1), and understate forecasted abnormal earnings beyond one year (β3
<1). For 2000, 2001 and 2008, the efficiency hypothesis is respected, in that investors weigh equally
Year Market
2000 Efficient
2001 Efficient
2002 Myopic
2003 Myopic*
2004 Overweight book value
2005 Myopic*
2006 Myopic
2007 Myopic*
63
book value and forecasted abnormal earnings one-year-ahead and beyond a one-year horizon (β1
= β2 = β3 = 1 ). Year 2004 is an interesting year, during which investors overweigh the book value
which incorporates, not only the capital already invested in the company, but also the earnings that have already occurred and they efficiently weigh the abnormal earnings expected during the short and long-term (β1> 1 and β2 = β3 = 1). Such may be the accounting-based perception of value in
which much of the fundamental value perceived by investors is that which is already recognized in company accounting records. Therefore, that which most influences the stock price and changes it, is the portion of equity already recognized in prior years. To our knowledge, there is no reference in the literature to this feature. However, this finding can be justified in part by the results reported by Dechow et al. (1999), which indicate that the book value contains some relevant information about the fundamental value of a company, beyond that which is incorporated into analysts' estimates for future earnings.
For a significance level of 10% the annual results are the same.
Table 3 presents the mean results for the whole period, from 2000 to 2008. We used the mean coefficients and the correspondent standard error based on the nine regressions estimated, and then calculates the respective t statistics and p-value.
Table 3 – Market Myopia test (Short-term = 1 year)
The mean adjusted R2 is 0.66 over the 2000 – 2008 sample period. As stated by Abarbanell and
Bernard (2000), a high level of explanatory power is consistent with market efficiency and low measurement error in the regressors, or the ability of some regressors to compensate for measurement error in the others. The statistical relevance of the coefficients is similar to that of each annual series. At a significance level of 5% and 10%, only the book value at the beginning of the year is significant as explanatory variable.
Taking into account these statistical limitations, we carried out the following market myopia test for the sample period (2000 – 2008): H0: β1 = β2 = β3 = 1 vs. H1: β1> 1; β2> 1 and β3 <1. For both
64
Short-term analysis (Model B)
T
ab
le 4
–
Stoc
k
P
ri
c
es
r
eg
res
si
o
n
f
o
r eac
h
y
ear
(Sh
o
rt
-t
erm
=
2
y
ear
65
Table 4 reports the estimations for parameters that can be used to analyze short termism as described above by Ed. (7). In this model B we define short-term as being the expected abnormal earnings for the next two years (FY1+FY2), and thus the long-term earnings are the expected abnormal earnings beyond year two (FY3+FY4). As described in Section 5.1, and based on Table 4, we concluded that there was no first-order autocorrelation in the annual series, no heteroscedasticity, and no multicollinearity in our model.
Once again, by means of the estimation of Eq. (7) year by year, as presented in Table 4, we found that a large proportion of the total variation in the price of a share is explained by its linear relationship with the explanatory variables – mean adjusted R2 of 0.65 (Max adjR2=0,80, 2003; min
adjR2=0,50, 2001). With regards to the statistical relevance of the coefficients of the explanatory
variables, only the book value at the beginning of the year has explanatory power during most of the years (at a 5% level).
Based on Table 4, we proceeded to test the myopia in each of the annual series: H0: β1=β2=β3=1
vs. H1: β1>1; β2>1 e β3<1. Table 5 presents the characteristics of the market in each year based on
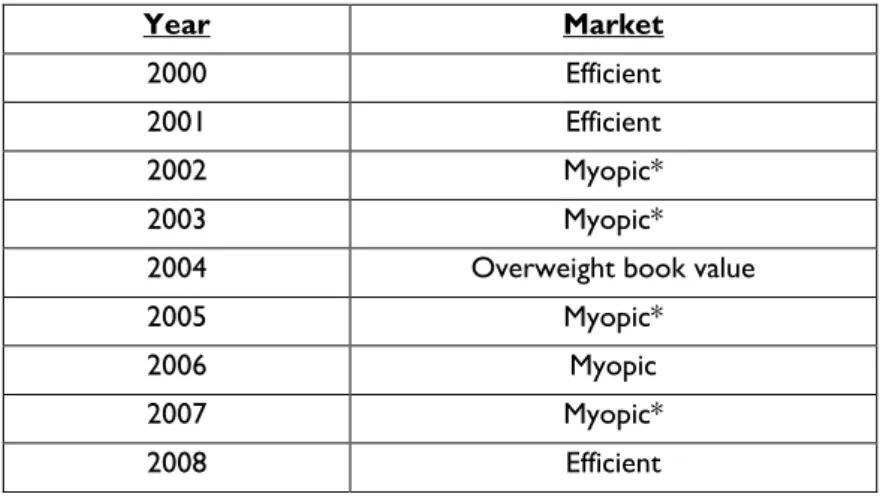
statistical tests carried out at a significance level of 5%.
Table 5 – Annual characteristics of the market (Short-term = 2 years)
The Portuguese stock market presents a special type of short-termism, as identified in the previous section, in the years 2002, 2003, 2005 and 2007. Investors overweigh book value (β1>1), whose
weight efficiently forecasted abnormal earnings for the next two years (β2 = 1), and underweigh
forecasted abnormal earnings beyond the second year (β3<1). In the years 2000, 2001 and 2008,
the market is efficient (β1=β2=β3=1). For the year 2004 the market overweighs book value and
weighs efficiently abnormal earnings for the short and long term (β1>1 e β2=β3=1).
Year Market
2000 Efficient
2001 Efficient
2002 Myopic*
2003 Myopic*
2004 Overweight book value
2005 Myopic*
2006 Myopic
2007 Myopic*
66
At a significance level of 10%, the only difference in market behaviour occurs in 2002. In 2002, the market turns to “pure” short-termism, overweight book value and forecasted abnormal earnings for the next two years and underweight forecasted abnormal earnings beyond the second year (β1>1; β2>1 e β3<1).
Table 6 presents the results for the whole period, from 2000 to 2008 (mean coefficients and the correspondent standard error based on the nine regressions estimated and calculated the respective t statistics and p-value).
Table 6 – Market Myopia test (Short-term = 2 years)
The mean adjusted R2 is 0.65 over the 2000 – 2008 sample period. The high level of explanatory
power is consistent with market efficiency and low measurement error in the regressors, or the ability of some regressors to compensate for measurement error in the others.
The statistical relevance of the coefficients is similar to that of each annual series. At a significance level of 5% and 10%, only the book value at the beginning of the year is significant.
Based on Table 6, we carried out the following market myopia test for the sample period (2000 – 2008): H0: β1 = β2 = β3 = 1 vs. H1: β1> 1; β2> 1 and β3 <1. For both significance level (5% and 10%)
we do not reject the null hypothesis, i.e., investors equally weigh book value and forecasted abnormal earnings for the short and long-term (market efficiency).
The sensitivity analysis for alternative definitions of short term shows that results do not change. For both definitions, the market is efficient at a 5% and 10% level.
A new empirical perspective: short-term analysis by panel data models
67
Tables 7 and 8 report the estimations of parameters (and other statistical indicators) considering both definitions of short-term explained above, and a fixed effect model (n=117). According to the Hausman specification test, under the current analysis we reject the random-effects models (Model A Hausman Test: Qui2=52.25 (0,000); Model B Hausman Test: Qui2=56.28 (0,000)). The R-square for model A is 0.4502 and for model B is 0.4484 (both within R-square)
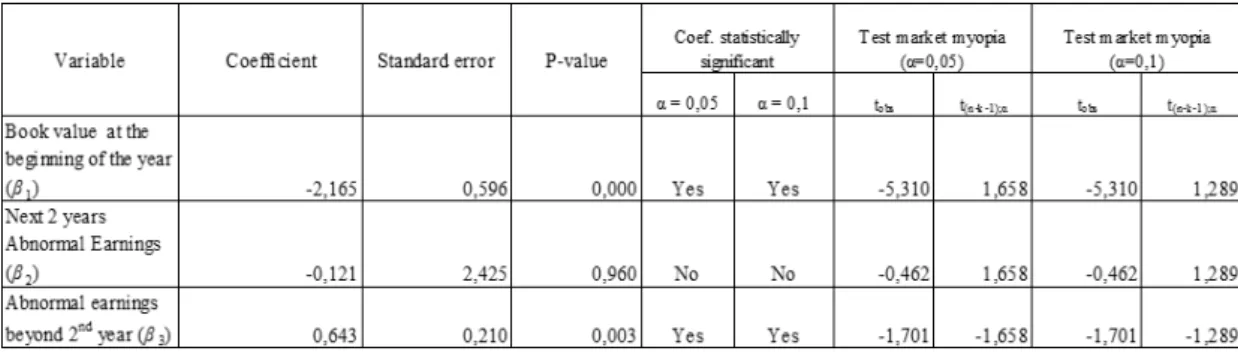
Table 7 – Market Myopia Test (Model A: panel data, short-term = 1 year)
Table 7 presents the results for the whole period (2000 – 2008) using panel data a panel data analysis. Regarding the statistical relevance of the coefficients of the explanatory variables, only abnormal earnings for the coming year are not statistically significant – at a level of 5% and 10%. In line with Abarbanell and Bernard’s (2000) perspective, we carried out the following market myopia test for the sample period: H0: β1 = β2 = β3 = 1 vs. H1: β1> 1; β2> 1 and β3 <1.
For both significance level (5% and 10%) Portuguese stock market assumes a particular myopic characteristic,wherebyinvestorsweightefficientlybookvalueandforecastedabnormalearningsfor theshort-term (β1 = β2 =1) and understate forecasted abnormal earnings for the long-term (β3 <1).
Table 8 – Market Myopia Test (Model B: panel data, short-term = 2 years)
68
Once again we carried out the following market myopia test for the sample period: H0: β1 = β2 =
β3 = 1 vs. H1: β1> 1; β2> 1 and β3 <1 and the conclusions are similar: for both significance levels
(5% and 10%), the Portuguese stock market assumes a particular myopic characteristic, whereby investors weight efficiently book value and forecasted abnormal earnings for the short-term (β1 =
β2 = 1) and understate forecasted abnormal earnings for the long-term (β3 <1).
Overall, the sensitivity analysis for alternative definitions of short term shows that results do not change. For both definitions, the market assumes a particular form of short-termism. To our knowledge, there is no reference in the literature to this feature. This finding could be justified by riskawarenessbyinvestorsaboutlong-termearningsinasmallcapitalmarketlikeEuronextLisbon.
Conclusions, limitations and directions for further research
The assumption that the capital market is efficient has been exploited for decades in financial research. Although, up until now, this hypothesis has not been completely ruled out, many researchers question it and consider that it is only a theoretical concept, which, as such, is not verified empirically. With several corporate scandals and the advent of the financial crisis in late 2007, the debate about market efficiency and the risk of short-term decisions has gained strength. Following this debate Mauboussin and Callahan (2015) considered that there is a broad consensus that short-termism exists and is harmful to investors, executives, companies and the economy. But, in spite of this, and according to Jackson and Petraki (2011) the study of short-termism has remained underdeveloped, receiving little critical academic scrutiny.
This paper aims to contribute to this field of research, providing more empirical evidence for the ongoing debate about market short-termism. As there is market inefficiency, we tested whether the Portuguese stock market was efficient, or not, with regards to the weight given to each of fundamental value components for firms, namely: the book value and abnormal earnings expected during the short and the long term.
69
However, for the entire period (Tables 3 and 6), through cross-section examination and for both definitions of short-term, our results support the hypothesis of the efficiency of the Portuguese stock market, at a significance level of 5% and 10%. However, using panel data examination (tables 7 and 8), we found evidence of a special form of myopic behaviour where Portuguese stock market value efficiently book value and short-term earnings but undervalue earnings for the long-term.
To clarify the conclusions stated here, it is necessary to mention that some components of the model used did not have statistical significance. As already mentioned, one possible explanation for this is the small sample size used, and the short time series. These limitations are due to the reduced number of analysts who follow listed firms on the Portuguese stock market, and the consequent lack, sometimes, of forecasts for book value and/or earnings. However, in the case of cross-section examination, we believe that our conclusions are not called into question, as, for a low level of significance (5%), the null hypothesis was not rejected, i.e., the efficiency hypothesis. On the other hand, the higher statistical robustness of the panel data methodology (Wooldridge, 2009) gives support to the myopic behaviour in the Euronext Lisbon capital market.
Two kinds of limitations were identified in this study: those related to the model itself, and those related to the data. The applied model uses estimates of book value and earnings and these should publicly fully reflect available information. If the estimates of I/B/E/S do not possess this property, the regression coefficients are expected to be biased. Concerning the data, small samples reduce the power of test statistics – a small number of firms and a reduced time series. The Portuguese stock market is still characterized by its small size and low level of liquidity. At the end of 2008, there were only 55 publicly-traded companies and some shares were not traded frequently. One consequence of this is the small number of analysts who follow the listed companies, even for companies in the PSI20 index. As such, estimates of earnings and book value were not carried out for several companies and/or years, restricting our sample. In spite of being a good sample for Euronext Lisbon (top 20 firms for market capitalization), we consider therefore that this situation (reduced number of firms, by year) constitutes a possible explanation for the statistical limitations observed in this study.
70
Acknowledgment
The authors are grateful for the comments of an anonymous referee and Profs. Eduardo Couto and Pedro Rino Vieira.
References
Abarbanell J, Bernard V (2000): Is the U.S. Stock Market Myopic? Journal of Accounting Research, 38(2): 221-242.
Aguilera R. V, Filatotchev I, Gospel H, Jackson G (2008): An organizational approach to comparative corporate governance: Costs, contingencies, and complementarities. Organization Science, 19(3): 475-492.
Bergstresser D, Philippon T (2006): CEO incentives and earnings management. Journal of Financial Economics, 80: 511–529
Berle AA, Means GC (1932): The Modern Corporation and Private Property Harcourt, Brace & World, Inc.
Bernard V (1995): The Feltham-Ohlson Framework: Implications for Empiricists. Contemporary Accounting Research, 11 (2): 733-747.
Bhide A (1993): The hidden costs of stock market liquidity. Journal of Financial Economics, 34(1): 31-51.
Black A, Fraser P (2002): Stock market short-termism - an international perspective. Journal of Multinational Financial Management, 12:135–158.
Bolton P, Scheinkman J, Xiong W (2006): Executive Compensation and Short-Termist Behaviour in Speculative Markets. Review of Economic Studies, 73(3): 577-610.
Bushee B. J (1998): The Influence of Institutional Investors on Myopic R&D Investment Behaviour.
The Accounting Review, 73 (3): 305-333.
Bushee B. J (2001): Do Institutional Investors Prefer Near-Term Earnings over Long-Run Value?.
Contemporary Accounting Research, 18 (2): 207-246.
Callen J. L, Fang X (2013): Institutional investor stability and crash risk: Monitoring versus short-termism? Journal of Banking & Finance, 37(8): 3047-3063.
71
Charkham J (1995): Keeping Good Company: A study of corporate governance in five countries. Oxford University Press, New York.
Clark GL (2010): Myopia and the global financial crisis: short-termism, context-specific reasoning, and market structure. SPACES online, 8 (Issue 2010-01).
CMVM - Comissão do Mercado de Valores Mobiliários (2008): Relatório Sobre a Situação Geral dos Mercados de Valores Mobiliários. CMVM, Lisboa.
Cuthbertson K, Hayes S, Nitzsche D (1997): The Behaviour of UK Stock Prices and Returns: Is the Market Efficient? Economic Journal, 107 (443): 986-1008.
Demirag I. S (1998): Boards of Directors' term perceptions and evidence of managerial short-termism in the UK. The European Journal of Finance, 4(3): 195-211.
Dallas L (2011): Short-termism, the financial crisis, and corporate governance. Journal of Corporation Law: 37, 264.
Davies R, Haldane A. G, Nielsen M, Pezzini S. (2014): Measuring the costs of short-termism. Journal of Financial Stability, 12: 16-25.
Dechow P. M, Hutton A. P, Sloan R. G (1999): An empirical assessment of the residual income valuation model. Journal of Accounting and Economics, 26 (1-3): 1-34.
Dobbs I. M (2009): How bad can short termism be? - A study of the consequences of high hurdle discount rates and low payback thresholds. Management Accounting Research, 20(2): 117-128.
Dore R. P (2000): Stock market capitalism: Welfare capitalism: Japan and Germany versus the Anglo-Saxons. Oxford University Press, New York.agule
Duque, J. L; Crespo, N. F; Matos P. V e Diogo, T. A (2008): “Avaliação Financeira das Alternativas de Localização para o Novo Aeroporto de Lisboa” (ISEG), in “Estudo para a análise técnica comparada das alternativas de localização do Novo Aeroporto de Lisboa”, LNEC (Proc. 0701/01/16911): 233-248
European Comission (2011), Green Paper The EU corporate governance framework COM(2011) 164 final, Brussels
Fama E. F (1970): Efficient Capital Markets: A Review of Theory and Empirical Work. Journal of Finance, 25(2): 383-417.
72
Feltham G. A, Ohlson JA (1995): Valuation and Clean Surplus Accounting for Operating and Financial Activities. Contemporary Accounting Research, 11 (2): 689-731.
Frankel R, Lee C. M. C (1998): Accounting valuation, market expectation, and cross-sectional stock returns. Journal of Accounting and Economics, 25(3): 283-319.
Froot K. A, Perold A. F, Stein J. C (1992): Shareholder Trading Practices and Corporate Investment Horizons. Journal of Applied Corporate Finance, 5(2): 42-58.
Froot K. A, Scharfstein D. S, Stein J. C (1992): Herd on the Street: Informational Inefficiencies in a Market with Short-Term Speculation. Journal of Finance, 47 (4): 1461-1484.
Gaspar J. M, Massa M, Matos P (2005): Shareholder investment horizons and the market for corporate control. Journal of Financial Economics, 76: 135–165.
Gigler F, Kanodia C, Sapra H, Venugopalan R. (2014): How Frequent Financial Reporting Can Cause Managerial Short‐Termism: An Analysis of the Costs and Benefits of Increasing Reporting Frequency. Journal of Accounting Research, 52(2): 357-387.
Gillan S. L (2006): Recent Developments in Corporate Governance: An Overview. Journal of Corporate Finance, 12: 381– 402.
Gillan S. L, Starks L. T (2002): Institutional Investors, Corporate Ownership and Corporate Governance: Global Perspectives. World Institute for Development Economics Research (UNU-WIDER), Discussion Paper Series No. 2002/9.
Gillan S. L, Starks L. T (1998): A Survey of Shareholder Activism: Motivation and Empirical Evidence.
Contemporary Finance Digest, 2 (3): 10-34.
Graham J. R, Harvey C. R, Rajgopal S (2005): The economic implications of corporate financial reporting. Journal of Accounting and Economics, 40 (1-3): 3-73.
Grinyer J, Russell A, Collison D (1998): Evidence of Managerial Short‐termism in the UK. British Journal of Management, 9(1): 13-22.
Hirschman A. O (1970): Exit, Voice, and Loyalty: Responses to Decline in Firms, Organizations, and States. Harvard University Press, Cambridge, MA.
Jackson G, Petraki A (2011): Understanding short-termism: The role of corporate governance. Glasshouse Forum, Stockholm
73
Jensen M. C (1986): The Takeover Controversy: Analysis and Evidence. Midland Corporate Finance Journal, 4 (2).
Jensen M. C, Meckling W. H (1976): Theory of the Firm: Managerial Behaviour, Agency Costs and Ownership Structure. Journal of Financial Economics, 3(4): 305-360.
Kay, J (2012): The Kay review of UK equity markets and long-term decision-making, Department of Business, Innovation and Skills, UK Government, London
Keasey K, Thompson S, Wright M (1997): Corporate Governance: Economic, Management and Financial Issues. Oxford University Press, New York.
La Porta R, Lopez-de-Silane, F, Shleifer A, Vishny R (2000): Investor protection and corporate governance. Journal of Financial Economics, 58(1): 3-27.
Laverty K. J (1996): Economic "Short-Termism", the Debate, Unresolved Issues and the Implications for Management Practice and Research. Academy of Management Review, 21(3): 825-860.
Lee C. M. C, Myers J, Swaminathan B (1999): What is the Intrinsic Value of the Dow? Journal of Finance, 54 (5): 1693-1741.
Lintner J (1965): The Valuation of Risk Assets and the Selection of Risky Investments in Stock Portfolios and Capital Budgets. Review of Economics and Statistics, 47 (1): 13-37.
Martin R (2010): The Age of Customer Capitalism. Harvard Business Review, (Jan-Feb): 58-65.
Mauboussin M. J, Callahan D (2015). A Long Look at Short-Termism: Questioning the Premise.
Journal of Applied Corporate Finance, 27(3): 70-82.
Miles D (1993): Testing for Short Termism in the UK Stock Market. Economic Journal, 103 (No. 421): 1379-1396.
Miles D (1995): Testing for Short Termism in the UK Stock Market: A Reply. Economic Journal, 105 (No. 432): 1224-1227.
Moore, M. T, Walker‐Arnott E (2014); A Fresh Look at Stock Market Short‐termism. Journal of Law and Society, 41(3): 416-445.
Mossin J (1966): Equilibrium in a Capital Asset Market. Econometrica, 34(4): 768-783.
74
Peterson R. M, Dibrell C. C and Pett, T. L (2003): Long-vs. short-term performance perspectives of Western European, Japanese, and US countries: where do they lie?. Journal of World Business, 37(4): 245-255.
Porter M. E (1992): Capital Disadvantage: America´s Failing Capital Investment System. Harvard Business Review, (Sep-Oct): 65-82.
Poterba J. M, Summers L. H (1995): A CEO survey of US companies´time horizons and hurdle rates. Sloan Management Review, 37(1): 43-53.
Preto Costa, J and Teixeira Lopes, P (2010): O impacto da adopção das IAS/IFRS nas demonstrações financeiras das empresas cotadas na Euronext Lisboa. Contabilidade & Gestão – Portuguese Journal of Accounting and Management, Vol.9, 49-86
Rappaport A (2005): The Economics of Short-Term Performance Obsession. Financial Analysts Journal, 61 (3): 65-79.
Segelod, E (2000): A comparison of managers’ perceptions of short-termism in Sweden and the U.S. International Journal of Production Economics, 63 (3): 243–254.
Sharpe W. F (1964): Capital Asset Prices: A Theory of Market Equilibrium under Conditions of Risk. Journal of Finance, 19 (3): 425-442.
Shleifer A, Vishny R. W (1997): A Survey of Corporate Governance. Journal of Finance, 52 (2): 737-783.
Stein J. C (1988): Takeover Threats and Managerial Myopia. Journal of Political Economy, 96 (1): 61-80.
Stein J. C (1989): Efficient Capital Markets, Inefficient Firms: A Model of Myopic Corporate Behaviour. Quarterly Journal of Economics, 104 (4): 655-669.
Strand T (2015): Re-Thinking Short-Termism and the Role of Patient Capital in Europe: Perspectives on the New Shareholder Rights Directive. Columbia Journal of European Law, 22 (1):
forthcoming
Strine Jr, L. E (2010): One Fundamental Corporate Governance Question We Face: Can Corporations Be Managed for the Long Term Unless Their Powerful Electorates Also Act and Think Long Term?. The Business Lawyer, 1-26.
Tonello M (2005): Revisiting Stock Market Short-Termism. The Conference Board, Research Report, No. R-1386-06-RR.
Tricker, B (2012): Corporate Governance: Principles, Policies and Practices, 2nd ed., Oxford University
75
Vives X (1995): Short-Term Investment and the Information Efficiency of the Market. Review of Financial Studies, 8 (1): 125-160.
Walker D. I (2010): The Challenge of Improving the Long-Term Focus of Executive Pay. Boston College Law Review, 51: 435-472.
Wooldridge M. J (2009): Introductory Econometrics: a Modern Approach. 4th ed, South Western,